Politics
Which Countries are the Most Polarized?
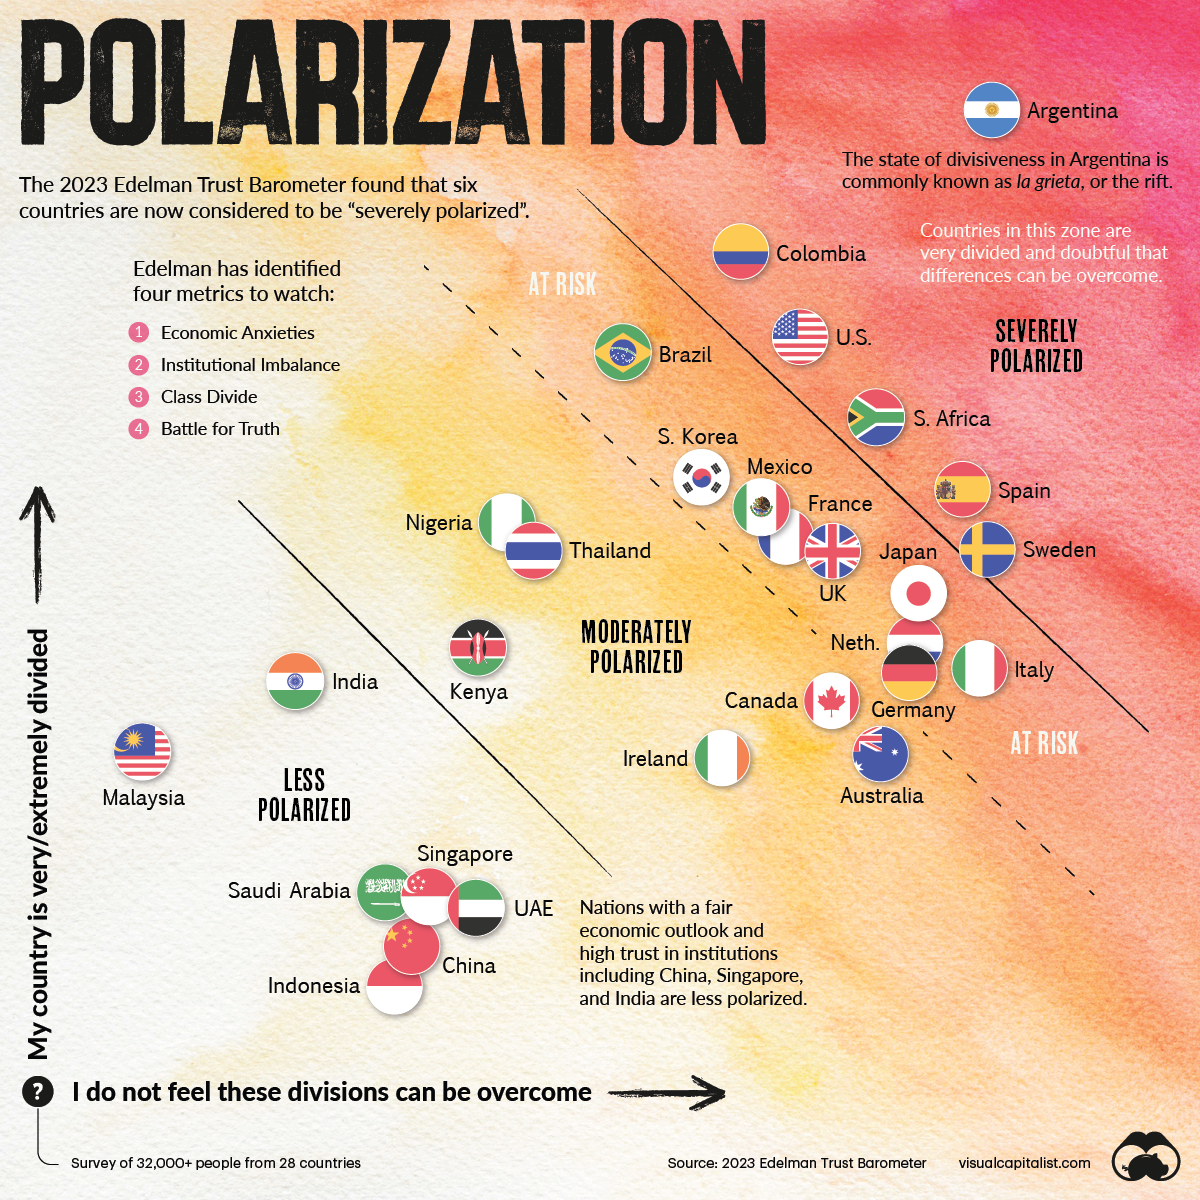


Which Countries are the Most Polarized?
How do you measure something that’s made headlines for half a decade but is still difficult to quantify? We’re talking about polarization.
Even within the social sciences, polarization covers everything from racial segregation, to labor skill levels, to class divide, to political ideology.
How Do You Quantify Polarization?
Edelman’s data on which countries are the most polarized comes from survey results asking respondents two very simple questions:
- How divided is their country?
- How entrenched is the divide?
The questions help bring to light the social issues a particular country is facing and the lack of consensus on those issues.
Plotted against each other, a chart emerges. A country in the top–right corner of the chart is “severely polarized.” Countries located closer to the lower–left are considered less polarized.
In the report, Edelman identifies four metrics to watch for and measure which help quantify polarization.
| Economic Anxieties | Will my family be better off in five years? |
| Institutional Imbalance | Government is viewed as unethical and incompetent. |
| Class Divide | People with higher incomes have a higher trust in institutions. |
| Battle for Truth | Echo chambers, and a low trust in media. |
Following Edelman’s metrics, countries with economic uncertainty and inequality as well as institutional distrust are more likely to be polarized. Below, we look at key highlights from the chart.
Severely Polarized Countries
Despite being one of the largest economies in Latin America, Argentina is the most polarized country surveyed by a large margin. Foreign loan defaults, a high fiscal deficit, and now surging inflation have created a perfect storm in the country.
43% of the Argentinian respondents said they will be better off in five years, down 17 percentage points from last year.
Along with fiscal upheaval, Argentinians are also dealing with enduring corruption in the public sector and abrupt policy reversals between governments. Only 20% of those surveyed in Argentina said they trusted the government—the least of all surveyed countries.
Here are all six of the countries considered to be severely polarized:
-
🇦🇷 Argentina
🇨🇴 Colombia
🇺🇸 United States
🇿🇦 South Africa
🇪🇸 Spain
🇸🇪 Sweden
In the U.S., heightened political upheaval between Democrats and Republicans over the last few years has led to strengthening ideological stances and to an abundance of headlines about polarization. Only 42% of respondents in the country trust the government.
And in South Africa, persistent inequality and falling trust in the African National Congress also check off Edelman’s metrics. It’s also second after Argentina with the least trust in government (22%) per the survey.
Moderately Polarized Countries
The biggest cluster of 15 countries are in moderately polarized section of the chart, with all continents represented.
-
🇧🇷 Brazil
🇰🇷 South Korea
🇲🇽 Mexico
🇫🇷 France
🇬🇧 United Kingdom
🇯🇵 Japan
🇳🇱 Netherlands
🇮🇹 Italy
🇩🇪 Germany
🇳🇬 Nigeria
🇹🇭 Thailand
🇰🇪 Kenya
🇨🇦 Canada
🇦🇺 Australia
🇮🇪 Ireland
Some are on the cusp of being severely polarized, including economic heavyweights like Japan, the UK, France, and Germany. On the other hand, smaller economies like Thailand, Kenya, and Nigeria, are doing comparatively better on the polarization chart.
Less Polarized Countries
Countries with fair economic outlook and high trust in institutions including China, Singapore, and India are in the bottom left sector of the chart.
-
🇮🇩 Indonesia
🇨🇳 China
🇦🇪 United Arab Emirates
🇸🇬 Singapore
🇸🇦 Saudi Arabia
🇲🇾 Malaysia
🇮🇳 India
It’s interesting to note that of the seven countries in that sector, three are not democracies. That said, there are also more developing countries on this list as well, which could also be a factor.
Looking Ahead
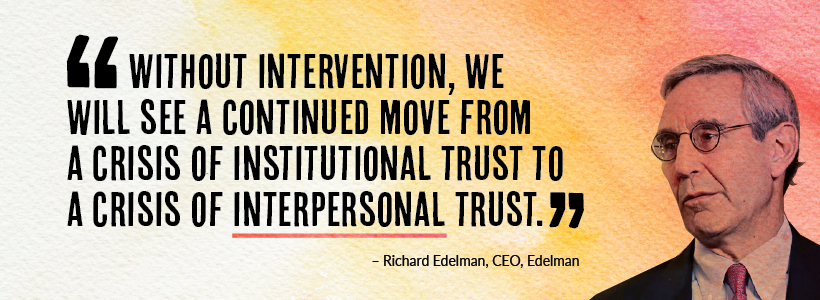
Edelman notes that polarization is both “cause and consequence of distrust,” creating a self-fulfilling cycle. Aside from the four metrics stated above, concerns about the erosion of civility and weakening social fabric also lead to polarization.
As global events unfold in 2023—including looming worries of a recession—it will be fascinating to see how countries might switch positions in the year to come.
Where does this data come from?
Source: The 2023 Edelman Trust Barometer
Data note: Survey conducted: Nov 1 – Nov 28, 2022. Survey included 32,000+ respondents in 28 countries. Russia was omitted from this year’s survey. See page 2 of the report for more details.


Politics
The Start of De-Dollarization: China’s Gradual Move Away from the USD
The de-dollarization of China’s trade settlements has begun. What patterns do we see in USD and RMB use within China and globally?


The Start of De-Dollarization: China’s Move Away from the USD
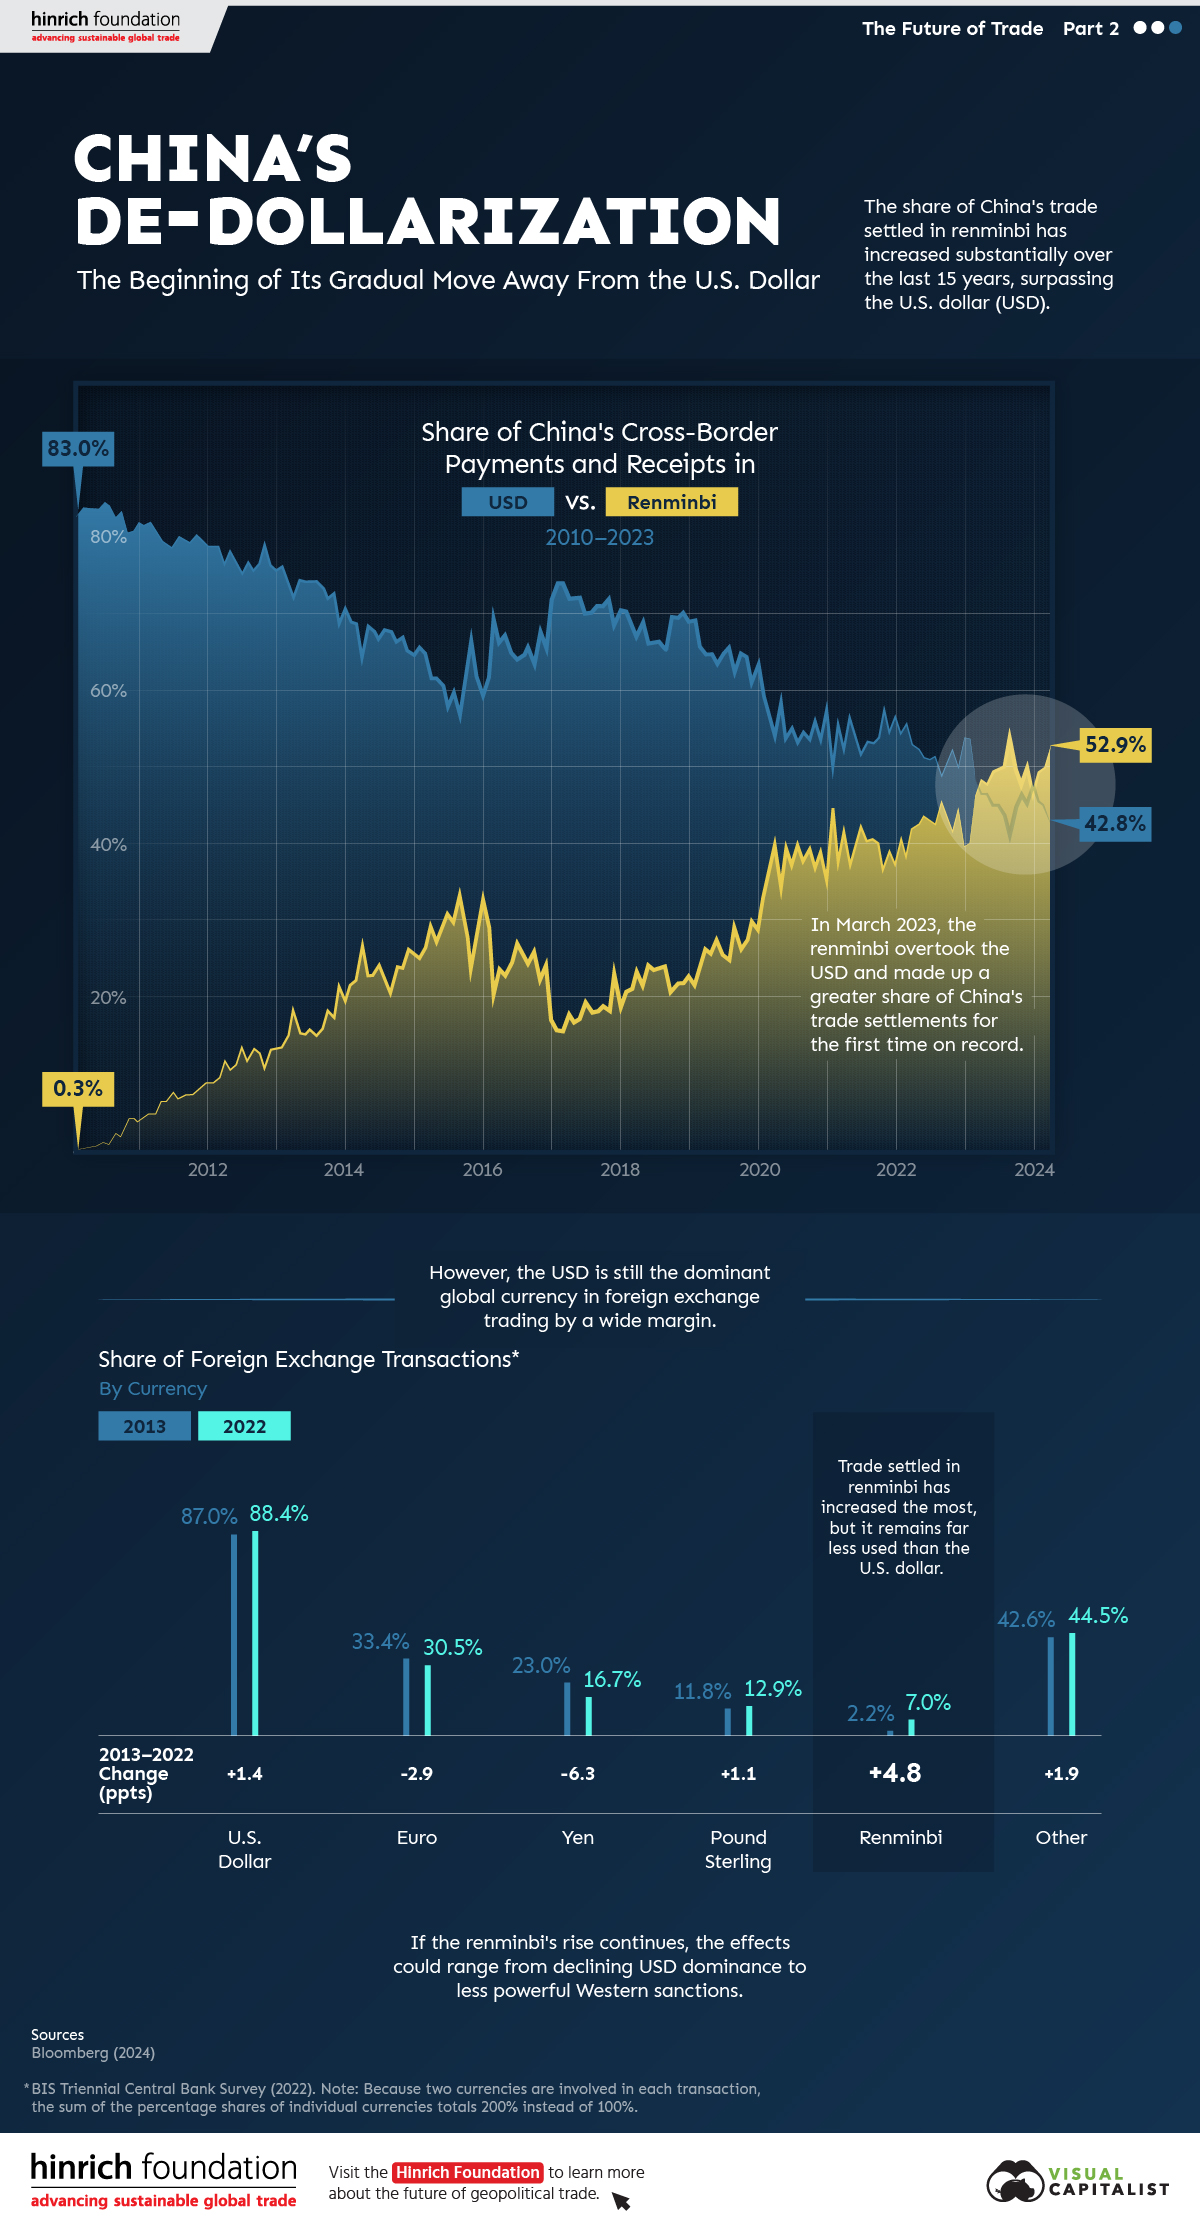
Since 2010, the majority of China’s cross-border payments, like those of many countries, have been settled in U.S. dollars (USD). As of the first quarter of 2023, that’s no longer the case.
This graphic from the Hinrich Foundation, the second in a three-part series covering the future of trade, provides visual context to the growing use of the Chinese renminbi (RMB) in payments both domestically and globally.
The De-Dollarization of China’s Cross-Border Transactions
This analysis uses Bloomberg data on the share of China’s payments and receipts in RMB, USD, and other currencies from 2010 to 2024.
In the first few months of 2010, settlements in local currency accounted for less than 1.0% of China’s cross-border payments, compared to approximately 83.0% in USD.
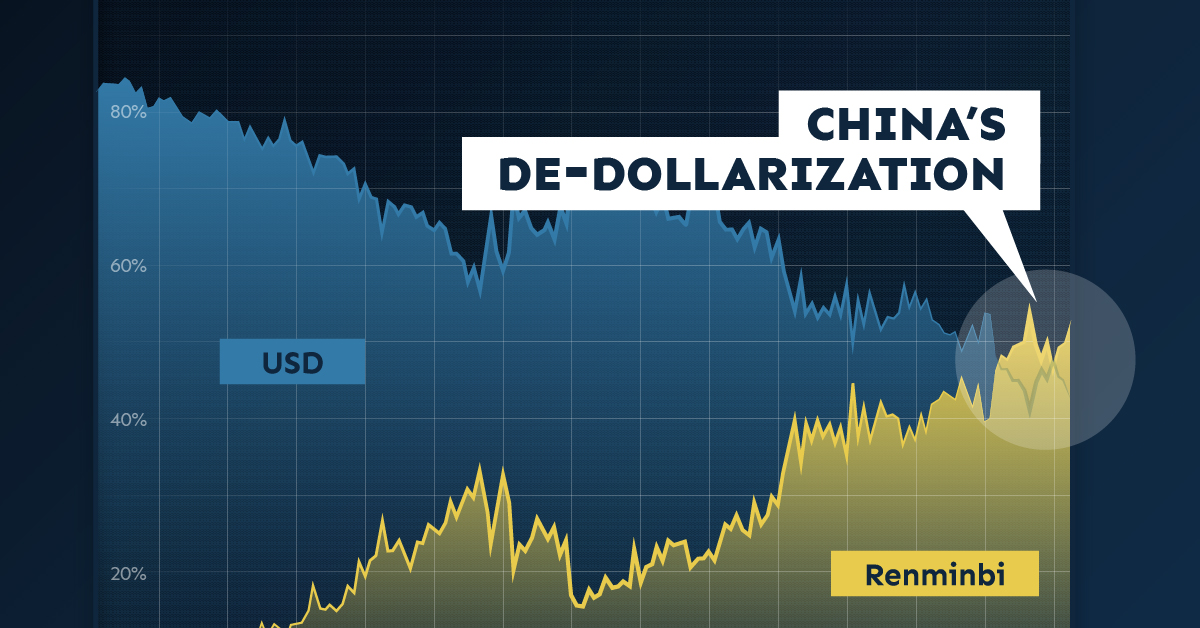
China has since closed that gap. In March 2023, the share of the RMB in China’s settlements surpassed the USD for the first time.
| Date | Renminbi | U.S. Dollar | Other |
|---|---|---|---|
| March 2010 | 0.3% | 84.3% | 15.4% |
| March 2011 | 4.8% | 81.3% | 13.9% |
| March 2012 | 11.5% | 77.1% | 11.5% |
| March 2013 | 18.1% | 72.7% | 9.2% |
| March 2014 | 26.6% | 64.8% | 8.6% |
| March 2015 | 29.0% | 61.9% | 9.0% |
| March 2016 | 23.6% | 66.7% | 9.7% |
| March 2017 | 17.6% | 72.5% | 9.9% |
| March 2018 | 23.2% | 67.4% | 9.4% |
| March 2019 | 26.2% | 65.1% | 8.7% |
| March 2020 | 39.3% | 54.4% | 6.3% |
| March 2021 | 41.7% | 52.6% | 5.6% |
| March 2022 | 42.1% | 53.3% | 4.7% |
| March 2023 | 48.4% | 46.7% | 4.9% |
| March 2024 | 52.9% | 42.8% | 4.3% |
Source: Bloomberg (2024)
Since then, the de-dollarization in Chinese international settlements has continued.
As of March 2024, over half (52.9%) of Chinese payments were settled in RMB while 42.8% were settled in USD. This is double the share from five years previous. According to Goldman Sachs, foreigners’ increased willingness to trade assets denominated in RMB significantly contributed to de-dollarization in favor of China’s currency. Also, early last year, Brazil and Argentina announced that they would begin allowing trade settlements in RMB.
Most Popular Currencies in Foreign Exchange (FX) Transactions
Globally, analysis from the Bank for International Settlements reveals that, in 2022, the USD remained the most-used currency for FX settlements. The euro and the Japanese yen came in second and third, respectively.
| Currency | 2013 | 2022 | Change (pp) |
|---|---|---|---|
| U.S. Dollar | 87.0% | 88.5% | +1.5 |
| Euro | 33.4% | 30.5% | -2.9 |
| Yen | 23.0% | 16.7% | -6.3 |
| Pound Sterling | 11.8% | 12.9% | +1.1 |
| Renminbi | 2.2% | 7.0% | +4.8 |
| Other | 42.6% | 44.4% | +1.8 |
| Total | 200.0% | 200.0% |
Source: BIS Triennial Central Bank Survey (2022). Because two currencies are involved in each transaction, the sum of the percentage shares of individual currencies totals 200% instead of 100%.
The Chinese renminbi, though accounting for a relatively small share of FX transactions, gained the most ground over the last decade. Meanwhile, the euro and the yen saw decreases in use.
The Future of De-Dollarization
If the RMB’s global rise continues, the stranglehold of the USD on international trade could diminish over time.
The impacts of declining dollar dominance are complex and uncertain, but they could range from the underperformance of U.S. financial assets to diminished power of Western sanctions.
However, though the prevalence of RMB in international payments could rise, a complete de-dollarization of the world economy in the near- or medium-term is unlikely. China’s strict capital controls that limit the availability of RMB outside the country, and the nation’s sputtering economic growth, are key reasons contributing to this.
The third piece in this series will explore Russia’s shifting trading patterns following its invasion of Ukraine.
Visit the Hinrich Foundation to learn more about the future of geopolitical trade

-

 China2 weeks ago
Which Countries Have the Most Economic Influence in Southeast Asia?
One country dominates this survey of who has the most economic influence in the region.
-

 Public Opinion2 weeks ago
Charted: How Democrats and Republicans View Government Agencies
Predictably, results diverge when both Democrats and Republicans are asked to rate key government agencies in the United States.
-

 War3 weeks ago
Visualized: Aircraft Carriers by Country
The U.S. controls 40% of global aircraft carrier fleet.
-

 Politics3 weeks ago
Charted: How Americans Feel About Federal Government Agencies
Fourteen of 16 federal government agencies garnered more favorable responses than unfavorable ones. But what were the outliers?
-

 Politics4 weeks ago
Charted: What Southeast Asia Thinks About China & the U.S.
A significant share of respondents from an ASEAN-focused survey are not happy about rising American and Chinese influence in the region.
-

 United States1 month ago
Charted: Trust in Government Institutions by G7 Countries
How much do you trust the government and its various institutions? We look at data for G7 countries for the time period of 2006-2023.


-

 Energy1 week ago
Ranked: The World’s Largest Lithium Producers in 2023
-
Public Opinion2 weeks ago
Charted: How Democrats and Republicans View Government Agencies
-

 Maps2 weeks ago
Mapped: The Top Exports in Asian Countries
-

 Markets2 weeks ago
Ranked: The World’s 50 Largest Private Equity Firms
-

 Maps2 weeks ago
Mapped: The 10 U.S. States With the Lowest Real GDP Growth
-

 China2 weeks ago
Comparing New and Current U.S. Tariffs on Chinese Imports
-
China2 weeks ago
Which Countries Have the Most Economic Influence in Southeast Asia?
-

 Misc2 weeks ago
The Top 25 Nationalities of U.S. Immigrants