United States
Charted: Rising Mass Shootings in America
Article/Editing:
Charted: Rising Mass Shootings in America
The United States of America has a new fatal epidemic on its hands. But it’s not a new virus or disease; it’s the skyrocketing number of mass shootings.
On January 21, 2023, a gunman opened fire on a group celebrating the Lunar New Year in California, killing 10 and injuring 10 others.
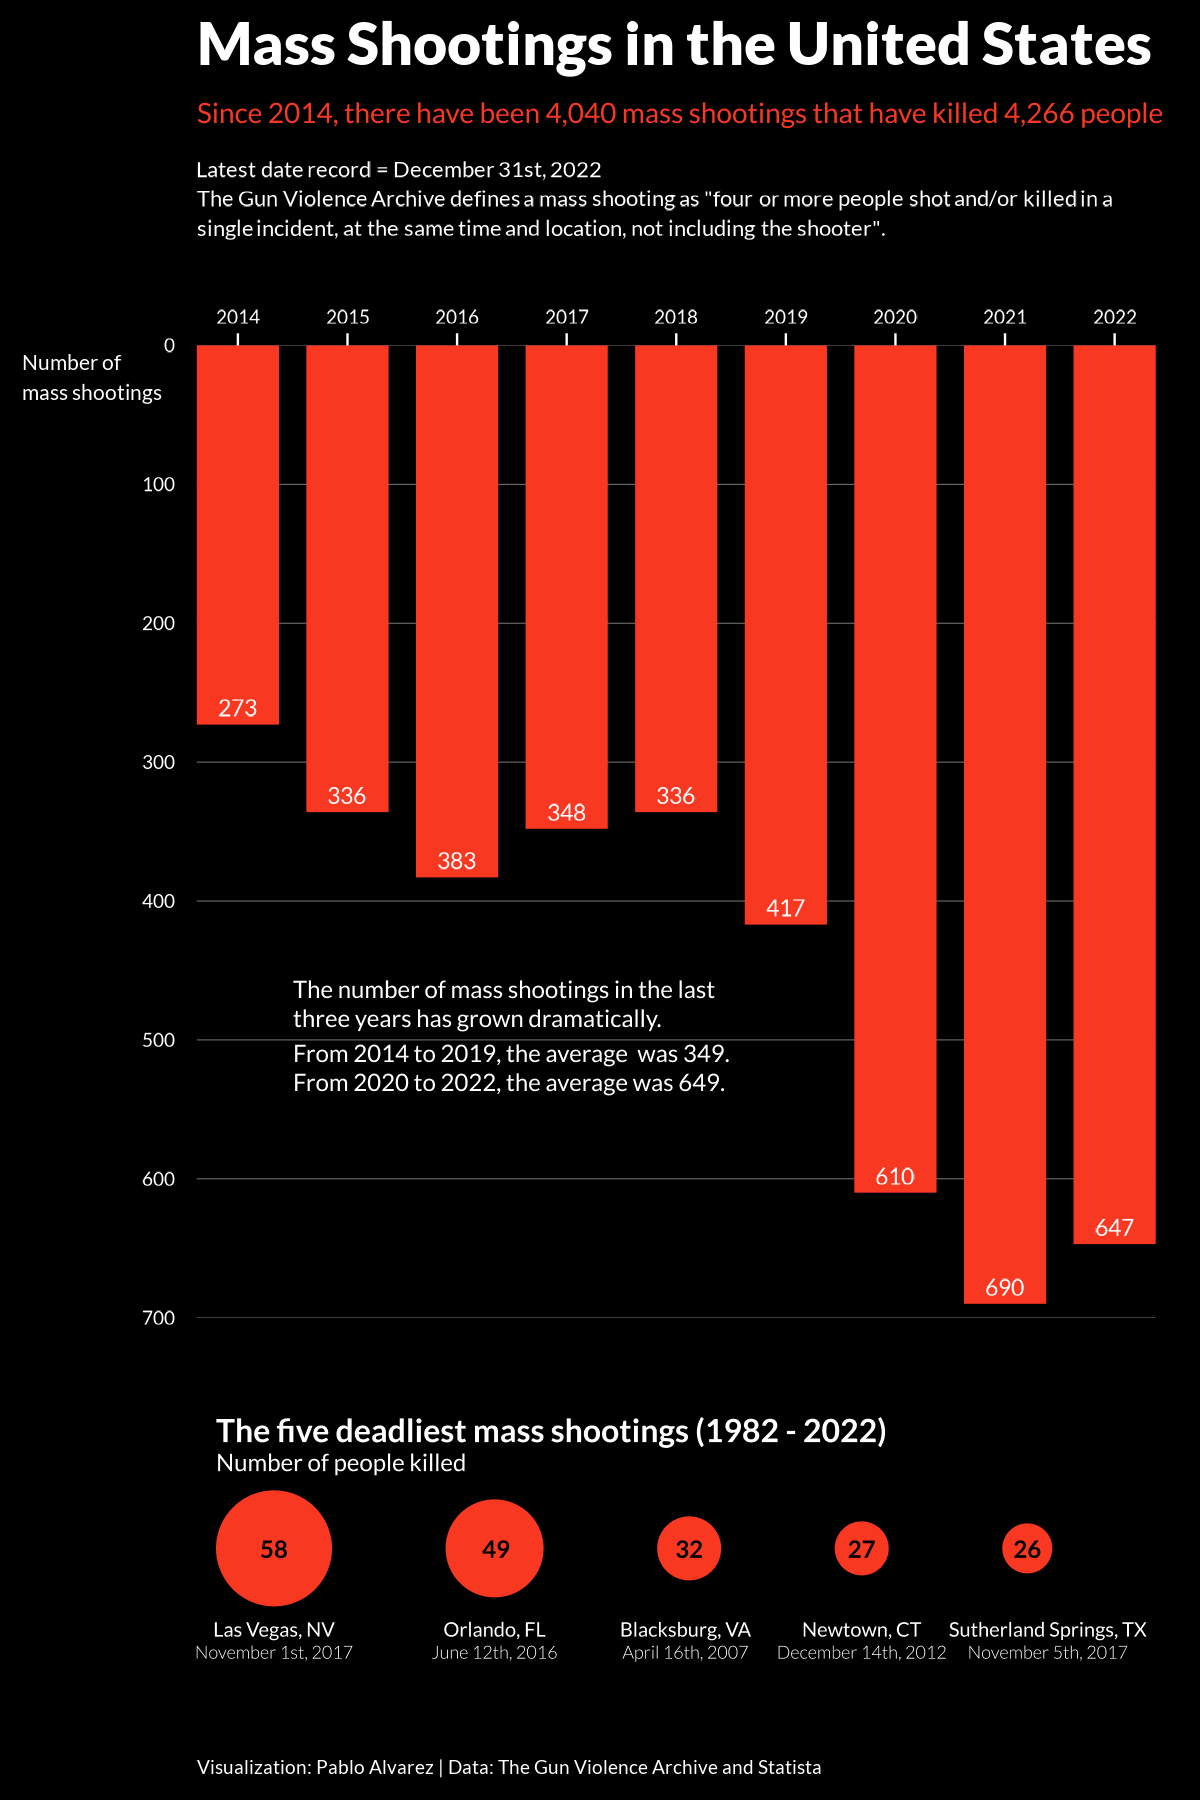
This graphic by Pablo Alvarez used data from the Gun Violence Archive to track the number of mass shootings in the U.S. over the past eight years and highlight the states that have witnessed the worst of it.
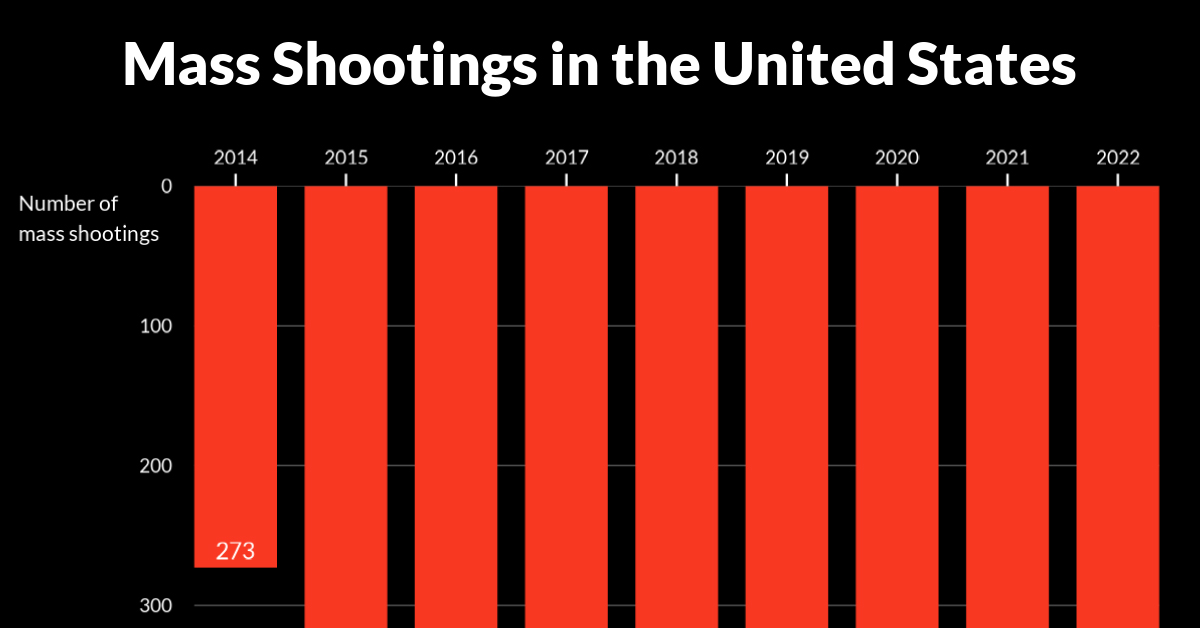
U.S. Mass Shootings From 2014‒2022
While gun violence has been a hot topic in the U.S. for many years, mass shootings are now visibly on the rise. In fact, they have almost doubled post-pandemic.
According to the Gun Violence Archive, mass shootings comprise incidents where four or more people (not including the shooter) are shot at the same time and in the same location.
| Year | Number of Mass Shootings | Killed | Injured |
|---|---|---|---|
| 2022 | 647 | 673 | 2700 |
| 2021 | 690 | 704 | 2827 |
| 2020 | 610 | 513 | 2540 |
| 2019 | 417 | 465 | 1712 |
| 2018 | 336 | 372 | 1330 |
| 2017 | 348 | 441 | 1807 |
| 2016 | 383 | 453 | 1539 |
| 2015 | 336 | 369 | 1337 |
| 2014 | 273 | 275 | 1086 |
Between 2020 and 2022, the U.S. saw 1,947 mass shootings. These tragic incidents killed 1890 people and left over 8,000 others injured.
Las Vegas witnessed the deadliest mass shooting in modern U.S. history on October 1, 2017, when a gunman opened fire on a crowd of 22,000 people attending a country music festival. The incident took 58 lives and injured over 500 people.
A year before this tragedy, 49 people lost their lives in the mass shooting at Orlando’s Pulse nightclub, with more than 50 additional people wounded. In fact, many of the deadliest mass shootings in U.S. history have occurred in the 21st century, and especially over the last 10 years.

This article was published as a part of Visual Capitalist's Creator Program, which features data-driven visuals from some of our favorite Creators around the world.


United States
The Top 25 Nationalities of U.S. Immigrants
Mexico is the largest source of immigrants to the U.S., with almost 11 million immigrants.


The Top 25 Nationalities of U.S. Immigrants
This was originally posted on our Voronoi app. Download the app for free on iOS or Android and discover incredible data-driven charts from a variety of trusted sources.
The United States is home to more than 46 million immigrants, constituting approximately 14% of its total population.
This graphic displays the top 25 countries of origin for U.S. immigrants, based on 2022 estimates. The data is sourced from the Migration Policy Institute (MPI), which analyzed information from the U.S. Census Bureau’s 2022 American Community Survey.
In this context, “immigrants” refer to individuals residing in the United States who were not U.S. citizens at birth.
Mexico Emerges as a Leading Source of Immigration
Mexico stands out as the largest contributor to U.S. immigration due to its geographical proximity and historical ties.
Various economic factors, including wage disparities and employment opportunities, motivate many Mexicans to seek better prospects north of the border.
| Country | Region | # of Immigrants |
|---|---|---|
| 🇲🇽 Mexico | Latin America & Caribbean | 10,678,502 |
| 🇮🇳 India | Asia | 2,839,618 |
| 🇨🇳 China | Asia | 2,217,894 |
| 🇵🇭 Philippines | Asia | 1,982,333 |
| 🇸🇻 El Salvador | Latin America & Caribbean | 1,407,622 |
| 🇻🇳 Vietnam | Asia | 1,331,192 |
| 🇨🇺 Cuba | Latin America & Caribbean | 1,312,510 |
| 🇩🇴 Dominican Republic | Latin America & Caribbean | 1,279,900 |
| 🇬🇹 Guatemala | Latin America & Caribbean | 1,148,543 |
| 🇰🇷 Korea | Asia | 1,045,100 |
| 🇨🇴 Colombia | Latin America & Caribbean | 928,053 |
| 🇭🇳 Honduras | Latin America & Caribbean | 843,774 |
| 🇨🇦 Canada | Northern America | 821,322 |
| 🇯🇲 Jamaica | Latin America & Caribbean | 804,775 |
| 🇭🇹 Haiti | Latin America & Caribbean | 730,780 |
| 🇬🇧 United Kingdom | Europe | 676,652 |
| 🇻🇪 Venezuela | Latin America & Caribbean | 667,664 |
| 🇧🇷 Brazil | Latin America & Caribbean | 618,525 |
| 🇩🇪 Germany | Europe | 537,484 |
| 🇪🇨 Ecuador | Latin America & Caribbean | 518,287 |
| 🇵🇪 Peru | Latin America & Caribbean | 471,988 |
| 🇳🇬 Nigeria | Africa | 448,405 |
| 🇺🇦 Ukraine | Europe | 427,163 |
| 🇮🇷 Iran | Middle East | 407,283 |
| 🇵🇰 Pakistan | Asia | 399,086 |
| Rest of World | 11,637,634 | |
| Total | 46,182,089 |
Mexicans are followed in this ranking by Indians, Chinese, and Filipinos, though most immigrants on this list come from countries in the Latin American and Caribbean region.
On the other hand, only three European countries are among the top sources of U.S. immigrants: the UK, Germany, and Ukraine.
Immigration continues to be a significant factor contributing to the overall growth of the U.S. population. Overall population growth has decelerated over the past decade primarily due to declining birth rates.
Between 2021 and 2022, the increase in the immigrant population accounted for 65% of the total population growth in the U.S., representing 912,000 individuals out of nearly 1.4 million.
If you enjoyed this post, be sure to check out Visualized: Why Do People Immigrate to the U.S.? This visualization shows the different reasons cited by new arrivals to America in 2021.

-
 Maps1 week ago
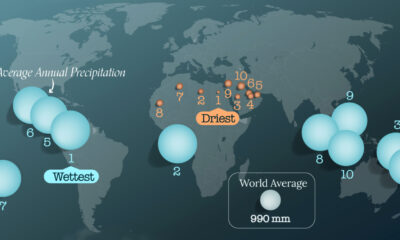
Mapped: The World’s Wettest and Driest Countries
-

 Public Opinion2 weeks ago
Charted: How Democrats and Republicans View Government Agencies
-

 Maps2 weeks ago
Mapped: The Top Exports in Asian Countries
-

 Finance2 weeks ago
Ranked: The World’s 50 Largest Private Equity Firms
-

 Markets2 weeks ago
Mapped: The 10 U.S. States With the Lowest Real GDP Growth
-

 United States2 weeks ago
Comparing New and Current U.S. Tariffs on Chinese Imports
-

 China2 weeks ago
Which Countries Have the Most Economic Influence in Southeast Asia?
-

 United States2 weeks ago
The Top 25 Nationalities of U.S. Immigrants