Politics
Timeline: Cannabis Legislation in the U.S.
Timeline: Cannabis Legislation in the U.S.
At the federal level, cannabis is still considered an illegal substance. That said, individual states do have the right to determine their own laws around cannabis sales and usage.
This visual from New Frontier Data looks at the status of cannabis in every state and the timeline of when medical and/or recreational use became legal.
Cannabis Through the Years
In the U.S., the oldest legalese concerning cannabis dates back to the 1600s—the colony of Virginia required every farm to grow and produce hemp. Since then, cannabis use was fairly wide open until the 1930s when the Marihuana Tax Act was enforced, prohibiting marijuana federally but still technically allowing medical use.
Jumping ahead, the Controlled Substances Act was passed in 1970, classifying cannabis as Schedule I drug—the same category as heroin. This prohibited any use of the substance.
However, the 1970s also saw a counter movement, wherein many states made the move towards decriminalization. Decriminalization means that although possessing cannabis remained illegal, a person would not be subject to jail time or prosecution for possessing certain amounts.
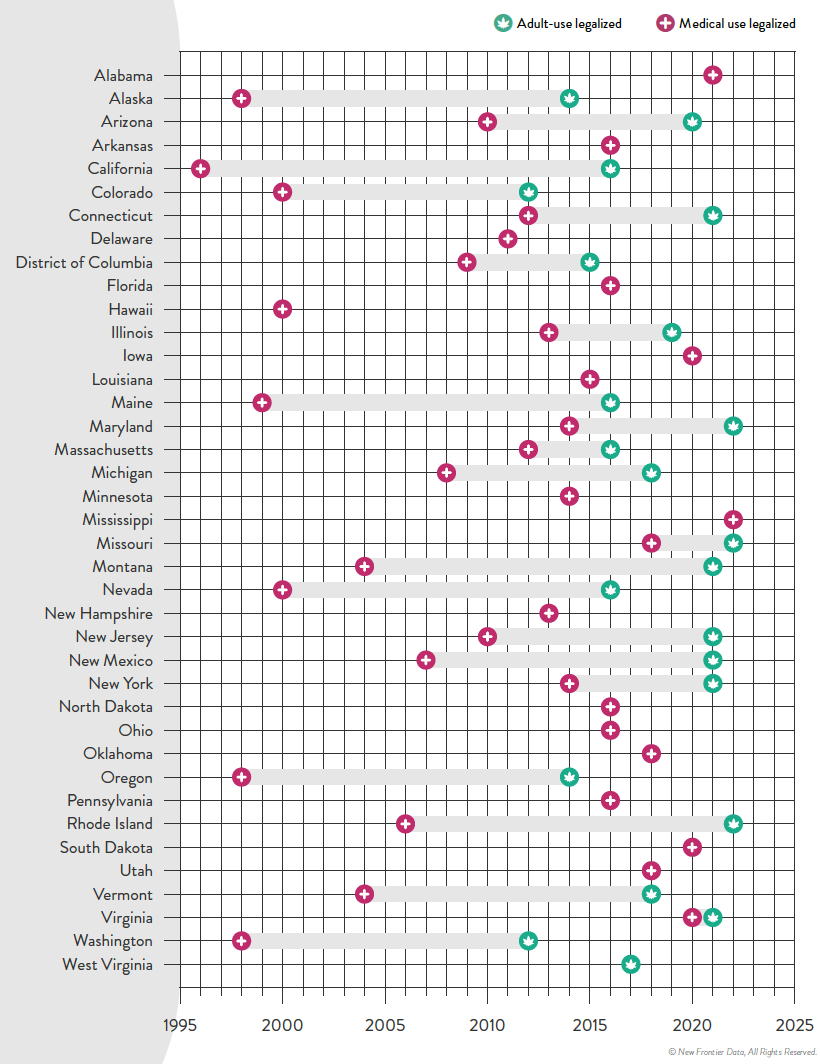
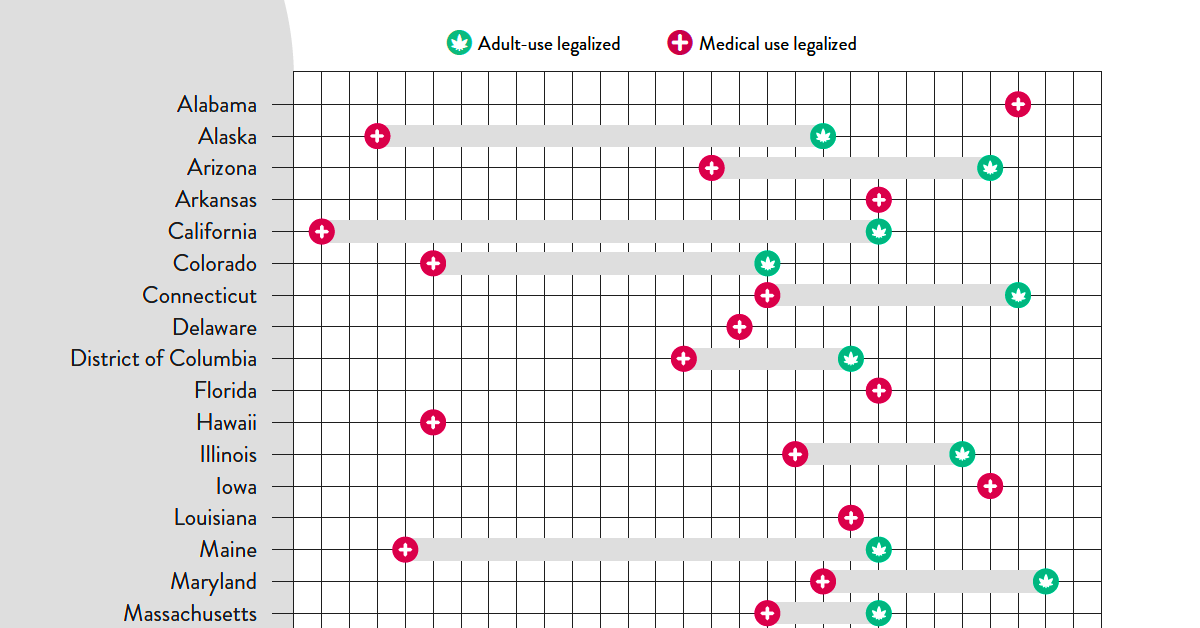
By the 1990s, some of the first states passed laws to allow the medical usage of cannabis, and by 2012 two states in the U.S.—Washington and Colorado—legalized the recreational use of cannabis.
Cannabis Legislation Today and Beyond
The MORE Act (the Marijuana Opportunity Reinvestment and Expungement Act) was passed in the House early 2022, and if made law, it would decriminalize marijuana federally.
“This bill decriminalizes marijuana. Specifically, it removes marijuana from the list of scheduled substances under the Controlled Substances Act and eliminates criminal penalties for an individual who manufactures, distributes, or possesses marijuana.”– U.S. Congress
Cannabis still remains illegal at the federal level, but at the state levels, cannabis is now fully legal (both for medicinal and recreational purposes) in a total of 22 states.
Over 246 million Americans have legal access to some form of marijuana products with high THC levels. Looking to the future, many new cannabis markets are expected to open up in the next few years:
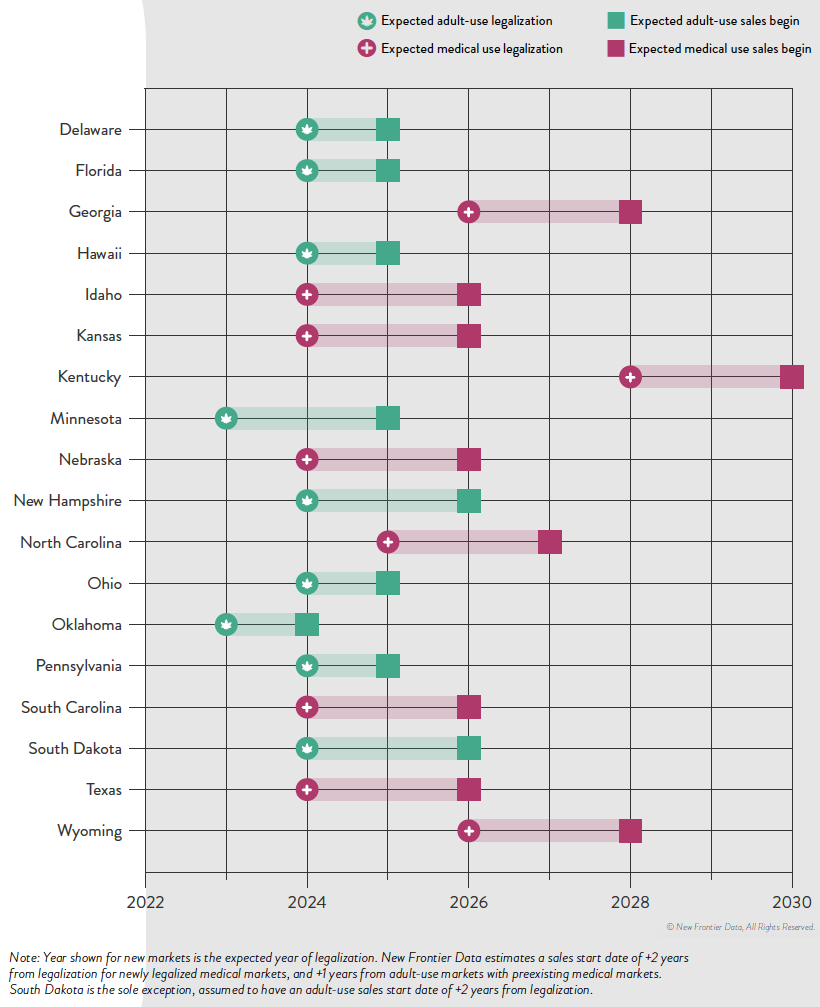
The earliest states expected to open up next for recreational cannabis sales are Minnesota and Oklahoma. There is always a lag between legalization and actual sales, wherein local regulatory bodies and governments set standards. States like Kentucky, on the other hand, aren’t likely to even legalize medicinal cannabis until 2028.
It’s estimated that by 2030, there will be 69 million cannabis consumers in the country, up 33% from 2022.
Overall, the U.S. cannabis market is likely an important one to watch as legal sales hit $30 billion in 2022. By the end of the decade, that number is expected to be anywhere from $58 billion to as much as $72 billion.


Politics
The Start of De-Dollarization: China’s Gradual Move Away from the USD
The de-dollarization of China’s trade settlements has begun. What patterns do we see in USD and RMB use within China and globally?


The Start of De-Dollarization: China’s Move Away from the USD
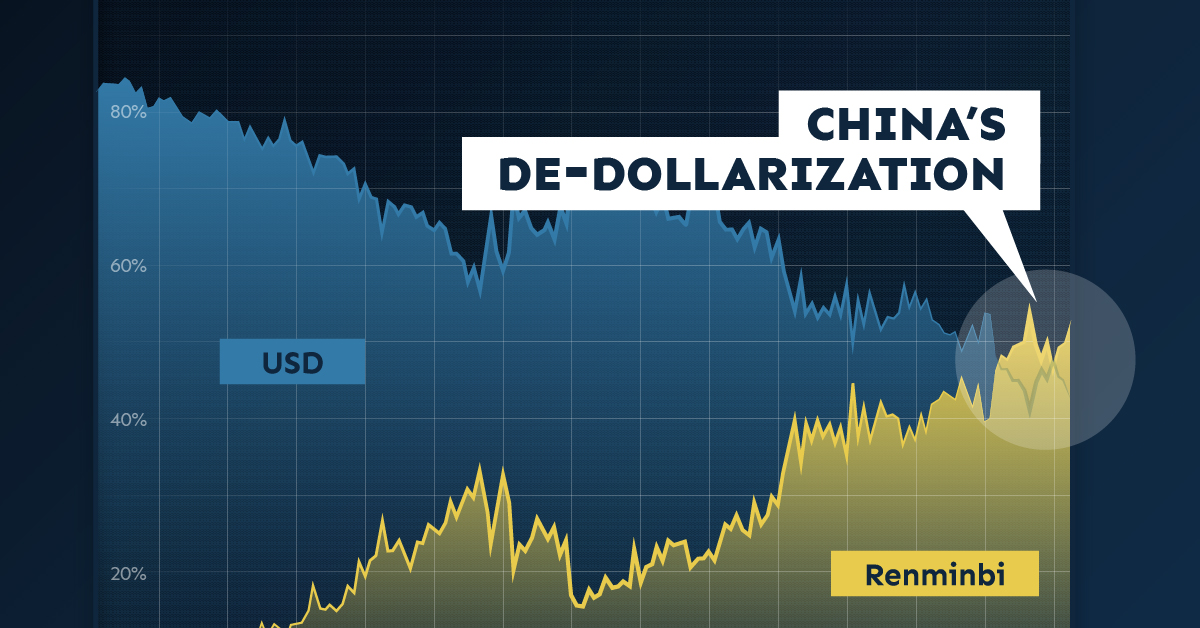
Since 2010, the majority of China’s cross-border payments, like those of many countries, have been settled in U.S. dollars (USD). As of the first quarter of 2023, that’s no longer the case.
This graphic from the Hinrich Foundation, the second in a three-part series covering the future of trade, provides visual context to the growing use of the Chinese renminbi (RMB) in payments both domestically and globally.
The De-Dollarization of China’s Cross-Border Transactions
This analysis uses Bloomberg data on the share of China’s payments and receipts in RMB, USD, and other currencies from 2010 to 2024.
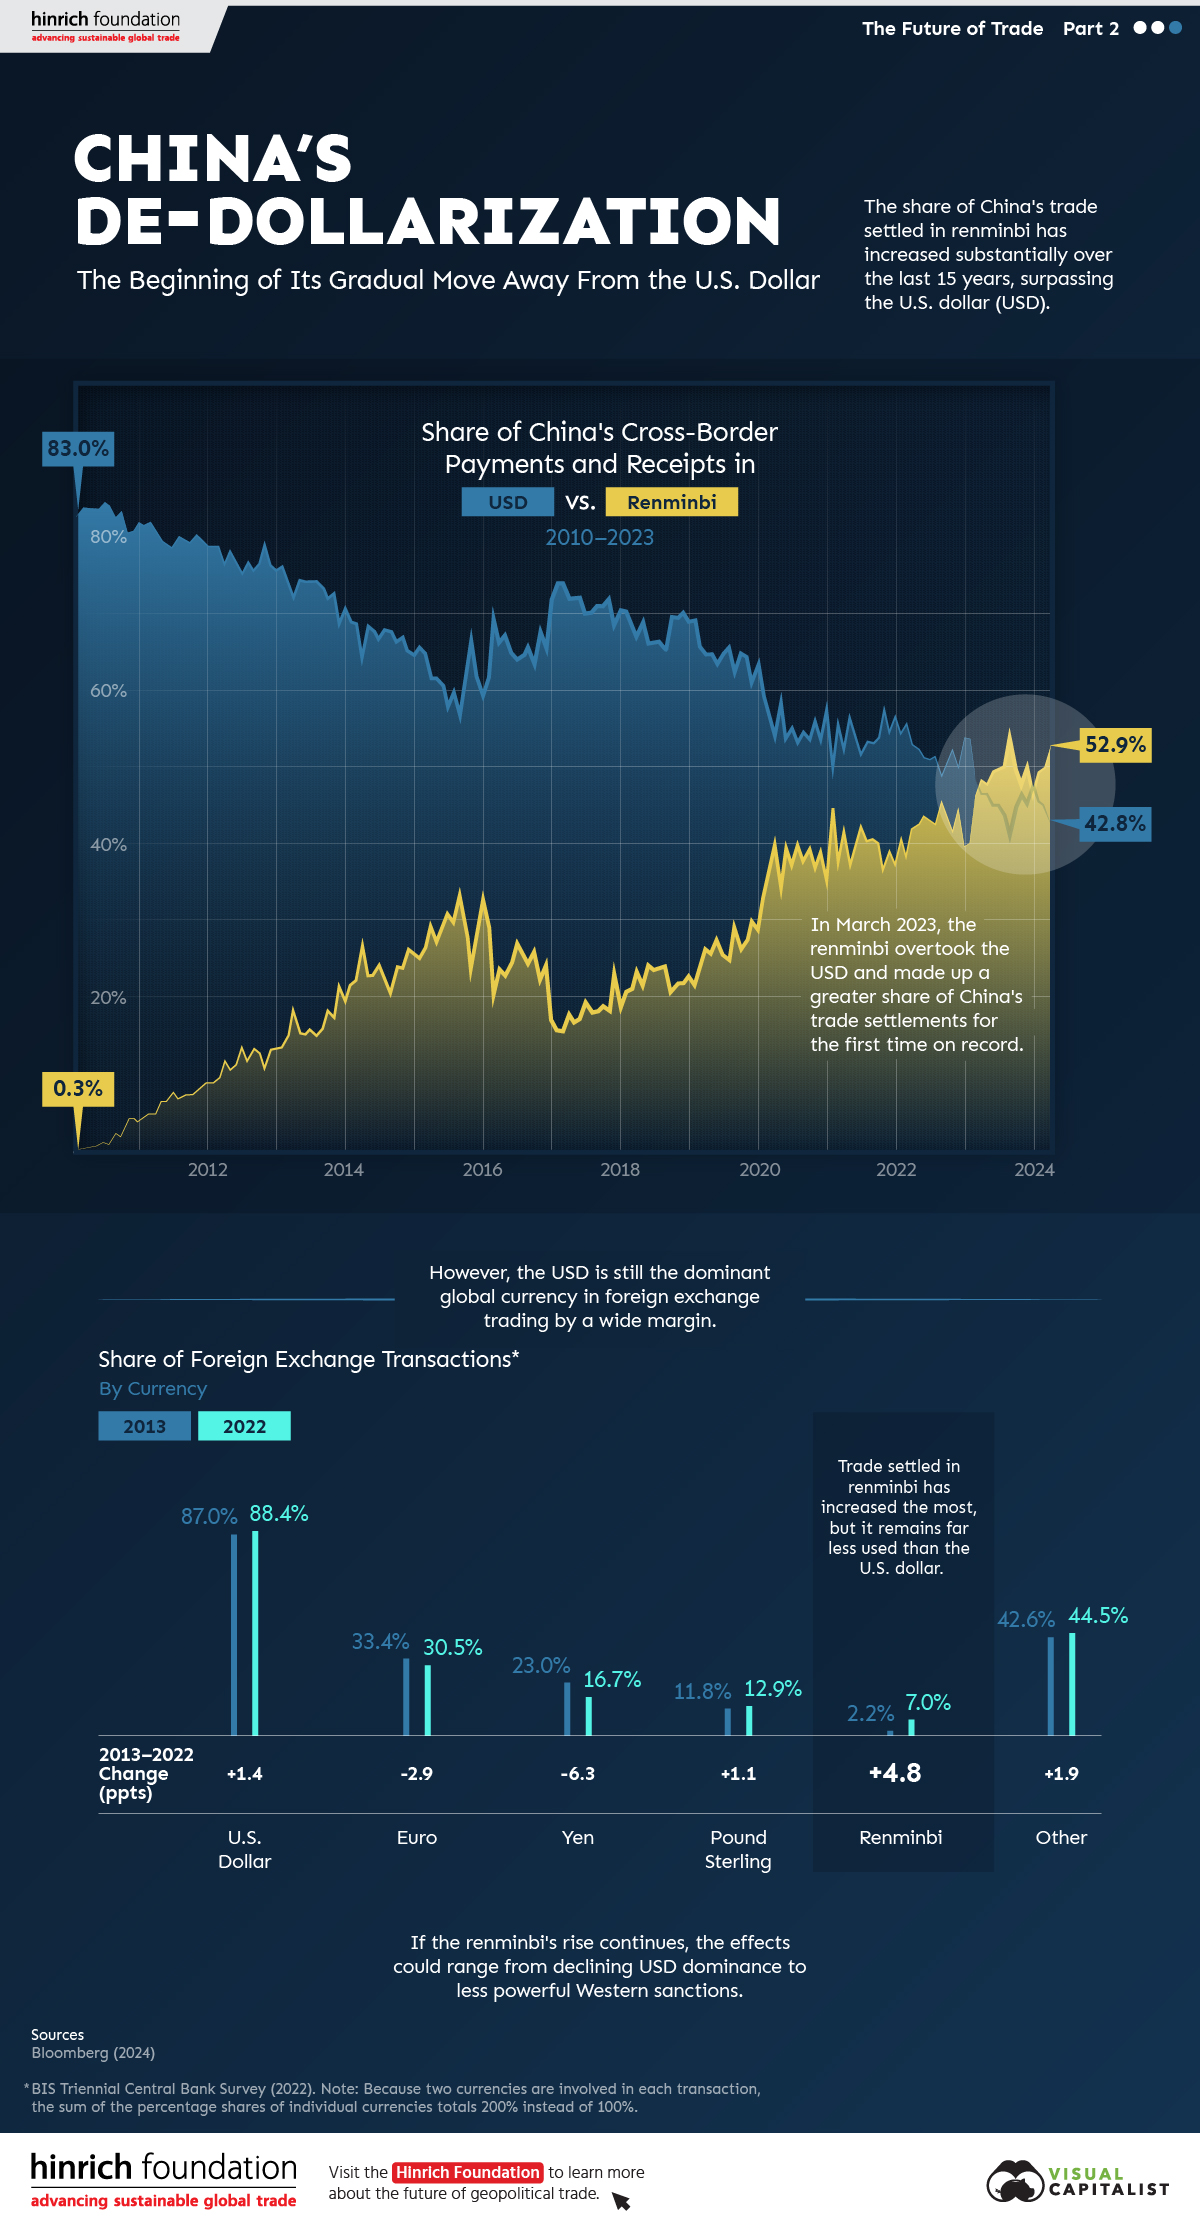
In the first few months of 2010, settlements in local currency accounted for less than 1.0% of China’s cross-border payments, compared to approximately 83.0% in USD.
China has since closed that gap. In March 2023, the share of the RMB in China’s settlements surpassed the USD for the first time.
| Date | Renminbi | U.S. Dollar | Other |
|---|---|---|---|
| March 2010 | 0.3% | 84.3% | 15.4% |
| March 2011 | 4.8% | 81.3% | 13.9% |
| March 2012 | 11.5% | 77.1% | 11.5% |
| March 2013 | 18.1% | 72.7% | 9.2% |
| March 2014 | 26.6% | 64.8% | 8.6% |
| March 2015 | 29.0% | 61.9% | 9.0% |
| March 2016 | 23.6% | 66.7% | 9.7% |
| March 2017 | 17.6% | 72.5% | 9.9% |
| March 2018 | 23.2% | 67.4% | 9.4% |
| March 2019 | 26.2% | 65.1% | 8.7% |
| March 2020 | 39.3% | 54.4% | 6.3% |
| March 2021 | 41.7% | 52.6% | 5.6% |
| March 2022 | 42.1% | 53.3% | 4.7% |
| March 2023 | 48.4% | 46.7% | 4.9% |
| March 2024 | 52.9% | 42.8% | 4.3% |
Source: Bloomberg (2024)
Since then, the de-dollarization in Chinese international settlements has continued.
As of March 2024, over half (52.9%) of Chinese payments were settled in RMB while 42.8% were settled in USD. This is double the share from five years previous. According to Goldman Sachs, foreigners’ increased willingness to trade assets denominated in RMB significantly contributed to de-dollarization in favor of China’s currency. Also, early last year, Brazil and Argentina announced that they would begin allowing trade settlements in RMB.
Most Popular Currencies in Foreign Exchange (FX) Transactions
Globally, analysis from the Bank for International Settlements reveals that, in 2022, the USD remained the most-used currency for FX settlements. The euro and the Japanese yen came in second and third, respectively.
| Currency | 2013 | 2022 | Change (pp) |
|---|---|---|---|
| U.S. Dollar | 87.0% | 88.5% | +1.5 |
| Euro | 33.4% | 30.5% | -2.9 |
| Yen | 23.0% | 16.7% | -6.3 |
| Pound Sterling | 11.8% | 12.9% | +1.1 |
| Renminbi | 2.2% | 7.0% | +4.8 |
| Other | 42.6% | 44.4% | +1.8 |
| Total | 200.0% | 200.0% |
Source: BIS Triennial Central Bank Survey (2022). Because two currencies are involved in each transaction, the sum of the percentage shares of individual currencies totals 200% instead of 100%.
The Chinese renminbi, though accounting for a relatively small share of FX transactions, gained the most ground over the last decade. Meanwhile, the euro and the yen saw decreases in use.
The Future of De-Dollarization
If the RMB’s global rise continues, the stranglehold of the USD on international trade could diminish over time.
The impacts of declining dollar dominance are complex and uncertain, but they could range from the underperformance of U.S. financial assets to diminished power of Western sanctions.
However, though the prevalence of RMB in international payments could rise, a complete de-dollarization of the world economy in the near- or medium-term is unlikely. China’s strict capital controls that limit the availability of RMB outside the country, and the nation’s sputtering economic growth, are key reasons contributing to this.
The third piece in this series will explore Russia’s shifting trading patterns following its invasion of Ukraine.
Visit the Hinrich Foundation to learn more about the future of geopolitical trade

-

 Politics2 weeks ago
Which Countries Have the Most Economic Influence in Southeast Asia?
One country dominates this survey of who has the most economic influence in the region.
-

 Politics2 weeks ago
Charted: How Democrats and Republicans View Government Agencies
Predictably, results diverge when both Democrats and Republicans are asked to rate key government agencies in the United States.
-

 Misc3 weeks ago
Visualized: Aircraft Carriers by Country
The U.S. controls 40% of global aircraft carrier fleet.
-

 Politics3 weeks ago
Charted: How Americans Feel About Federal Government Agencies
Fourteen of 16 federal government agencies garnered more favorable responses than unfavorable ones. But what were the outliers?
-

 Politics4 weeks ago
Charted: What Southeast Asia Thinks About China & the U.S.
A significant share of respondents from an ASEAN-focused survey are not happy about rising American and Chinese influence in the region.
-

 Politics1 month ago
Charted: Trust in Government Institutions by G7 Countries
How much do you trust the government and its various institutions? We look at data for G7 countries for the time period of 2006-2023.

-

 Energy1 week ago
Ranked: The World’s Largest Lithium Producers in 2023
-
Politics2 weeks ago
Charted: How Democrats and Republicans View Government Agencies
-

 Maps2 weeks ago
Mapped: The Top Exports in Asian Countries
-

 Markets2 weeks ago
Ranked: The World’s 50 Largest Private Equity Firms
-

 Maps2 weeks ago
Mapped: The 10 U.S. States With the Lowest Real GDP Growth
-

 China2 weeks ago
Comparing New and Current U.S. Tariffs on Chinese Imports
-
Politics2 weeks ago
Which Countries Have the Most Economic Influence in Southeast Asia?
-

 Misc2 weeks ago
The Top 25 Nationalities of U.S. Immigrants