Energy
What Electricity Sources Power the World?
![]() Subscribe to the Elements free mailing list for more like this
Subscribe to the Elements free mailing list for more like this
 Can I share this graphic?
 When do I need a license?
 Interested in this piece?
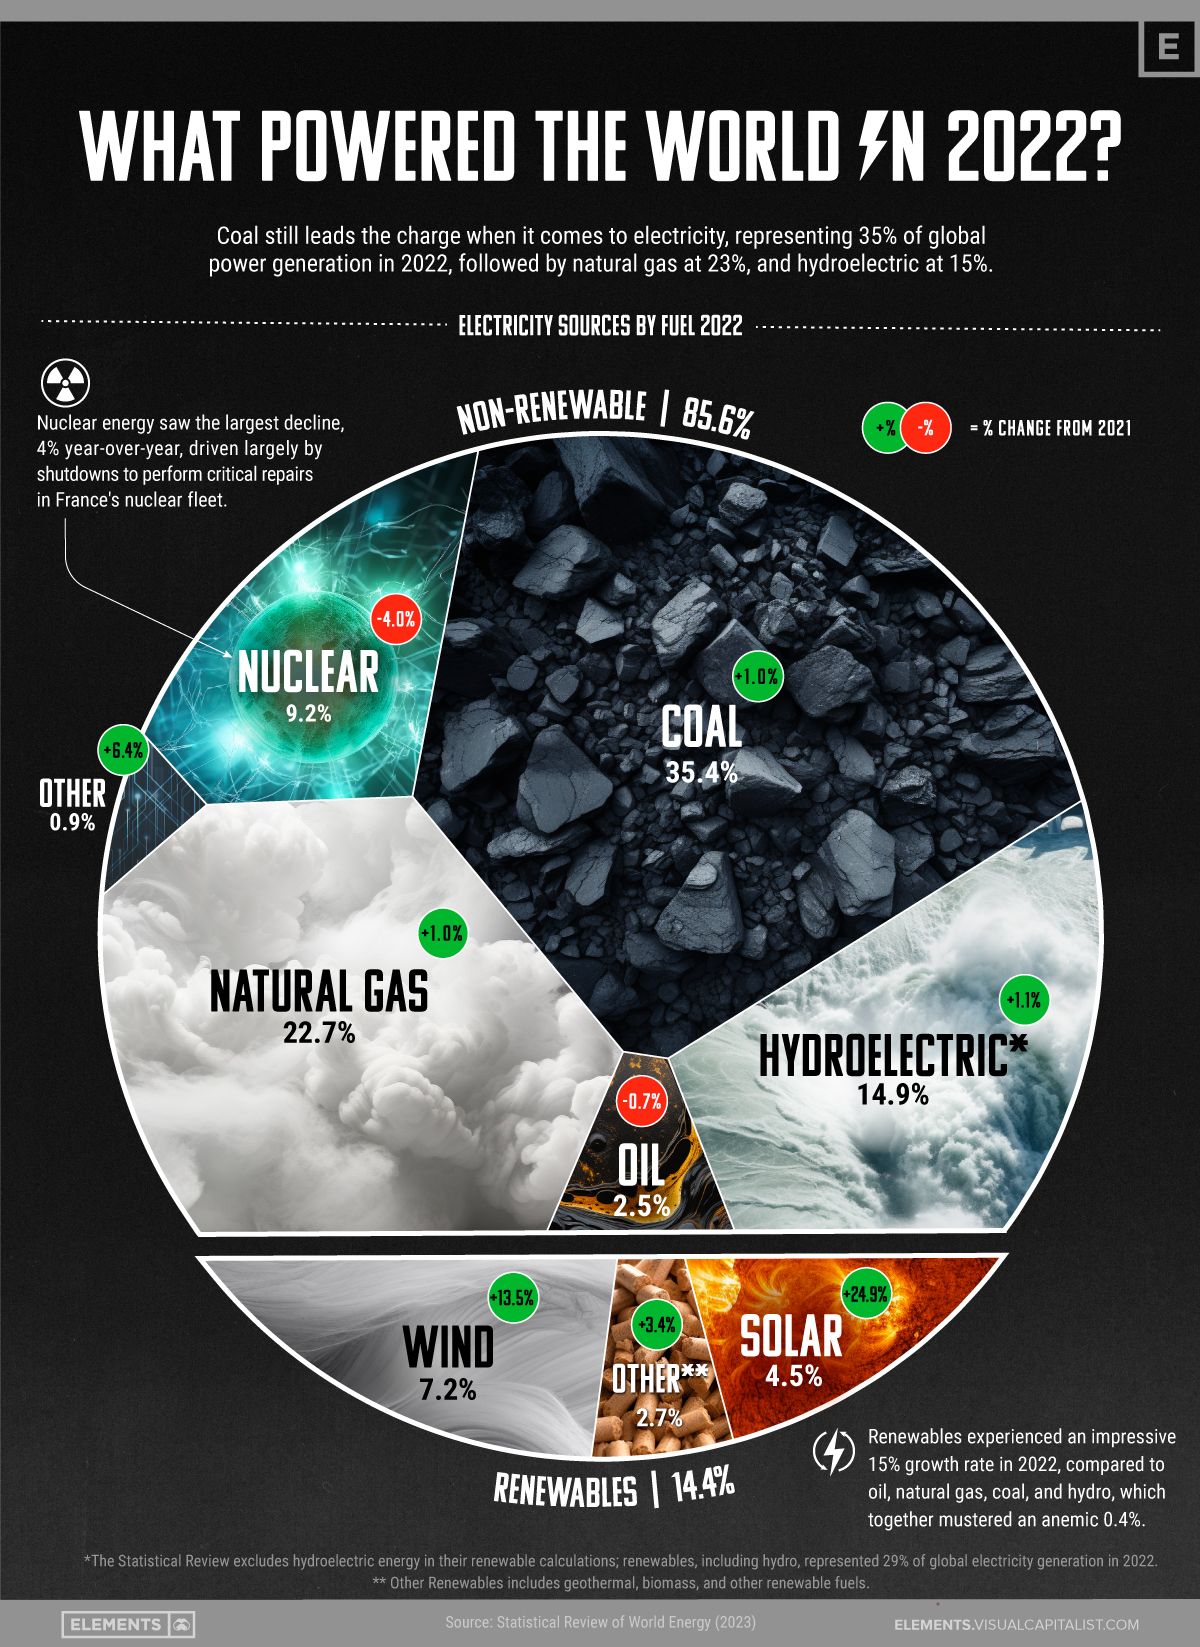
What Powered the World in 2022?
This was originally posted on Elements. Sign up to the free mailing list to get beautiful visualizations on real assets and resource megatrends each week.
In 2022, 29,165.2 terawatt hours (TWh) of electricity was generated around the world, an increase of 2.3% from the previous year.
In this visualization, we look at data from the latest Statistical Review of World Energy, and ask what powered the world in 2022.
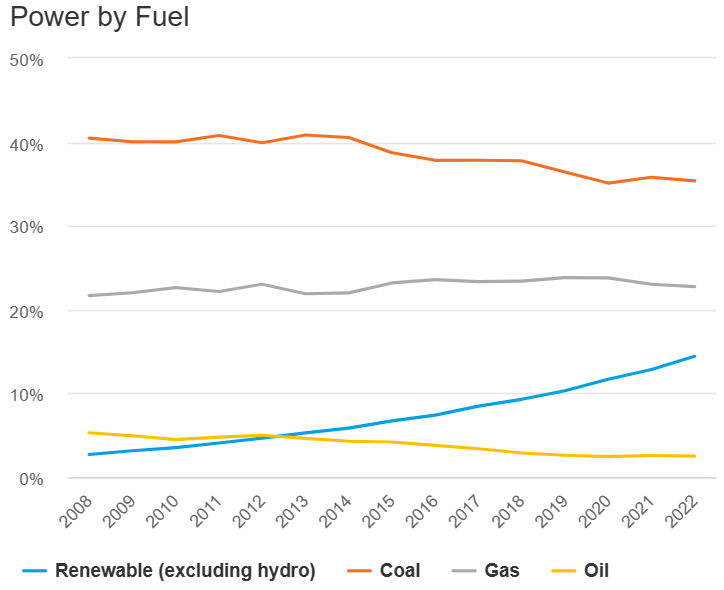
Coal is Still King
Coal still leads the charge when it comes to electricity, representing 35.4% of global power generation in 2022, followed by natural gas at 22.7%, and hydroelectric at 14.9%.
Source: Energy Institute
Over three-quarters of the world’s total coal-generated electricity is consumed in just three countries. China is the top user of coal, making up 53.3% of global coal demand, followed by India at 13.6%, and the U.S. at 8.9%.
Burning coal—for electricity, as well as metallurgy and cement production—is the world’s single largest source of CO2 emissions. Nevertheless, its use in electricity generation has actually grown 91.2% since 1997, the year when the first global climate agreement was signed in Kyoto, Japan.
Renewables on the Rise
However, even as non-renewables enjoy their time in the sun, their days could be numbered.
In 2022, renewables, such as wind, solar, and geothermal, represented 14.4% of total electricity generation with an extraordinary annual growth rate of 14.7%, driven by big gains in solar and wind. Non-renewables, by contrast, only managed an anemic 0.4%.
The authors of the Statistical Review do not include hydroelectric in their renewable calculations, even though many others, including the International Energy Agency, consider it a “well-established renewable power technology.”
With hydroelectric moved into the renewable column, together they accounted for over 29.3% of all electricity generated in 2022, with an annual growth rate of 7.4%.
France’s Nuclear Horrible Year
Another big mover in this year’s report was nuclear energy.
In addition to disruptions at the Zaporizhzhia nuclear power plant in Ukraine, shutdowns in France’s nuclear fleet to address corrosion found in the safety injection systems of four reactors led to a 4% drop in global use, year-over-year.
The amount of electricity generated by nuclear energy in that country dropped 22% to 294.7 TWh in 2022. As a result, France went from being the world’s biggest exporter of electricity, to a net importer.
Powering the Future
Turning mechanical energy into electrical energy is a relatively straightforward process. Modern power plants are engineering marvels, to be sure, but they still work on the same principle as the very first generator invented by Michael Faraday in 1831.
But how you get the mechanical energy is where things get complicated: coal powered the first industrial revolution, but heated the planet in the process; wind is free and clean, but is unreliable; and nuclear fission reliably generates emission-free electricity, but also creates radioactive waste.
With temperature records being set around the world in the summer, resolving these tensions isn’t just academic and next year’s report could be a crucial test of the world’s commitment to a clean energy future.


Energy
Comparing Saudi Aramco’s $1.9T Valuation to Its Rivals
See how much larger Saudi Aramco’s market cap is compared to rivals like Chevron, ExxonMobil, and Shell.
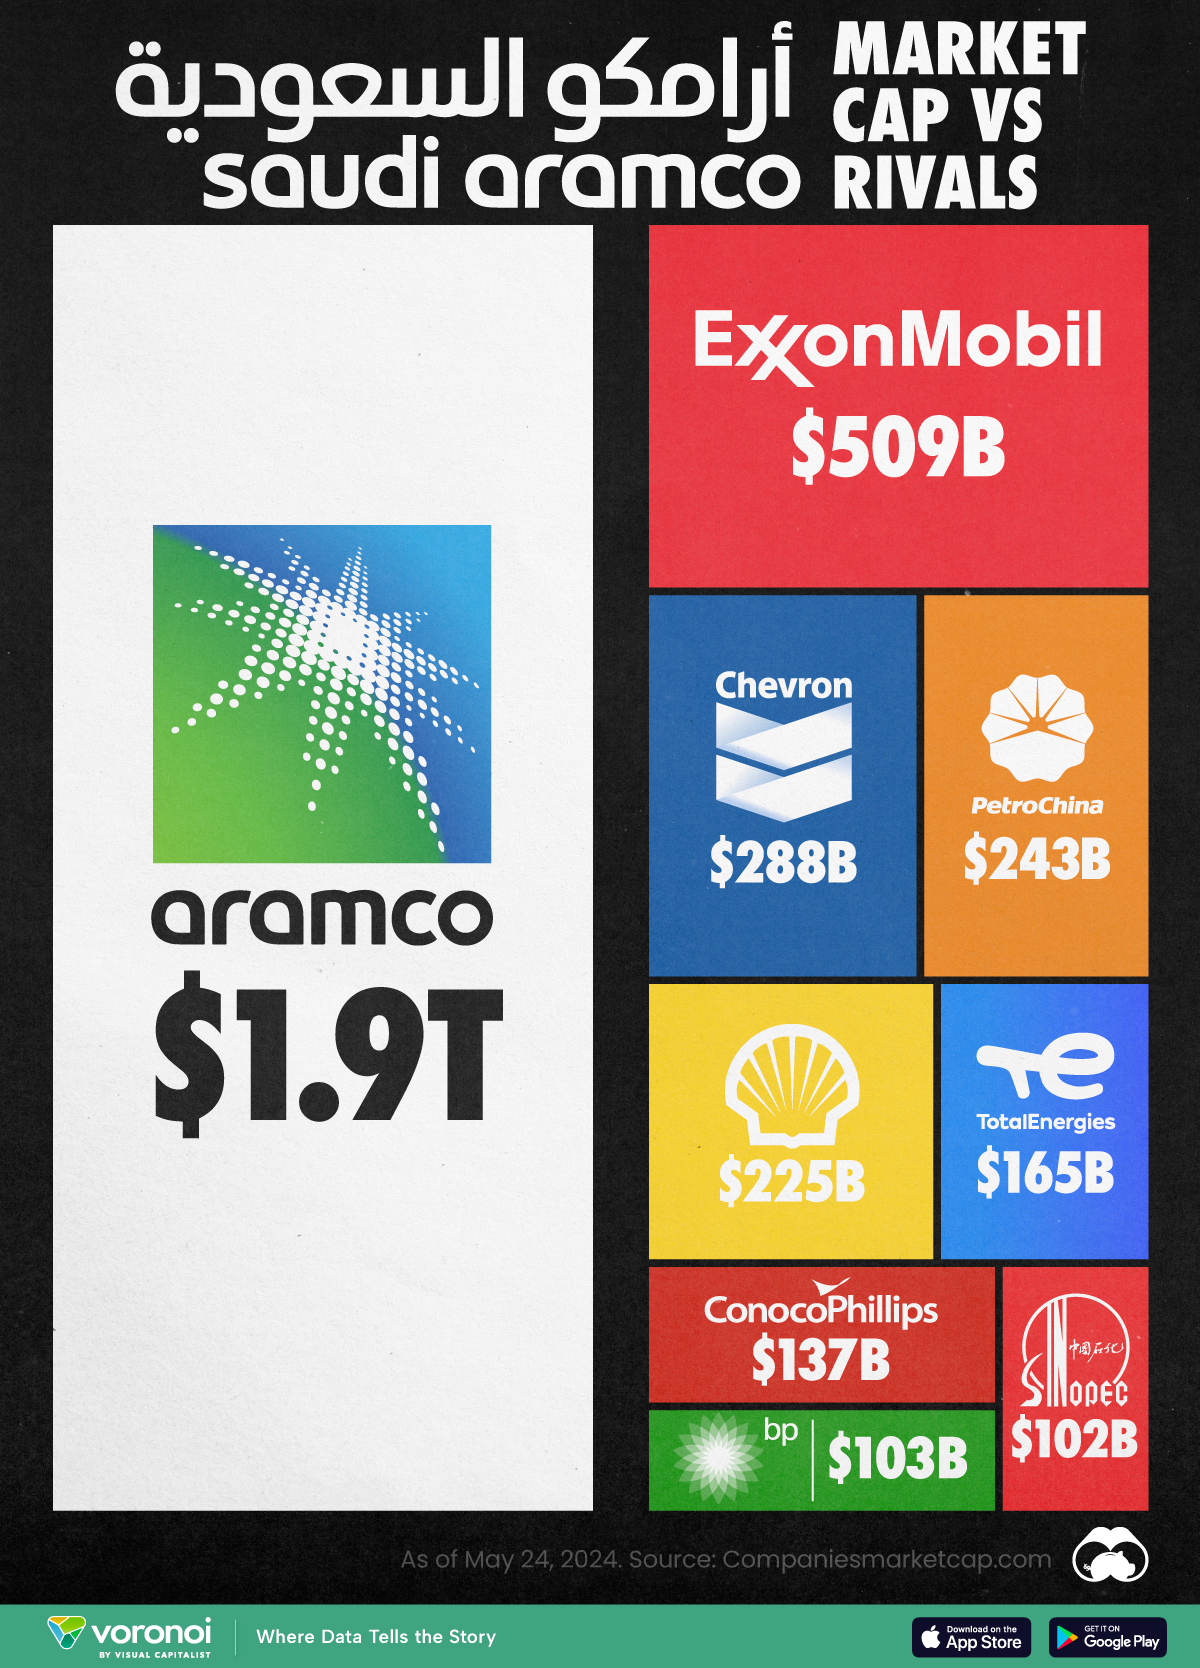

Putting Saudi Aramco’s Market Cap Into Perspective
This was originally posted on our Voronoi app. Download the app for free on iOS or Android and discover incredible data-driven charts from a variety of trusted sources.
As of May 2024, there are just six trillion-dollar companies in the world, and only one of them is an oil company.
In this graphic, we put Saudi Aramco’s market cap into perspective by comparing it to the rest of the world’s largest oil companies. Numbers were sourced from Companiesmarketcap.com, and are as of May 24, 2024.
Data and Takeaways
The data we used to create this graphic are listed in the table below.
| Company | Market Cap (as of May 24, 2024) |
|---|---|
| 🇸🇦 Saudi Aramco | $1,914B |
| 🇺🇸 Exxon Mobil | $509B |
| 🇺🇸 Chevron | $288B |
| 🇨🇳 Petro China | $243B |
| 🇳🇱 Shell | $225B |
| 🇫🇷 TotalEnergies | $165B |
| 🇺🇸 ConocoPhillips | $137B |
| 🇬🇧 BP | $103B |
| 🇨🇳 Sinopec | $102B |
Saudi Aramco launched its initial public offering (IPO) on December 11, 2019. It remains the largest IPO in history, raising $25.6 billion and valuing the company at $1.7 trillion. Aramco is also the only trillion-dollar company that isn’t based in the United States.
As of 2022, Aramco had proven reserves equal to 259 billion barrels of oil equivalent, which is massively greater than rivals like ExxonMobil (17.7 billion) and Chevron (11.2 billion).
$1.9T*
It should be noted that the Saudi government directly owns 90% of the company, while another 8% is held by the country’s sovereign wealth fund. With only 2% of shares available to the public, some believe that the company’s current valuation carries little weight.
For example, a Bloomberg op-ed from 2023 described Aramco’s valuation as an “illusion” due to its very low trading volume. Over a one year period, Aramco’s average daily turnover was just $51 million, compared to $1.9 billion for ExxonMobil and $1.4 billion for Chevron.
See More Market Cap Comparisons from Visual Capitalist
If you enjoyed this graphic, be sure to check out our similar graphic covering Nvidia.

-
 Maps1 week ago
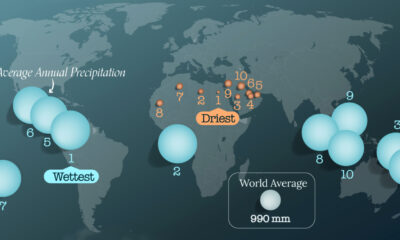
Mapped: The World’s Wettest and Driest Countries
-

 Public Opinion2 weeks ago
Charted: How Democrats and Republicans View Government Agencies
-

 Globalization2 weeks ago
Mapped: The Top Exports in Asian Countries
-

 Finance2 weeks ago
Ranked: The World’s 50 Largest Private Equity Firms
-

 United States2 weeks ago
Mapped: The 10 U.S. States With the Lowest Real GDP Growth
-

 China2 weeks ago
Comparing New and Current U.S. Tariffs on Chinese Imports
-

 Politics2 weeks ago
Which Countries Have the Most Economic Influence in Southeast Asia?
-

 population2 weeks ago
The Top 25 Nationalities of U.S. Immigrants