Energy
Mapped: The Top Middle East Exports by Country


Mapped: The Top Middle East Exports by Country
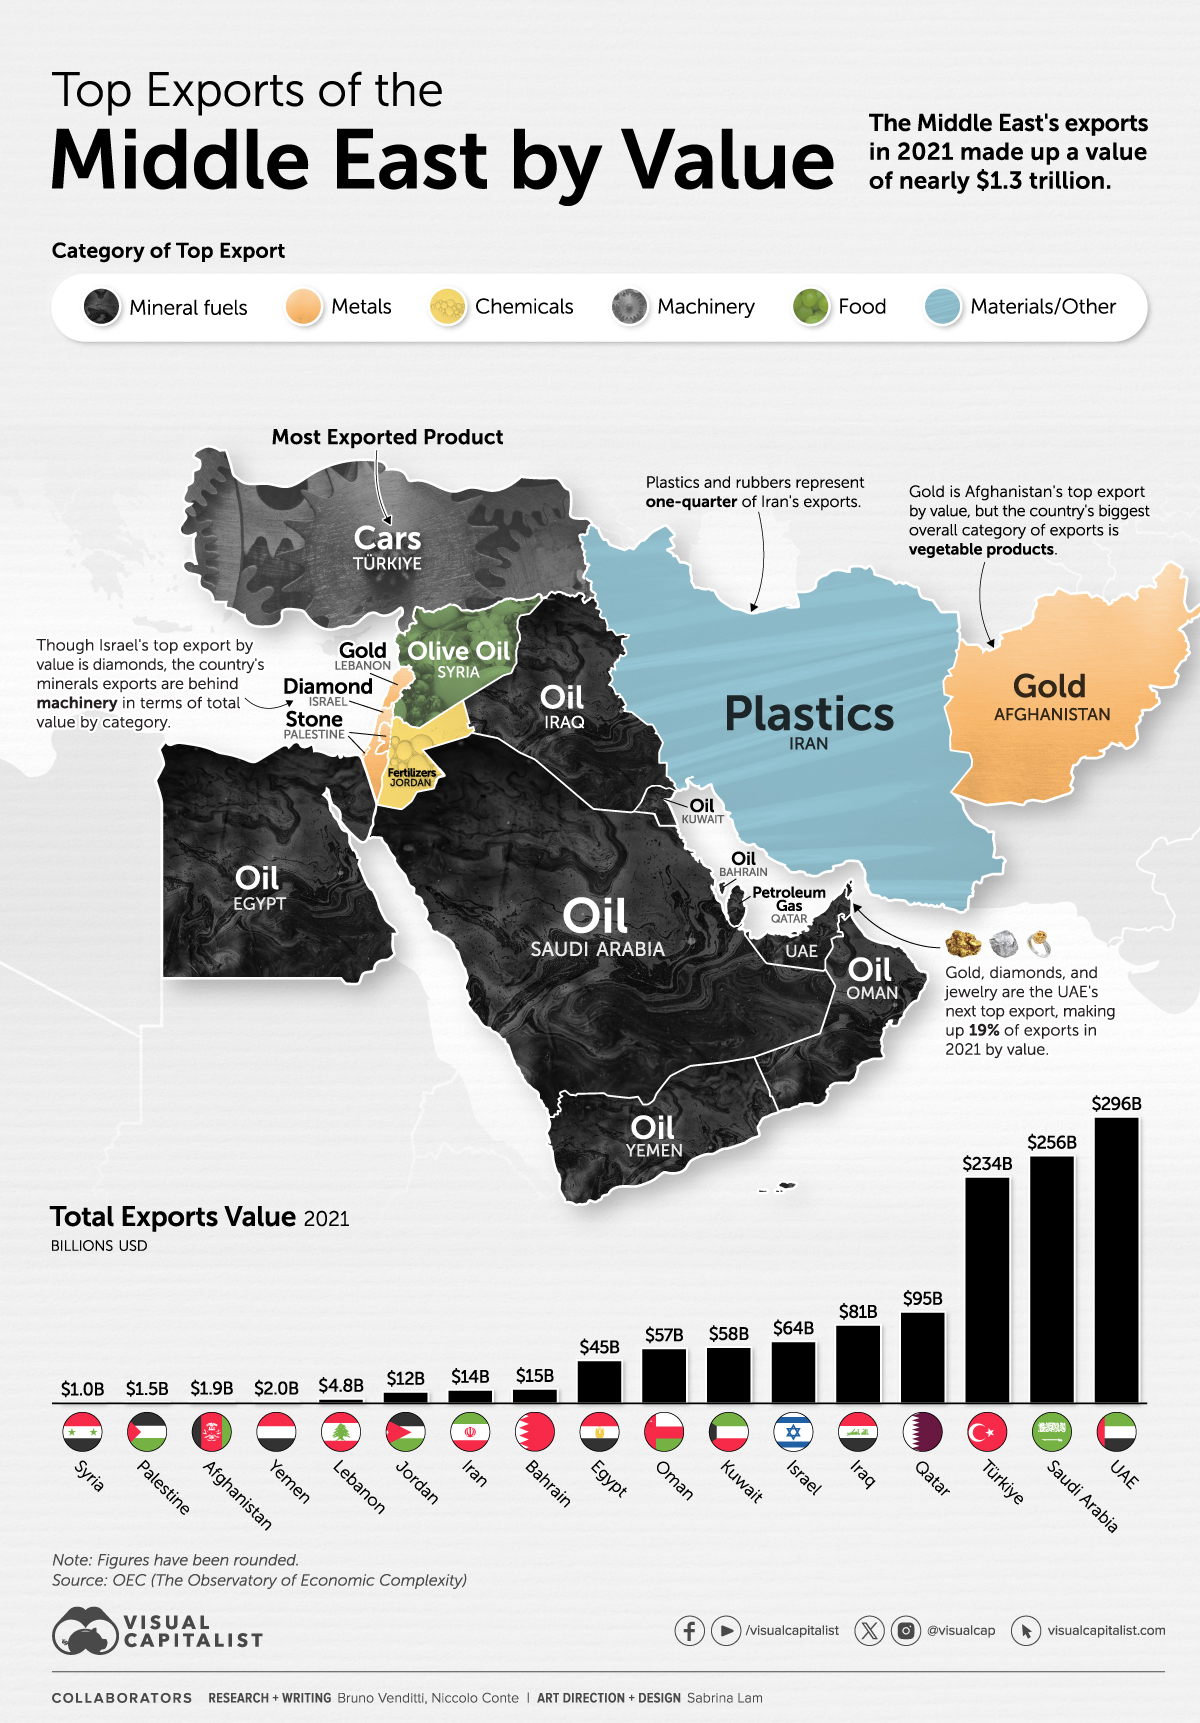
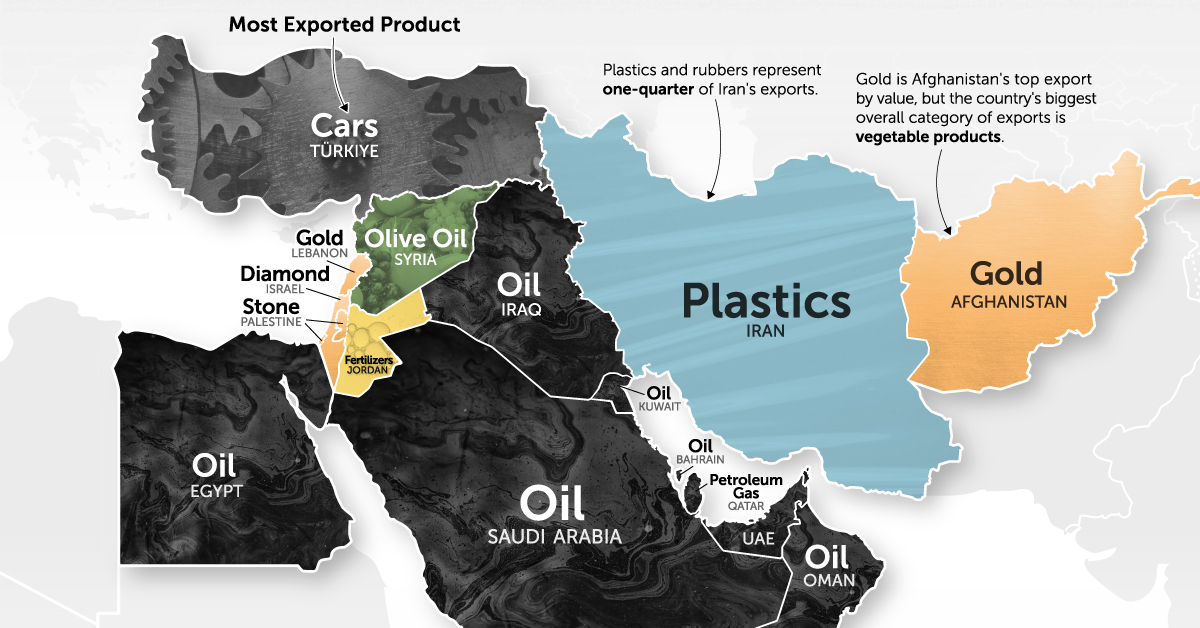
The Middle East is widely recognized for its significant role in the global energy market. However, countries in the region also foster other substantial industries, including metals, chemicals, and agriculture.
The graphic above uses 2021 exports data from The Observatory of Economic Complexity to help explain the economy of the Middle East.
Top Exports by Middle-Eastern Countries in 2021
In 2021, the Middle East’s exports reached a total value of $1.27 trillion. While the region lags behind Asia, Europe, and North America in global exports, it outpaces Africa and South America.
Despite many countries undertaking efforts to diversify their economies and reduce their oil dependence, most of the exports still come from fossil fuels.
| Country | Top Export (2021) | Top Export Value | Total Exports Value |
|---|---|---|---|
| 🇦🇪 UAE | Crude petroleum | $58.5B | $296.0B |
| 🇸🇦 Saudi Arabia | Crude petroleum | $138.0B | $256.0B |
| 🇹🇷 Turkey | Cars | $10.0B | $234.0B |
| 🇶🇦 Qatar | Petroleum gas | $57.2B | $94.7B |
| 🇮🇶 Iraq | Crude petroleum | $72.0B | $81.1B |
| 🇮🇱 Israel | Diamonds | $9.1B | $64.1B |
| 🇰🇼 Kuwait | Crude petroleum | $40.1B | $58.2B |
| 🇴🇲 Oman | Crude petroleum | $24.2B | $56.9B |
| 🇪🇬 Egypt | Refined petroleum | $4.8B | $44.5B |
| 🇧🇭 Bahrain | Refined petroleum | $4.3B | $15.0B |
| 🇮🇷 Iran | Ethylene polymers | $3.2B | $14.0B |
| 🇯🇴 Jordan | Potassic fertilizers | $1.2B | $12.0B |
| 🇱🇧 Lebanon | Gold | $0.4B | $4.8B |
| 🇾🇪 Yemen | Crude petroleum | $1.1B | $2.0B |
| 🇦🇫 Afghanistan | Grapes | $0.4B | $1.9B |
| 🇵🇸 Palestine | Building stone | $0.2B | $1.5B |
| 🇸🇾 Syria | Pure olive oil | $0.1B | $1.0B |
The Middle East accounts for one-third of global oil production, producing over 30 million barrels per day. Five of the world’s top 10 oil producers are located in the region.
But some countries like Türkiye show off more diverse economies. The country’s exports range from minerals to machinery and textiles, with cars as its top export. The country is actually one of the world’s top automotive exporters.
Israel is another of the Middle East’s most diverse economies. The country’s major exports encompass electronics, software, and refined petroleum, but cut diamonds rank as the country’s largest single export by value.
Iran has tapped into its ample reserves of oil and natural gas in a different way, becoming a significant producer of plastics. Presently, plastics and rubbers constitute one-quarter of Iran’s exports.
How the Middle East Impacts the Global Economy
Given that the oil sector is one of the most significant in the global economy in terms of both volume and transaction value, many Middle Eastern countries are substantial players in international politics.
Nations such as Saudi Arabia and the UAE have direct impact on the oil market and play a pivotal role in determining the price of the commodity.
Due to the region’s massive exports (and imports of goods), and the importance of oil and gas in goods manufacturing worldwide, regional conflicts by Middle Eastern countries also impact global markets directly.


Energy
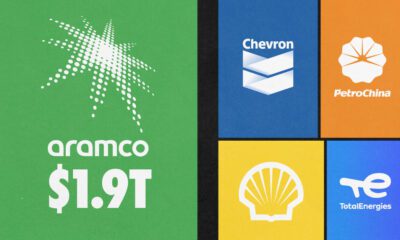
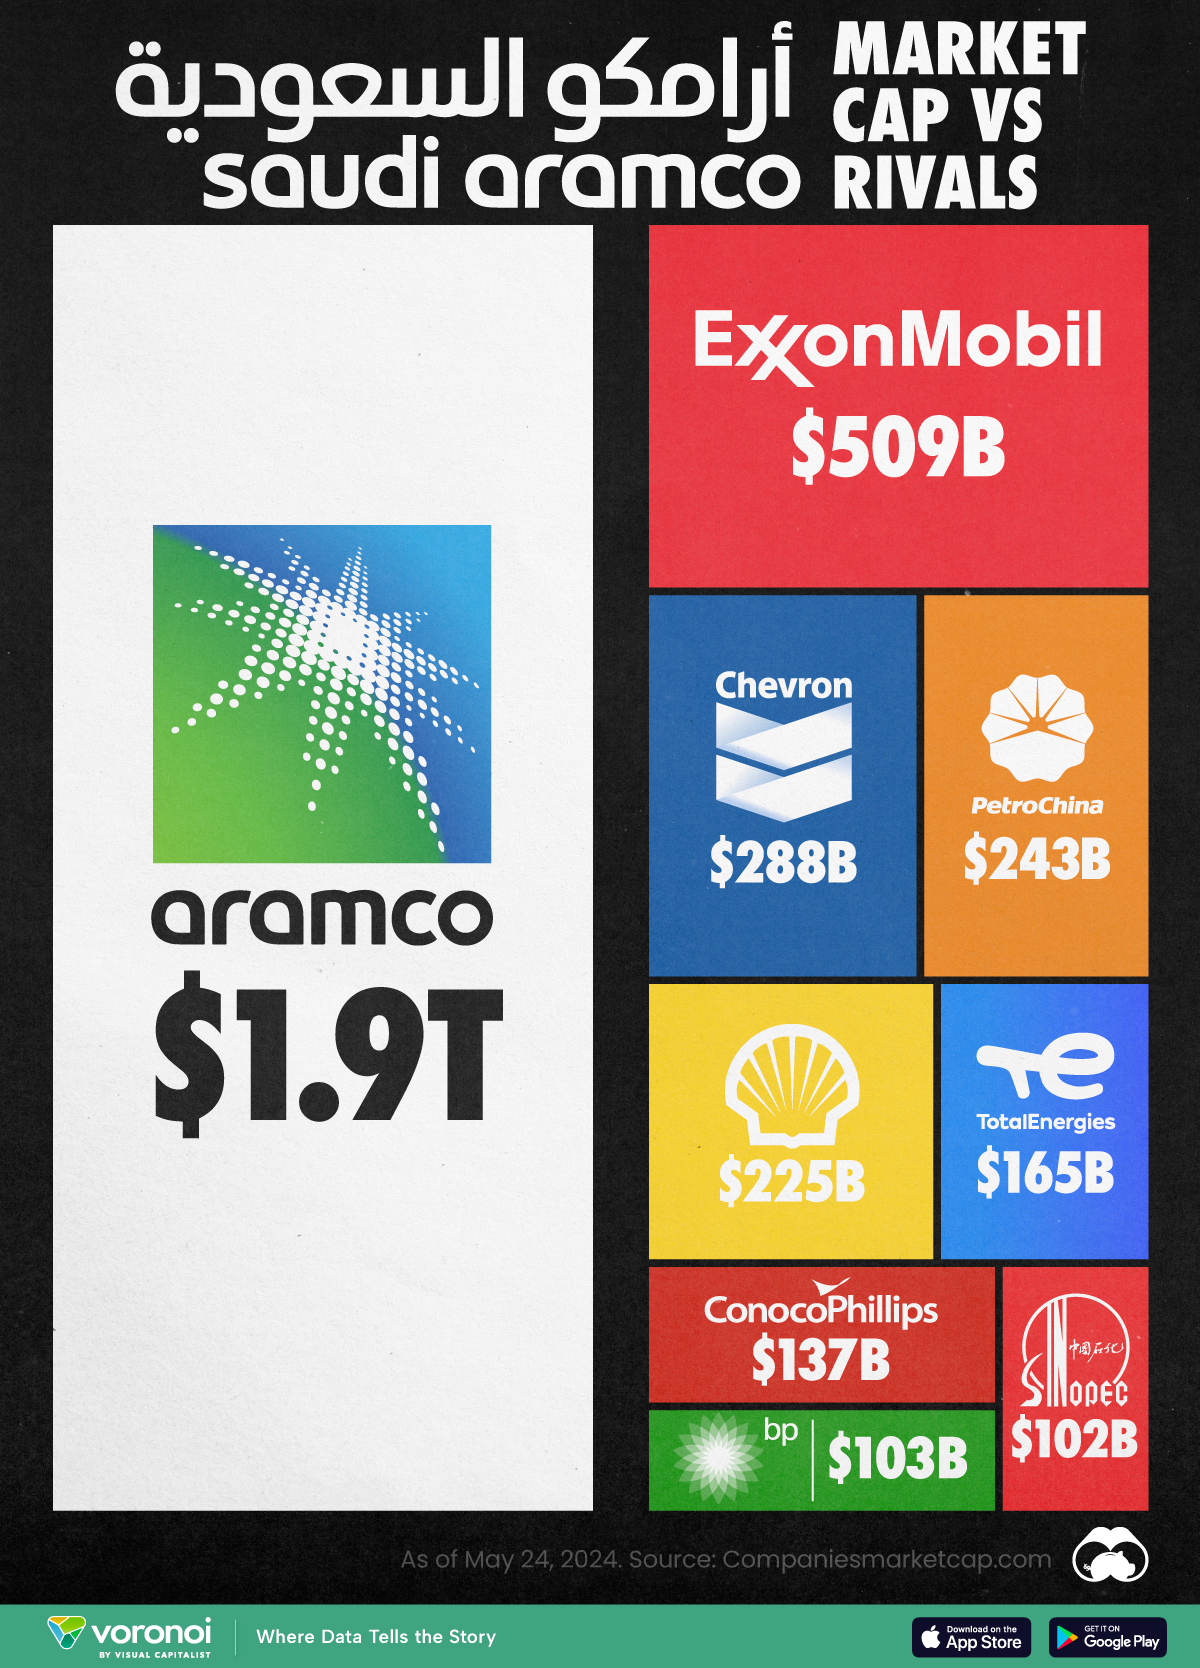
Comparing Saudi Aramco’s $1.9T Valuation to Its Rivals
See how much larger Saudi Aramco’s market cap is compared to rivals like Chevron, ExxonMobil, and Shell.

Putting Saudi Aramco’s Market Cap Into Perspective
This was originally posted on our Voronoi app. Download the app for free on iOS or Android and discover incredible data-driven charts from a variety of trusted sources.
As of May 2024, there are just six trillion-dollar companies in the world, and only one of them is an oil company.
In this graphic, we put Saudi Aramco’s market cap into perspective by comparing it to the rest of the world’s largest oil companies. Numbers were sourced from Companiesmarketcap.com, and are as of May 24, 2024.
Data and Takeaways
The data we used to create this graphic are listed in the table below.
| Company | Market Cap (as of May 24, 2024) |
|---|---|
| 🇸🇦 Saudi Aramco | $1,914B |
| 🇺🇸 Exxon Mobil | $509B |
| 🇺🇸 Chevron | $288B |
| 🇨🇳 Petro China | $243B |
| 🇳🇱 Shell | $225B |
| 🇫🇷 TotalEnergies | $165B |
| 🇺🇸 ConocoPhillips | $137B |
| 🇬🇧 BP | $103B |
| 🇨🇳 Sinopec | $102B |
Saudi Aramco launched its initial public offering (IPO) on December 11, 2019. It remains the largest IPO in history, raising $25.6 billion and valuing the company at $1.7 trillion. Aramco is also the only trillion-dollar company that isn’t based in the United States.
As of 2022, Aramco had proven reserves equal to 259 billion barrels of oil equivalent, which is massively greater than rivals like ExxonMobil (17.7 billion) and Chevron (11.2 billion).
$1.9T*
It should be noted that the Saudi government directly owns 90% of the company, while another 8% is held by the country’s sovereign wealth fund. With only 2% of shares available to the public, some believe that the company’s current valuation carries little weight.
For example, a Bloomberg op-ed from 2023 described Aramco’s valuation as an “illusion” due to its very low trading volume. Over a one year period, Aramco’s average daily turnover was just $51 million, compared to $1.9 billion for ExxonMobil and $1.4 billion for Chevron.
See More Market Cap Comparisons from Visual Capitalist
If you enjoyed this graphic, be sure to check out our similar graphic covering Nvidia.

-

 Energy1 week ago
Ranked: The World’s Largest Lithium Producers in 2023
-

 Public Opinion2 weeks ago
Charted: How Democrats and Republicans View Government Agencies
-

 Globalization2 weeks ago
Mapped: The Top Exports in Asian Countries
-

 Finance2 weeks ago
Ranked: The World’s 50 Largest Private Equity Firms
-

 United States2 weeks ago
Mapped: The 10 U.S. States With the Lowest Real GDP Growth
-

 China2 weeks ago
Comparing New and Current U.S. Tariffs on Chinese Imports
-

 Politics2 weeks ago
Which Countries Have the Most Economic Influence in Southeast Asia?
-

 population2 weeks ago
The Top 25 Nationalities of U.S. Immigrants