Markets
Mapped: The Top 10 Billionaire Cities
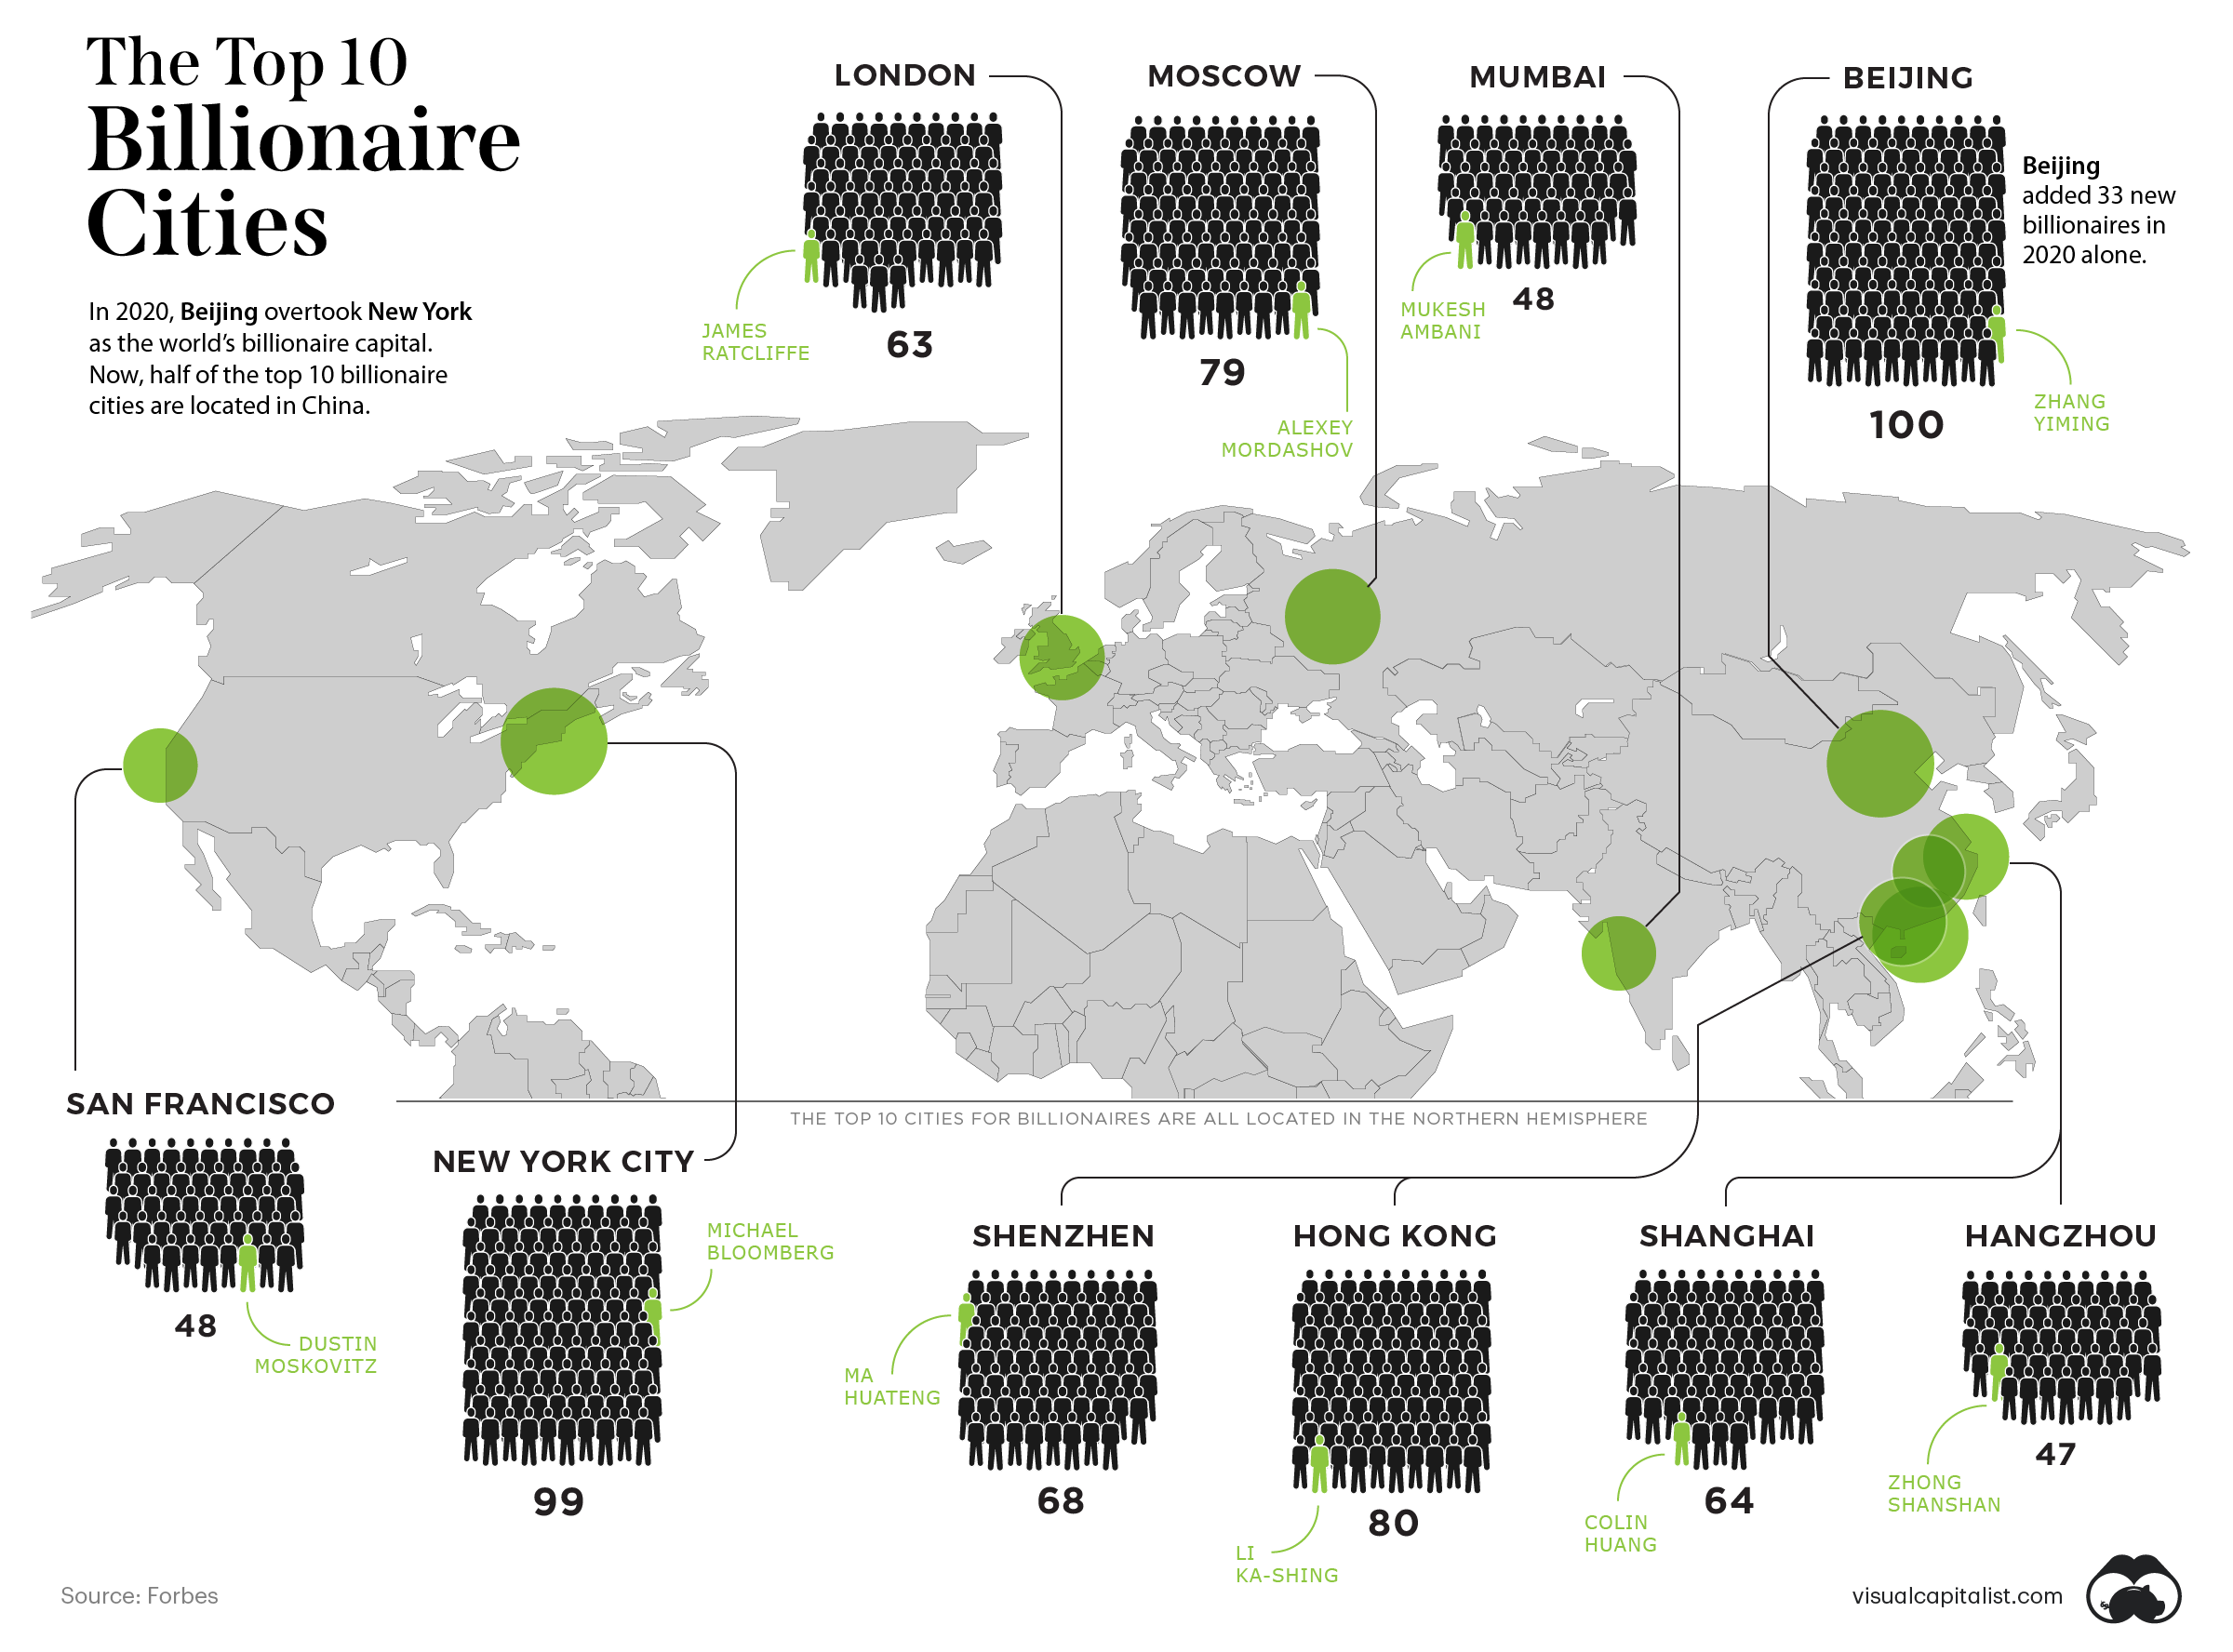


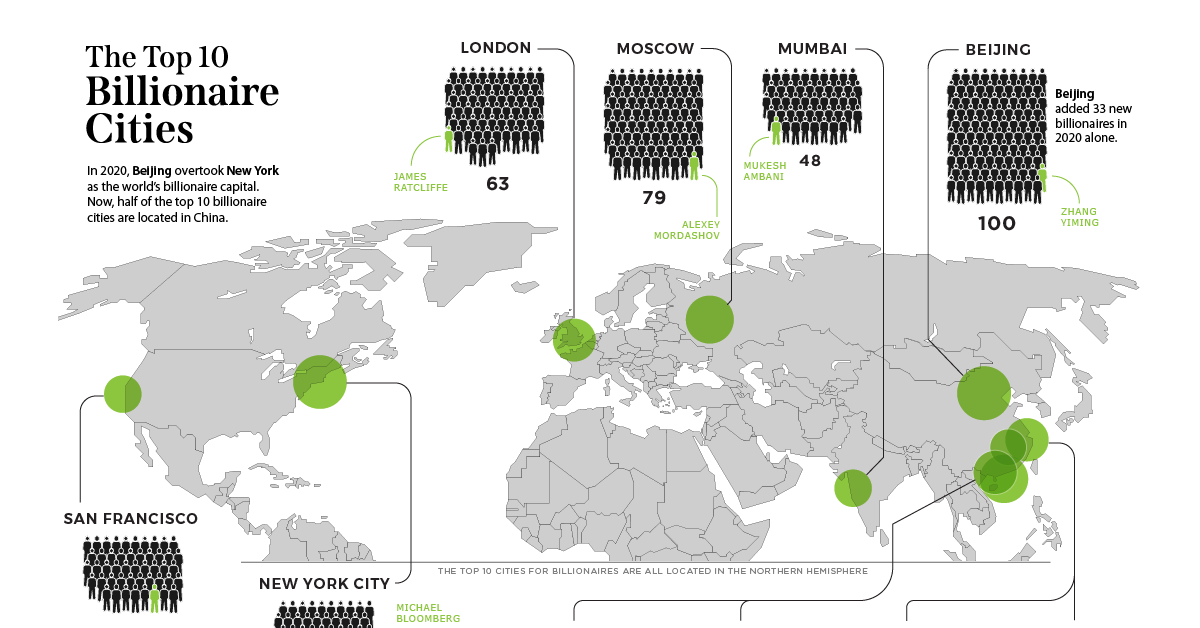
Mapped: The Top 10 Billionaire Cities in 2020
In 2020, the world gained 493 new billionaires—that’s one every 17 hours.
For the last seven years, New York City has been home to more billionaires than any other city in the world. However, last year marked a monumental shift in the status quo.
Beijing has unseated the Big Apple, and is now home to 100 billionaires. That’s one more billionaire than the 99 living in New York City.
Today’s map uses data from Forbes to display the top 10 cities that house the most billionaires.
Where do the Most Billionaires Live?
The richest of the rich are quite concentrated in cities, but some cities seem to best suit the billionaire lifestyle. Here’s a breakdown of the top 10 billionaire capitals and the collective net worth of all the ultra wealthy that live there.
| Rank | City | Region | Number of Billionaires | Net Worth of the City's Billionaires |
|---|---|---|---|---|
| #1 | Beijing | 🇨🇳 Asia | 100 | $484.3B |
| #2 | New York City | 🇺🇸 North America | 99 | $560.5B |
| #3 | Hong Kong | 🇨🇳 Asia | 80 | $448.4B |
| #4 | Moscow | 🇷🇺 Europe | 79 | $420.6B |
| #5 | Shenzhen | 🇨🇳 Asia | 68 | $415.3B |
| #6 | Shanghai | 🇨🇳 Asia | 64 | $259.6B |
| #7 | London | 🇬🇧 Europe | 63 | $316.1B |
| #8 | Mumbai | 🇮🇳 Asia | 48 | $265.0B |
| #9 | San Fransisco | 🇺🇸 North America | 48 | $190.0B |
| #10 | Hangzhou | 🇨🇳 Asia | 47 | $269.2B |
Some cities have some obvious billionaires that come to mind. New York’s richest person and former mayor, Michael Bloomberg, is worth $59 billion. Beijing’s richest billionaire is the founder of TikTok (among other things), Zhang Yiming with a net worth of $35.6 billion.
In terms of the locations themselves, London, New York, and San Francisco are the only Western cities to make the list. Though New York was ousted from the top position last year, altogether the city’s billionaires are still worth more than Beijing’s.
One new city to make the top 10 list of billionaire cities was Hangzhou, the home of Jack Ma. It booted out Singapore from the 10th spot.
East Meets West
More than half of the top 10 cities are located in Asia, providing evidence of the shift eastwards when it comes to seats of wealth. Five of the six Asian cities listed are all in China.
What’s helped lead to this?
The country has seen an e-commerce boom, not in the least thanks to the pandemic. Additionally, the efficient handling of COVID-19 has allowed the economy to get back on track much more quickly than other countries. According to the BBC, 50% of China’s new billionaires have made their wealth either through tech or manufacturing.
Four of the Chinese cities on the list also had the biggest billionaire growth in 2020. Each of them gained more than 10 net new billionaires:
- 🇨🇳 Hangzhou: 21
- 🇨🇳 Shanghai: 18
- 🇨🇳 Shenzhen: 24
- 🇨🇳 Beijing: 33
The only other city to gain more than 10 new billionaires in 2020 was San Francisco with 11.
Now sitting at 698 billionaires, China is coming up on the 724 held by the United States. Beijing overtaking NYC could be the beginning of a larger tipping point.
Shifting Tides
Asia-Pacific’s collective 1,149 billionaires are worth $4.7 trillion, while U.S. billionaires are worth $4.4 trillion in total wealth.
Overall, it looks like the wealth tides may be turning as China continues to progress economically and more billionaires become based in the East over the West.


Markets
Mapped: Europe’s GDP Per Capita, by Country
Which European economies are richest on a GDP per capita basis? This map shows the results for 44 countries across the continent.


Mapped: Europe’s GDP Per Capita, by Country (2024)
This was originally posted on our Voronoi app. Download the app for free on iOS or Android and discover incredible data-driven charts from a variety of trusted sources.
Europe is home to some of the largest and most sophisticated economies in the world. But how do countries in the region compare with each other on a per capita productivity basis?
In this map, we show Europe’s GDP per capita levels across 44 nations in current U.S. dollars. Data for this visualization and article is sourced from the International Monetary Fund (IMF) via their DataMapper tool, updated April 2024.
Europe’s Richest and Poorest Nations, By GDP Per Capita
Luxembourg, Ireland, and Switzerland, lead the list of Europe’s richest nations by GDP per capita, all above $100,000.
| Rank | Country | GDP Per Capita (2024) |
|---|---|---|
| 1 | 🇱🇺 Luxembourg | $131,380 |
| 2 | 🇮🇪 Ireland | $106,060 |
| 3 | 🇨🇭 Switzerland | $105,670 |
| 4 | 🇳🇴 Norway | $94,660 |
| 5 | 🇮🇸 Iceland | $84,590 |
| 6 | 🇩🇰 Denmark | $68,900 |
| 7 | 🇳🇱 Netherlands | $63,750 |
| 8 | 🇸🇲 San Marino | $59,410 |
| 9 | 🇦🇹 Austria | $59,230 |
| 10 | 🇸🇪 Sweden | $58,530 |
| 11 | 🇧🇪 Belgium | $55,540 |
| 12 | 🇫🇮 Finland | $55,130 |
| 13 | 🇩🇪 Germany | $54,290 |
| 14 | 🇬🇧 UK | $51,070 |
| 15 | 🇫🇷 France | $47,360 |
| 16 | 🇦🇩 Andorra | $44,900 |
| 17 | 🇲🇹 Malta | $41,740 |
| 18 | 🇮🇹 Italy | $39,580 |
| 19 | 🇨🇾 Cyprus | $37,150 |
| 20 | 🇪🇸 Spain | $34,050 |
| 21 | 🇸🇮 Slovenia | $34,030 |
| 22 | 🇪🇪 Estonia | $31,850 |
| 23 | 🇨🇿 Czech Republic | $29,800 |
| 24 | 🇵🇹 Portugal | $28,970 |
| 25 | 🇱🇹 Lithuania | $28,410 |
| 26 | 🇸🇰 Slovakia | $25,930 |
| 27 | 🇱🇻 Latvia | $24,190 |
| 28 | 🇬🇷 Greece | $23,970 |
| 29 | 🇭🇺 Hungary | $23,320 |
| 30 | 🇵🇱 Poland | $23,010 |
| 31 | 🇭🇷 Croatia | $22,970 |
| 32 | 🇷🇴 Romania | $19,530 |
| 33 | 🇧🇬 Bulgaria | $16,940 |
| 34 | 🇷🇺 Russia | $14,390 |
| 35 | 🇹🇷 Türkiye | $12,760 |
| 36 | 🇲🇪 Montenegro | $12,650 |
| 37 | 🇷🇸 Serbia | $12,380 |
| 38 | 🇦🇱 Albania | $8,920 |
| 39 | 🇧🇦 Bosnia & Herzegovina | $8,420 |
| 40 | 🇲🇰 North Macedonia | $7,690 |
| 41 | 🇧🇾 Belarus | $7,560 |
| 42 | 🇲🇩 Moldova | $7,490 |
| 43 | 🇽🇰 Kosovo | $6,390 |
| 44 | 🇺🇦 Ukraine | $5,660 |
| N/A | 🇪🇺 EU Average | $44,200 |
Note: Figures are rounded.
Three Nordic countries (Norway, Iceland, Denmark) also place highly, between $70,000-90,000. Other Nordic peers, Sweden and Finland rank just outside the top 10, between $55,000-60,000.
Meanwhile, Europe’s biggest economies in absolute terms, Germany, UK, and France, rank closer to the middle of the top 20, with GDP per capitas around $50,000.
Finally, at the end of the scale, Eastern Europe as a whole tends to have much lower per capita GDPs. In that group, Ukraine ranks last, at $5,660.
A Closer Look at Ukraine
For a broader comparison, Ukraine’s per capita GDP is similar to Iran ($5,310), El Salvador ($5,540), and Guatemala ($5,680).
According to experts, Ukraine’s economy has historically underperformed to expectations. After the fall of the Berlin Wall, the economy contracted for five straight years. Its transition to a Western, liberalized economic structure was overshadowed by widespread corruption, a limited taxpool, and few revenue sources.
Politically, its transformation from authoritarian regime to civil democracy has proved difficult, especially when it comes to institution building.
Finally, after the 2022 invasion of the country, Ukraine’s GDP contracted by 30% in a single year—the largest loss since independence. Large scale emigration—to the tune of six million refugees—is also playing a role.
Despite these challenges, the country’s economic growth has somewhat stabilized while fighting continues.

-

 Markets6 days ago
The Most Valuable Companies in Major EU Economies
-

 Wealth2 weeks ago
Charted: Which City Has the Most Billionaires in 2024?
-

 Technology2 weeks ago
All of the Grants Given by the U.S. CHIPS Act
-

 Green2 weeks ago
The Carbon Footprint of Major Travel Methods
-

 United States2 weeks ago
Visualizing the Most Common Pets in the U.S.
-

 Culture2 weeks ago
The World’s Top Media Franchises by All-Time Revenue
-

 voronoi1 week ago
Best Visualizations of April on the Voronoi App
-

 Wealth1 week ago
Charted: Which Country Has the Most Billionaires in 2024?