Technology
What Does 1GB of Mobile Data Cost in Every Country?


What Does 1GB of Mobile Data Cost in Every Country?
Billions of people around the world rely on their mobile phones every day.
Even in a saturated market, mobile networks have continued to expand their reach. In the last five years alone, almost one billion additional people have gained access to mobile data services.
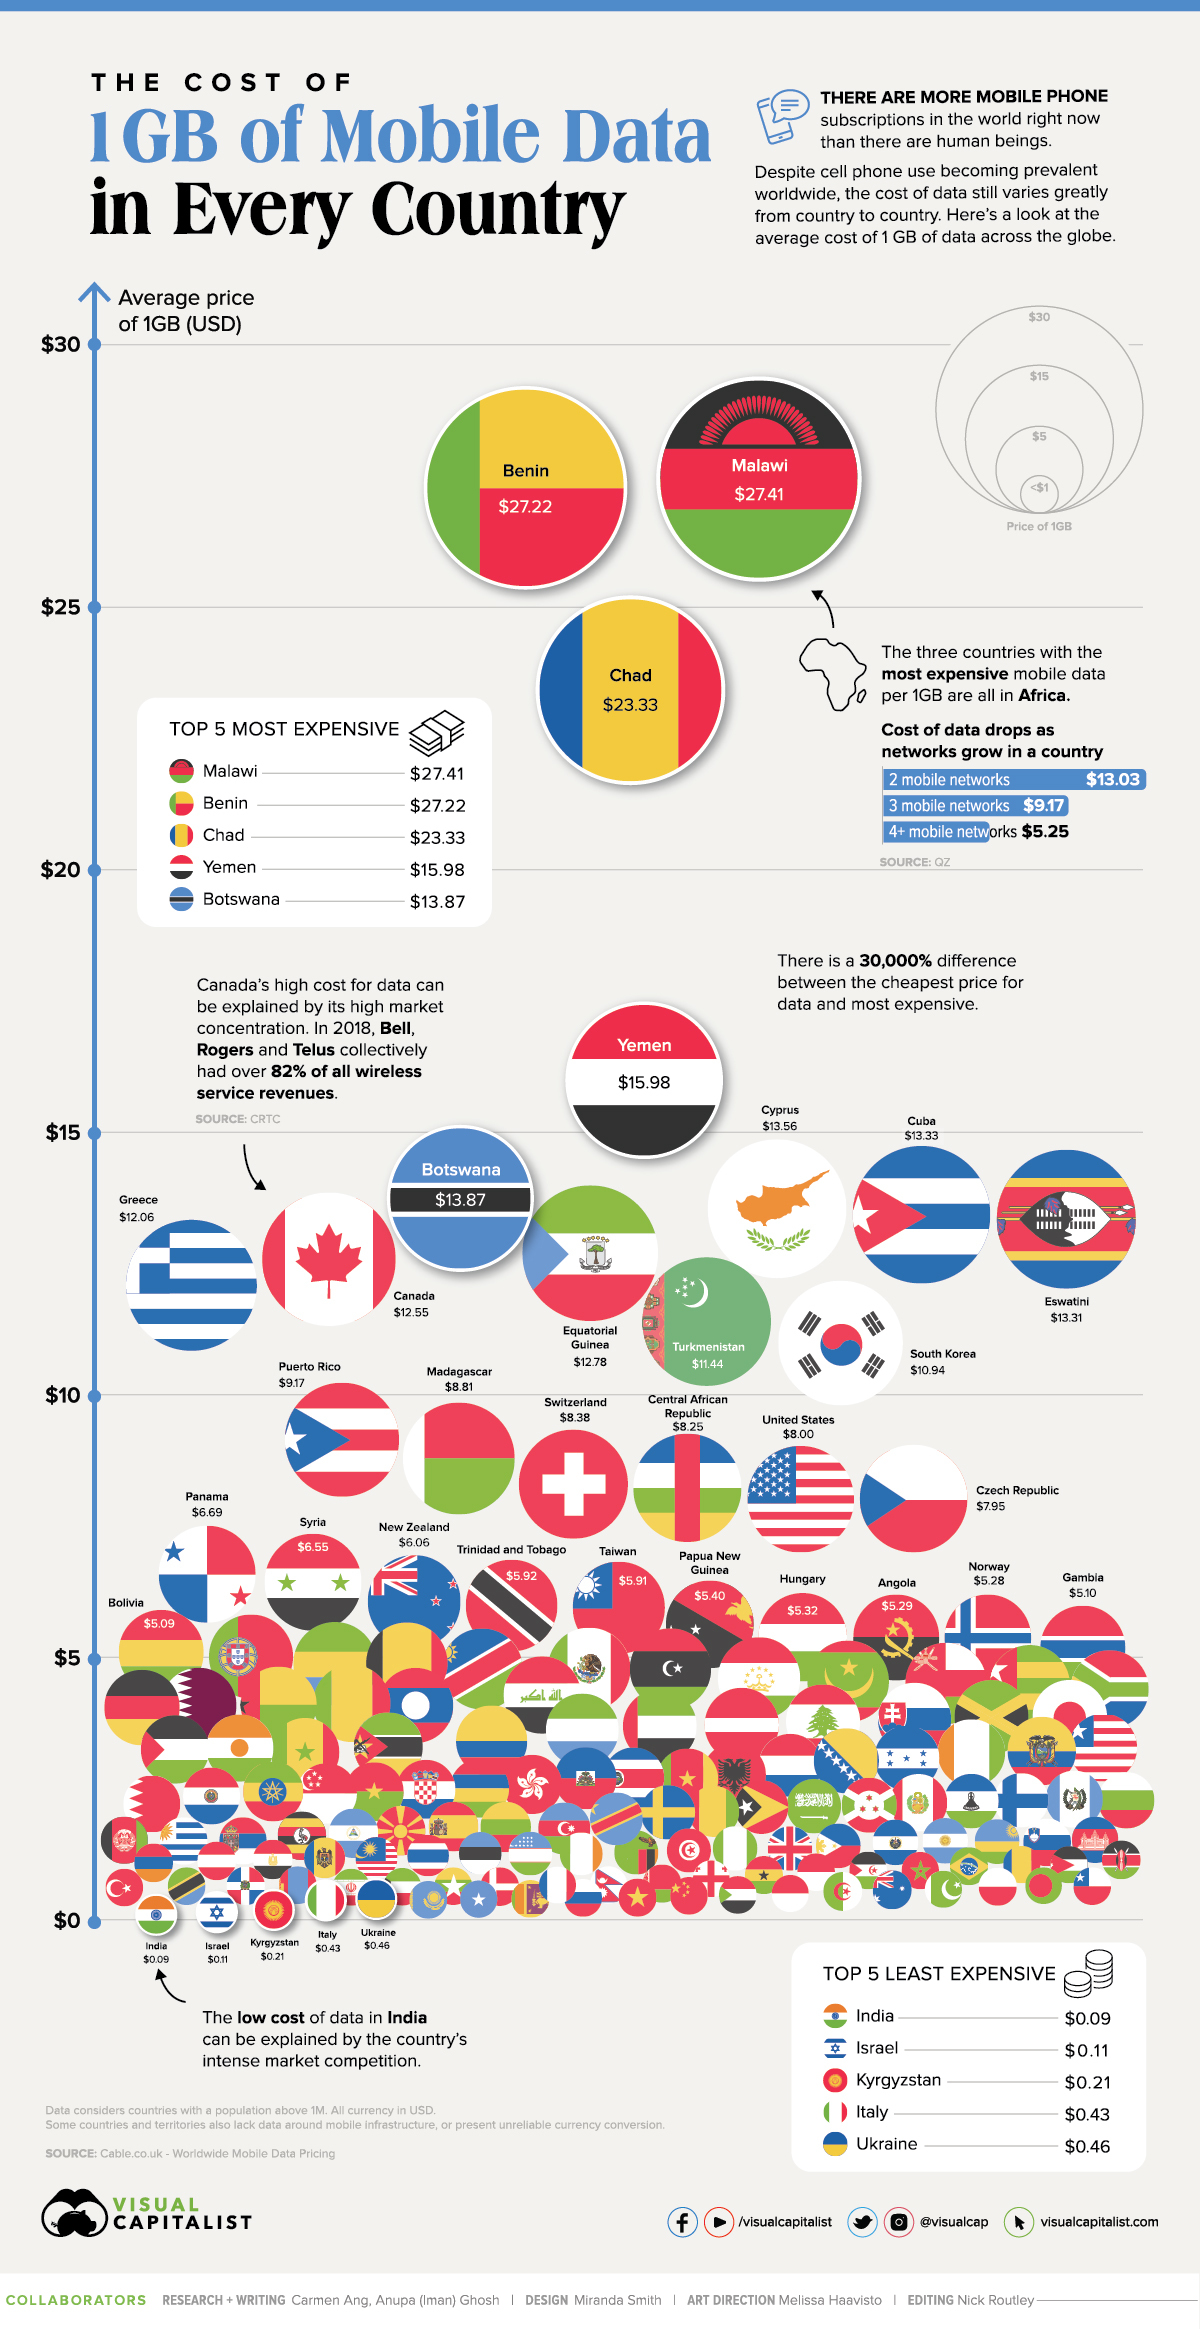
Despite the growing prevalence of these networks worldwide, the cost of gaining access can vary greatly from country to country—particularly when it comes to the price of mobile data.
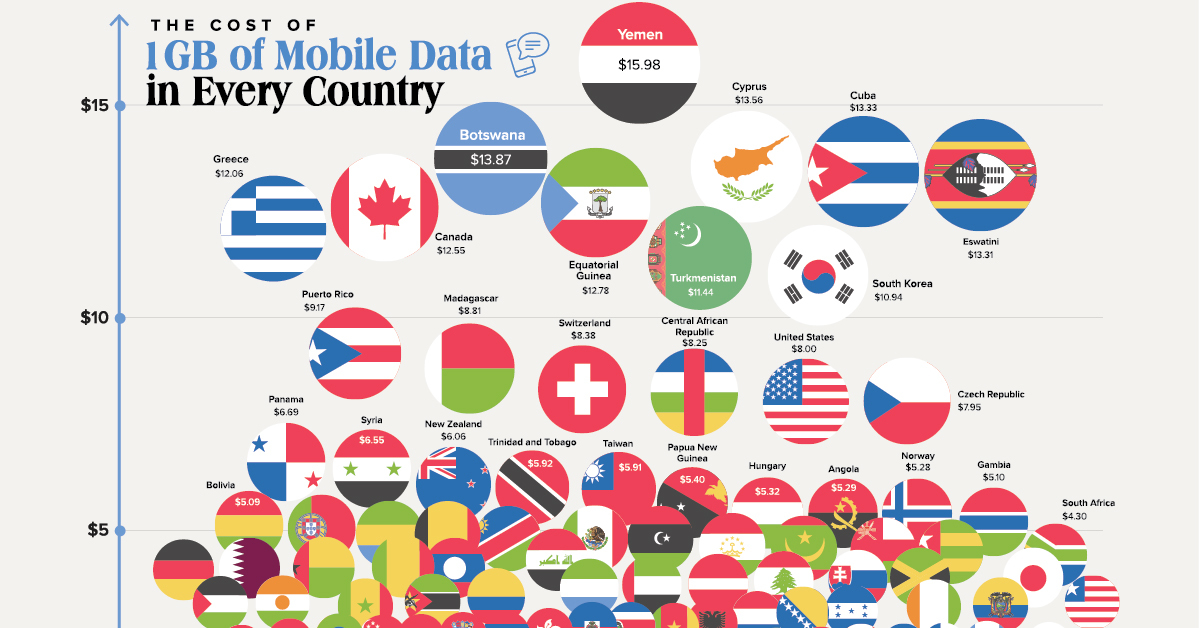
Today’s chart uses figures from Cable.co.uk to showcase the average cost of one gigabyte (GB) of mobile data in 155 different countries and jurisdictions. Despite the vast global reach of the mobile economy, it’s clear it still has a long way to go to reach true accessibility.
Discrepancies in Mobile Data Costs
Researchers have identified several key elements that help explain the cost variation for mobile data between countries:
- Existing infrastructure (or lack thereof): This might seem counterintuitive, but most mobile networks rely on a fixed-line connection. As a result, countries with existing infrastructure are able to offer mobile plans with more data, at a cheaper price. This is the case for India and Italy. Countries with minimal or no infrastructure rely on more costly connection alternatives like satellites, and the cost typically gets passed down to the consumer.
- Reliance on mobile data: When mobile data is the primary source of internet in a particular region, adoption can become nearly universal. This high demand typically leads to an increase in competing providers, which in turn lowers the cost. Kyrgyzstan is a good example of this.
- Low data consumption: Countries with poor infrastructure tend to use less data. With mobile plans that offer smaller data limits, the overall average cost per GB tends to skew higher. Countries like Malawi and Benin are examples of this phenomenon.
- Average income of consumer: Relatively wealthy nations tend to charge more for mobile services since the population can generally afford to pay more, and the cost of operating a network is higher. This is apparent in countries like Canada or Germany.
The Cheapest Countries for 1 GB of Data
Even among the cheapest countries for mobile data, the cost variation is significant. Here’s a look at the top five cheapest countries for 1 GB of data:
| Overall Rank | Country | Average price of 1GB (USD) |
|---|---|---|
| 1 | 🇮🇳 India | 9¢ |
| 2 | 🇮🇱 Israel | 11¢ |
| 3 | 🇰🇬 Kyrgyzstan | 21¢ |
| 4 | 🇮🇹 Italy | 43¢ |
| 5 | 🇺🇦 Ukraine | 46¢ |
India ranks the cheapest at $0.09 per GB, a 65% decrease in price compared to the country’s average cost in 2019.
Why is data so cheap in India? A significant factor is the country’s intense market competition, driven by Reliance Jio—a telecom company owned by Reliance Industries, one of the largest conglomerates in India. Reliance Jio launched in 2016, offering customers free trial periods and plans for less than a $1 a month. This forced other providers to drop their pricing, driving down the overall cost of data in the region.
Because these prices are likely unsustainable for the long term, India’s cheaper-than-usual prices may soon come to an end.
Another country worth highlighting is Kyrgyzstan, which ranks as the third cheapest at $0.21 per GB, ahead of Italy and Ukraine. This ranking is surprising, given the country’s minimal fixed-line infrastructure and large rural population. Researchers suspect the low cost is a result of Kyrgyzstan’s heavy reliance on mobile data as the population’s primary source of internet.
The Most Expensive Countries for 1 GB of Data
On the other end of the spectrum, here are the top five most expensive countries for one gigabyte of mobile data:
| Overall Rank | Country | Average price of 1GB (USD) |
|---|---|---|
| 155 | 🇲🇼 Malawi | $27.41 |
| 154 | 🇧🇯 Benin | $27.22 |
| 153 | 🇹🇩 Chad | $23.33 |
| 152 | 🇾🇪 Yemen | $15.98 |
| 151 | 🇧🇼 Botswana | $13.87 |
A striking trend worth noting is that four out of five of the most expensive countries for mobile data are in Sub-Saharan Africa (SSA).
A significant factor behind the high cost of data in SSA is its lack of infrastructure. With overburdened networks, the data bundles offered in the region are generally smaller. This drives up the average cost per GB when compared to countries with unlimited packages.
Another element that contributes to SSA’s high costs is its lack of market competition. In countries with multiple competing networks, such as Nigeria, the cost of data skews lower.
The Full Breakdown
The below table has a full list of all 155 countries and jurisdictions included in the data set. It helps demonstrate the stark contrast in the cost of mobile data between the most expensive and cheapest countries globally.
| Rank | Country | Average price of 1GB (USD) |
|---|---|---|
| 1 | India | 9¢ |
| 2 | Israel | 11¢ |
| 3 | Kyrgyzstan | 21¢ |
| 4 | Italy | 43¢ |
| 5 | Ukraine | 46¢ |
| 6 | Kazakhstan | 46¢ |
| 7 | Somalia | 50¢ |
| 8 | Sri Lanka | 51¢ |
| 9 | Russian Federation | 52¢ |
| 10 | Vietnam | 57¢ |
| 11 | China | 61¢ |
| 12 | Sudan | 63¢ |
| 13 | Indonesia | 64¢ |
| 14 | Algeria | 65¢ |
| 15 | Australia | 68¢ |
| 16 | Pakistan | 69¢ |
| 17 | Poland | 70¢ |
| 18 | Bangladesh | 70¢ |
| 19 | Chile | 71¢ |
| 20 | Turkey | 72¢ |
| 21 | Tanzania | 73¢ |
| 22 | Dominican Republic | 74¢ |
| 23 | Mongolia | 74¢ |
| 24 | Iran | 75¢ |
| 25 | Kuwait | 77¢ |
| 26 | Myanmar | 78¢ |
| 27 | Denmark | 80¢ |
| 28 | France | 81¢ |
| 29 | Nepal | 86¢ |
| 30 | Belarus | 89¢ |
| 31 | Georgia | 93¢ |
| 32 | Ghana | 94¢ |
| 33 | Monaco | 98¢ |
| 34 | Western Sahara | 99¢ |
| 35 | Morocco | 99¢ |
| 36 | Brazil | $1.01 |
| 37 | Romania | $1.03 |
| 38 | Jordan | $1.03 |
| 39 | Kenya | $1.05 |
| 40 | Armenia | $1.05 |
| 41 | Austria | $1.08 |
| 42 | Egypt | $1.09 |
| 43 | Moldova | $1.12 |
| 44 | Malaysia | $1.12 |
| 45 | Thailand | $1.23 |
| 46 | Estonia | $1.27 |
| 47 | Uzbekistan | $1.34 |
| 48 | Ireland | $1.36 |
| 49 | Zambia | $1.36 |
| 50 | Tunisia | $1.37 |
| 51 | Nigeria | $1.39 |
| 52 | United Kingdom | $1.39 |
| 53 | Philippines | $1.42 |
| 54 | El Salvador | $1.45 |
| 55 | Argentina | $1.45 |
| 56 | Rwanda | $1.48 |
| 57 | Slovenia | $1.48 |
| 58 | Cambodia | $1.50 |
| 59 | Afghanistan | $1.55 |
| 60 | Uruguay | $1.58 |
| 61 | Serbia | $1.60 |
| 62 | Uganda | $1.62 |
| 63 | Nicaragua | $1.71 |
| 64 | Macedonia | $1.75 |
| 65 | Spain | $1.81 |
| 66 | Lithuania | $1.85 |
| 67 | Azerbaijan | $1.86 |
| 68 | Congo | $1.94 |
| 69 | Sweden | $2.07 |
| 70 | Guinea | $2.08 |
| 71 | Timor-Leste | $2.08 |
| 72 | Saudi Arabia | $2.12 |
| 73 | Burundi | $2.12 |
| 74 | Peru | $2.13 |
| 75 | Lesotho | $2.13 |
| 76 | Finland | $2.14 |
| 77 | Guatemala | $2.17 |
| 78 | Bulgaria | $2.22 |
| 79 | Bahrain | $2.27 |
| 80 | Paraguay | $2.30 |
| 81 | Ethiopia | $2.44 |
| 82 | Singapore | $2.47 |
| 83 | Burkina Faso | $2.47 |
| 84 | Croatia | $2.48 |
| 85 | Mauritius | $2.48 |
| 86 | Hong Kong | $2.55 |
| 87 | Haiti | $2.74 |
| 88 | Costa Rica | $2.74 |
| 89 | Cameroon | $2.75 |
| 90 | Albania | $2.83 |
| 91 | Netherlands | $2.98 |
| 92 | Bosnia and Herzegovina | $3.04 |
| 93 | Honduras | $3.12 |
| 94 | Côte d'Ivoire | $3.20 |
| 95 | Ecuador | $3.24 |
| 96 | Liberia | $3.25 |
| 97 | Palestine | $3.26 |
| 98 | Niger | $3.30 |
| 99 | Senegal | $3.30 |
| 100 | Mozambique | $3.33 |
| 101 | Colombia | $3.46 |
| 102 | Sierra Leone | $3.69 |
| 103 | United Arab Emirates | $3.78 |
| 104 | Latvia | $3.79 |
| 105 | Lebanon | $3.82 |
| 106 | Slovakia | $3.84 |
| 107 | Jamaica | $3.88 |
| 108 | Japan | $3.91 |
| 109 | Germany | $4.06 |
| 110 | Qatar | $4.12 |
| 111 | Guinea-Bissau | $4.12 |
| 112 | Mali | $4.12 |
| 113 | Lao PDR | $4.16 |
| 114 | Iraq | $4.20 |
| 115 | South Africa | $4.30 |
| 116 | Togo | $4.50 |
| 117 | Oman | $4.58 |
| 118 | Mauritania | $4.63 |
| 119 | Tajikistan | $4.65 |
| 120 | Libya | $4.73 |
| 121 | Mexico | $4.77 |
| 122 | Namibia | $4.78 |
| 123 | Belgium | $4.88 |
| 124 | Gabon | $4.89 |
| 125 | Portugal | $4.97 |
| 126 | Bolivia | $5.09 |
| 127 | Gambia | $5.10 |
| 128 | Norway | $5.28 |
| 129 | Angola | $5.29 |
| 130 | Hungary | $5.32 |
| 131 | Papua New Guinea | $5.40 |
| 132 | Taiwan | $5.91 |
| 133 | Trinidad and Tobago | $5.92 |
| 134 | New Zealand | $6.06 |
| 135 | Syria | $6.55 |
| 136 | Panama | $6.69 |
| 137 | Czech Republic | $7.95 |
| 138 | United States | $8.00 |
| 139 | Central African Republic | $8.25 |
| 140 | Switzerland | $8.38 |
| 141 | Madagascar | $8.81 |
| 142 | Puerto Rico | $9.17 |
| 143 | South Korea | $10.94 |
| 144 | Turkmenistan | $11.44 |
| 145 | Greece | $12.06 |
| 146 | Canada | $12.55 |
| 147 | Equatorial Guinea | $12.78 |
| 148 | Eswatini | $13.31 |
| 149 | Cuba | $13.33 |
| 150 | Cyprus | $13.56 |
| 151 | Botswana | $13.87 |
| 152 | Yemen | $15.98 |
| 153 | Chad | $23.33 |
| 154 | Benin | $27.22 |
| 155 | Malawi | $27.41 |
Interestingly, the highest average cost is 30,000% more than the cheapest average price.
The Technology Gap
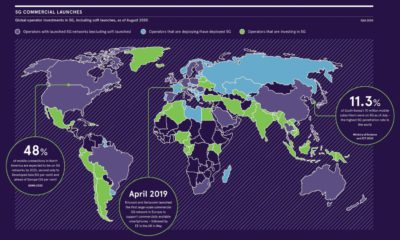
Will we reach a point of equal accessibility across the globe, or will the technology gap between countries continue to widen?
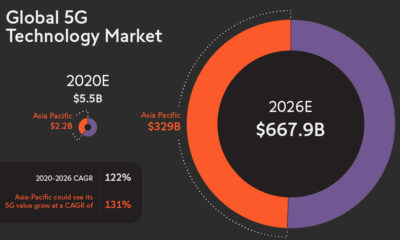
With 5G networks on the rise, just seven countries are expected to make up the majority of 5G related investments. Time will tell what this means for adoption worldwide.
Editor’s Note: The methodology used by Cable.co.uk represents a region’s national average, based on both pre-paid and post-paid plans. While the data correctly represents each region’s average cost on 1 GB based on the chosen methodology, Cable.co.uk acknowledges that it may not reflect the way most people in a country consume data.


Technology
Countries With the Highest Rates of Crypto Ownership
While the U.S. is a major market for cryptocurrencies, two countries surpass it in terms of their rates of crypto ownership.


Countries With the Highest Rates of Crypto Ownership
This was originally posted on our Voronoi app. Download the app for free on iOS or Android and discover incredible data-driven charts from a variety of trusted sources.
This graphic ranks the top 10 countries by their rate of cryptocurrency ownership, which is the percentage of the population that owns crypto. These figures come from crypto payment gateway, Triple-A, and are as of 2023.
Data and Highlights
The table below lists the rates of crypto ownership in the top 10 countries, as well as the number of people this amounts to.
| Country | % of Population Who Own Crypto | # of Crypto Owners |
|---|---|---|
| 🇦🇪 United Arab Emirates | 30.4 | 3M |
| 🇻🇳 Vietnam | 21.2 | 21M |
| 🇺🇸 U.S. | 15.6 | 53M |
| 🇮🇷 Iran | 13.5 | 12M |
| 🇵🇭 Philippines | 13.4 | 16M |
| 🇧🇷 Brazil | 12 | 26M |
| 🇸🇦 Saudi Arabia | 11.4 | 4M |
| 🇸🇬 Singapore | 11.1 | 665K |
| 🇺🇦 Ukraine | 10.6 | 4M |
| 🇻🇪 Venezuela | 10.3 | 3M |
Note that if we were to rank countries based on their actual number of crypto owners, India would rank first at 93 million people, China would rank second at 59 million people, and the U.S. would rank third at 52 million people.
The UAE Takes the Top Spot
The United Arab Emirates (UAE) boasts the highest rates of crypto ownership globally. The country’s government is considered to be very crypto friendly, as described in Henley & Partners’ Crypto Wealth Report 2023:
In the UAE, the Financial Services Regulatory Authority (FSRA-ADGM) was the first to provide rules and regulations regarding cryptocurrency purchasing and selling. The Emirates are generally very open to new technologies and have proposed zero taxes for crypto owners and businesses.
Vietnam leads Southeast Asia
According to the Crypto Council for Innovation, cryptocurrency holdings in Vietnam are also untaxed, making them an attractive asset.
Another reason for Vietnam’s high rates of ownership could be its large unbanked population (people without access to financial services). Cryptocurrencies may provide an alternative means of accessing these services without relying on traditional banks.
Learn More About Crypto From Visual Capitalist
If you enjoyed this post, be sure to check out The World’s Largest Corporate Holders of Bitcoin, which ranks the top 12 publicly traded companies by their Bitcoin holdings.

-

 Markets6 days ago
Mapped: Europe’s GDP Per Capita, by Country
-

 Energy2 weeks ago
Mapped: The Age of Energy Projects in Interconnection Queues, by State
-

 Mining2 weeks ago
Visualizing Global Gold Production in 2023
-

 Markets2 weeks ago
Visualized: Interest Rate Forecasts for Advanced Economies
-

 Economy2 weeks ago
The Most Valuable Companies in Major EU Economies
-

 Markets1 week ago
The World’s Fastest Growing Emerging Markets (2024-2029 Forecast)
-

 Markets1 week ago
Visualizing Global Inflation Forecasts (2024-2026)
-

 United States1 week ago
Charted: What Southeast Asia Thinks About China & the U.S.