Maps
1 Billion Years of Tectonic Plate Movement in 40 Seconds
1 Billion Years of Tectonic Plate Movement in 40 Seconds
According to plate tectonic theory, the Earth’s surface is made up of slabs of rock that are slowly shifting right under our feet.
Because of this constant movement, today’s Earth looks a lot different from what it did millions of years ago. Today’s animation looks at the Earth’s tectonic plate movement from 1 ga (geological time for 1 billion years ago) to the present-day, via EarthByte on YouTube.
Editor’s note: The video starts at time 1,000 ma (1,000 million years ago), and ticks down at the rate of about 25 million years every second.
The Emergence of Plate Tectonic Theory
Plate tectonics is a relatively new theory—in fact, according to National Geographic, it hadn’t become popular until the 1960s. However, the concept of continental movement was brewing long before it became widely accepted.
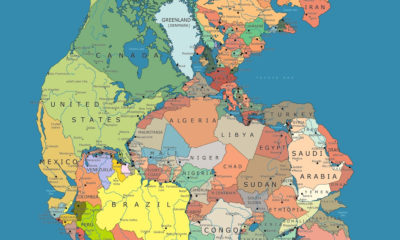
In 1912, German scientist Alfred Wegener proposed a theory he called continental drift. According to Wegener’s theory, Earth’s continents once formed a single, giant landmass, which he called Pangaea.
Over millions of years, Pangaea slowly broke apart, eventually forming the continents as they are today. Wegener believed this continental drift explained why the borders of South America and Africa looked like matching puzzle pieces. He also pointed to similar rock formations and fossils on these two continents as proof to back his theory.
Initially, the scientific community wasn’t on board with the theory of continental drift. But as more data emerged over the years, including research on seafloor spreading, the theory started to gain traction.
The Supercontinent Cycle
Nowadays, it’s believed that Pangea was just one of several supercontinents to mass together (and break apart) over the course of geological history.
The exact number of supercontinents is largely debated, but according to the Encylopedia of Geology, here are five (including Pangea) that are widely recognized:
- Kenorland: 2.7-2.5 billion years ago
- Nuna/Columbia: 1.6-1.4 billion years ago
- Rodinia: 950–800 million years ago
- Pannotia: 620-580 million years ago
- Pangea: 325-175 million years ago
According to the theory, this cycle of breaking apart and coming together happens because of subduction, which occurs when tectonic plates converge with one another.
The supercontinent cycle also ties into ocean formation. The below example of the Wilson Cycle specifically keys in on how the Atlantic Ocean, and its predecessor, the Iapetus Ocean, were formed as supercontinents drifted apart:
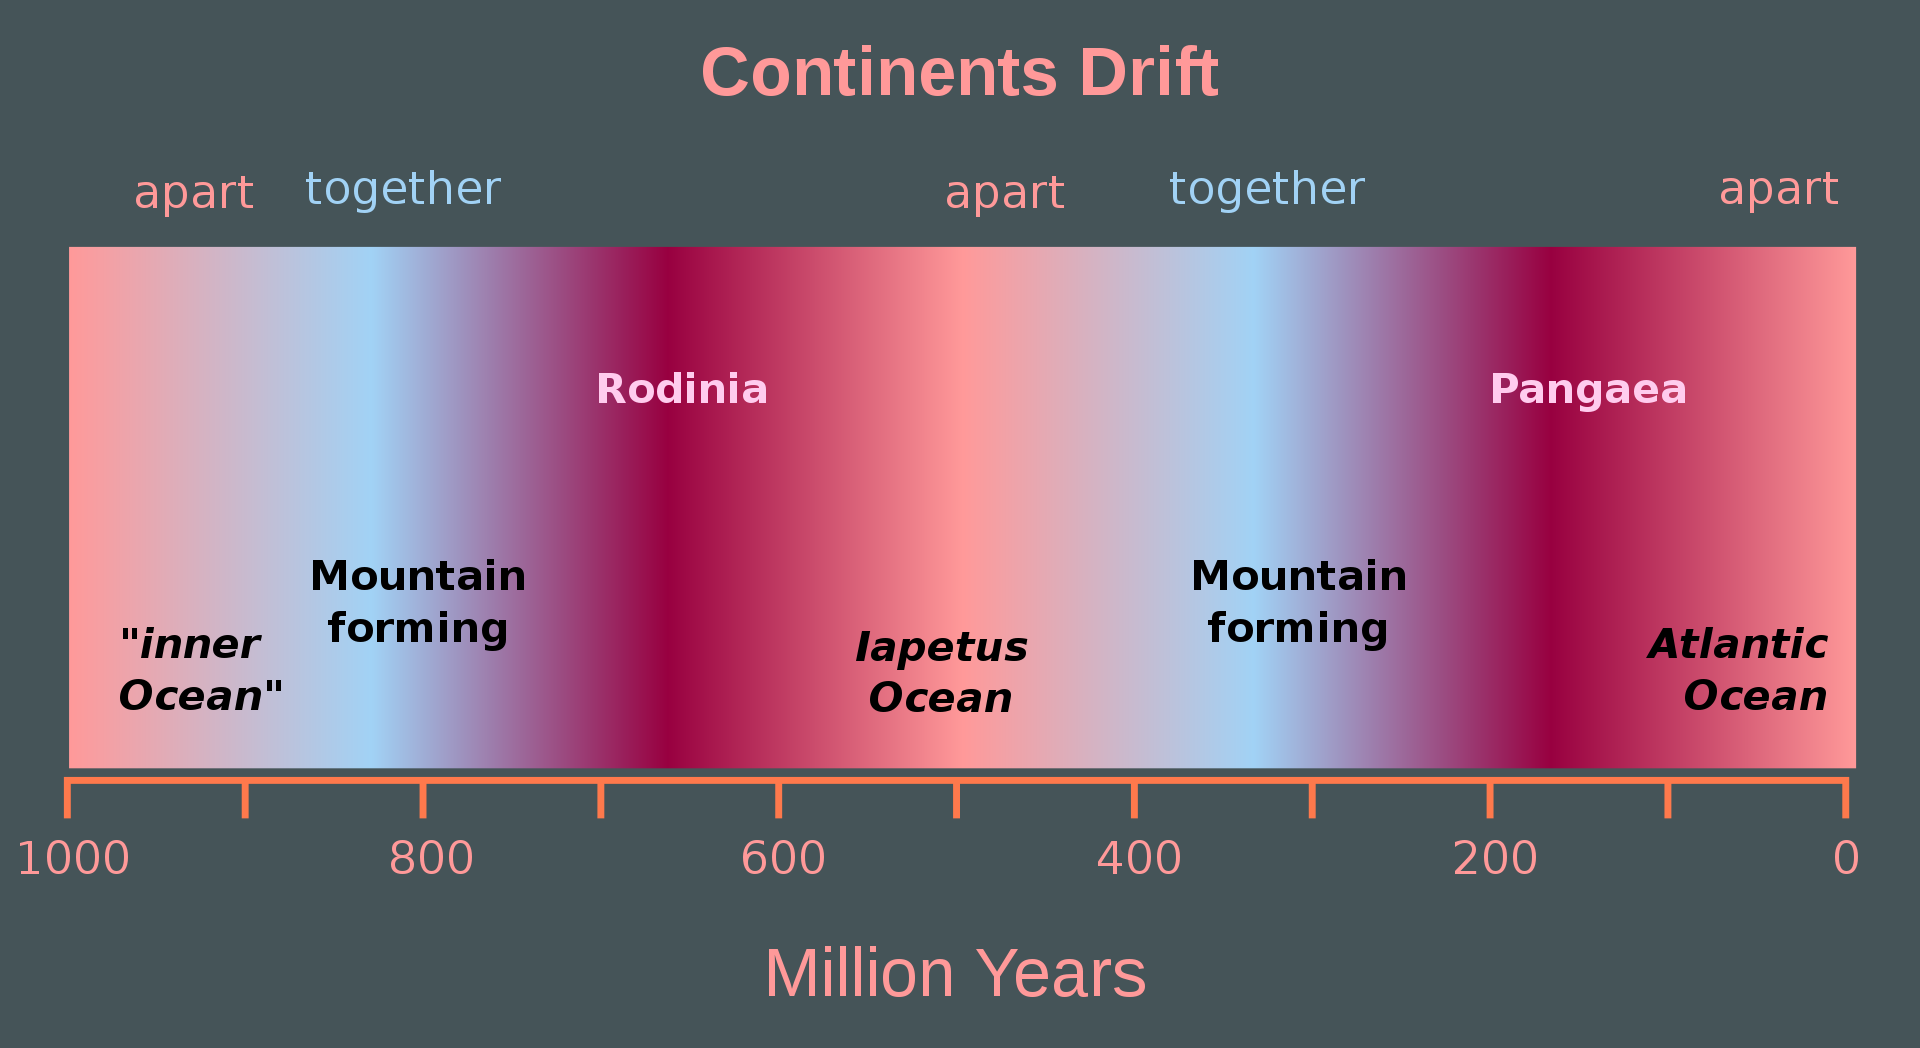
Source: Hannes Grobe
The Importance of Plate Tectonics
Plate tectonics has been a game-changer for geologists. The theory has helped to explain tons of unanswered geological questions, assisting scientists in understanding how volcanoes, mountains, and ocean ridges are formed.
It’s also valuable for the oil and gas industry since it explains how sedimentary basins were created, allowing geologists and engineers to target and locate vast oil reserves.
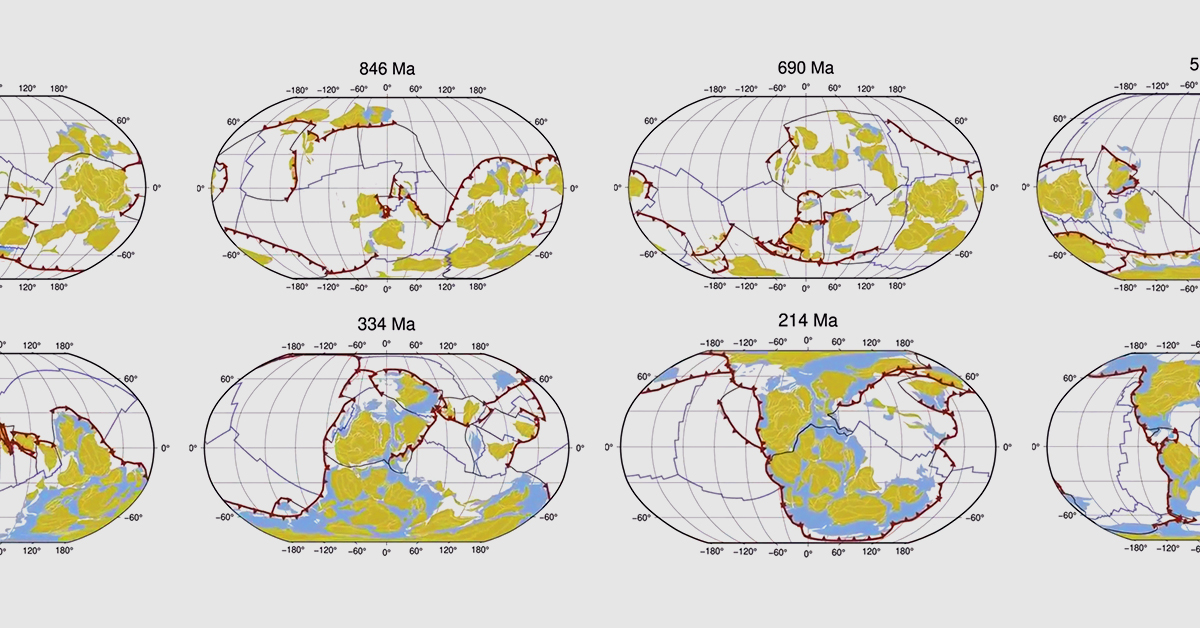
Since the theory of plate tectonics is relatively new, there’s still a lot to be discovered in this field of research. However, in March 2021, a report was published in Earth-Science Reviews that, for the first time, visualized a continuous plate model that shows how Earth’s plates have shifted over the last billion years.
The video above visualizes this particular report and accurately depicts the Earth’s tectonic plates’ movement or the observed shift in Earth’s tectonic plates over the years.


United States
Mapped: U.S. States By Number of Cities Over 250,000 Residents
Eighteen U.S. States don’t have a single incorporated area with more than 250,000 people.
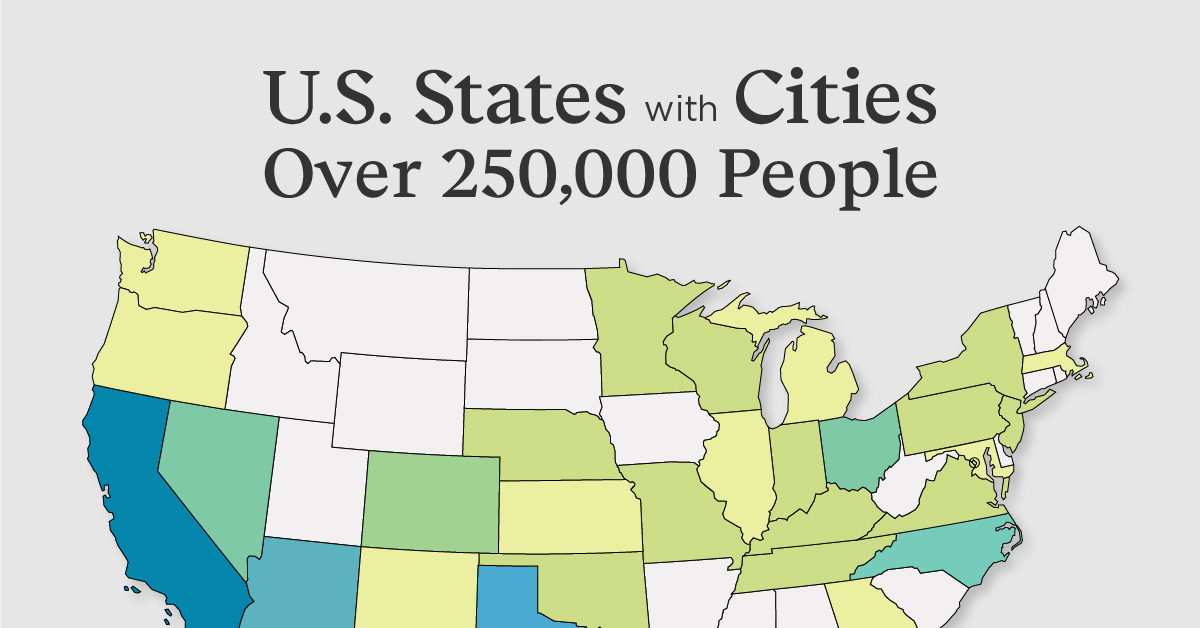
Mapped: U.S. States By Number of Cities Over 250K Residents
This was originally posted on our Voronoi app. Download the app for free on iOS or Android and discover incredible data-driven charts from a variety of trusted sources.
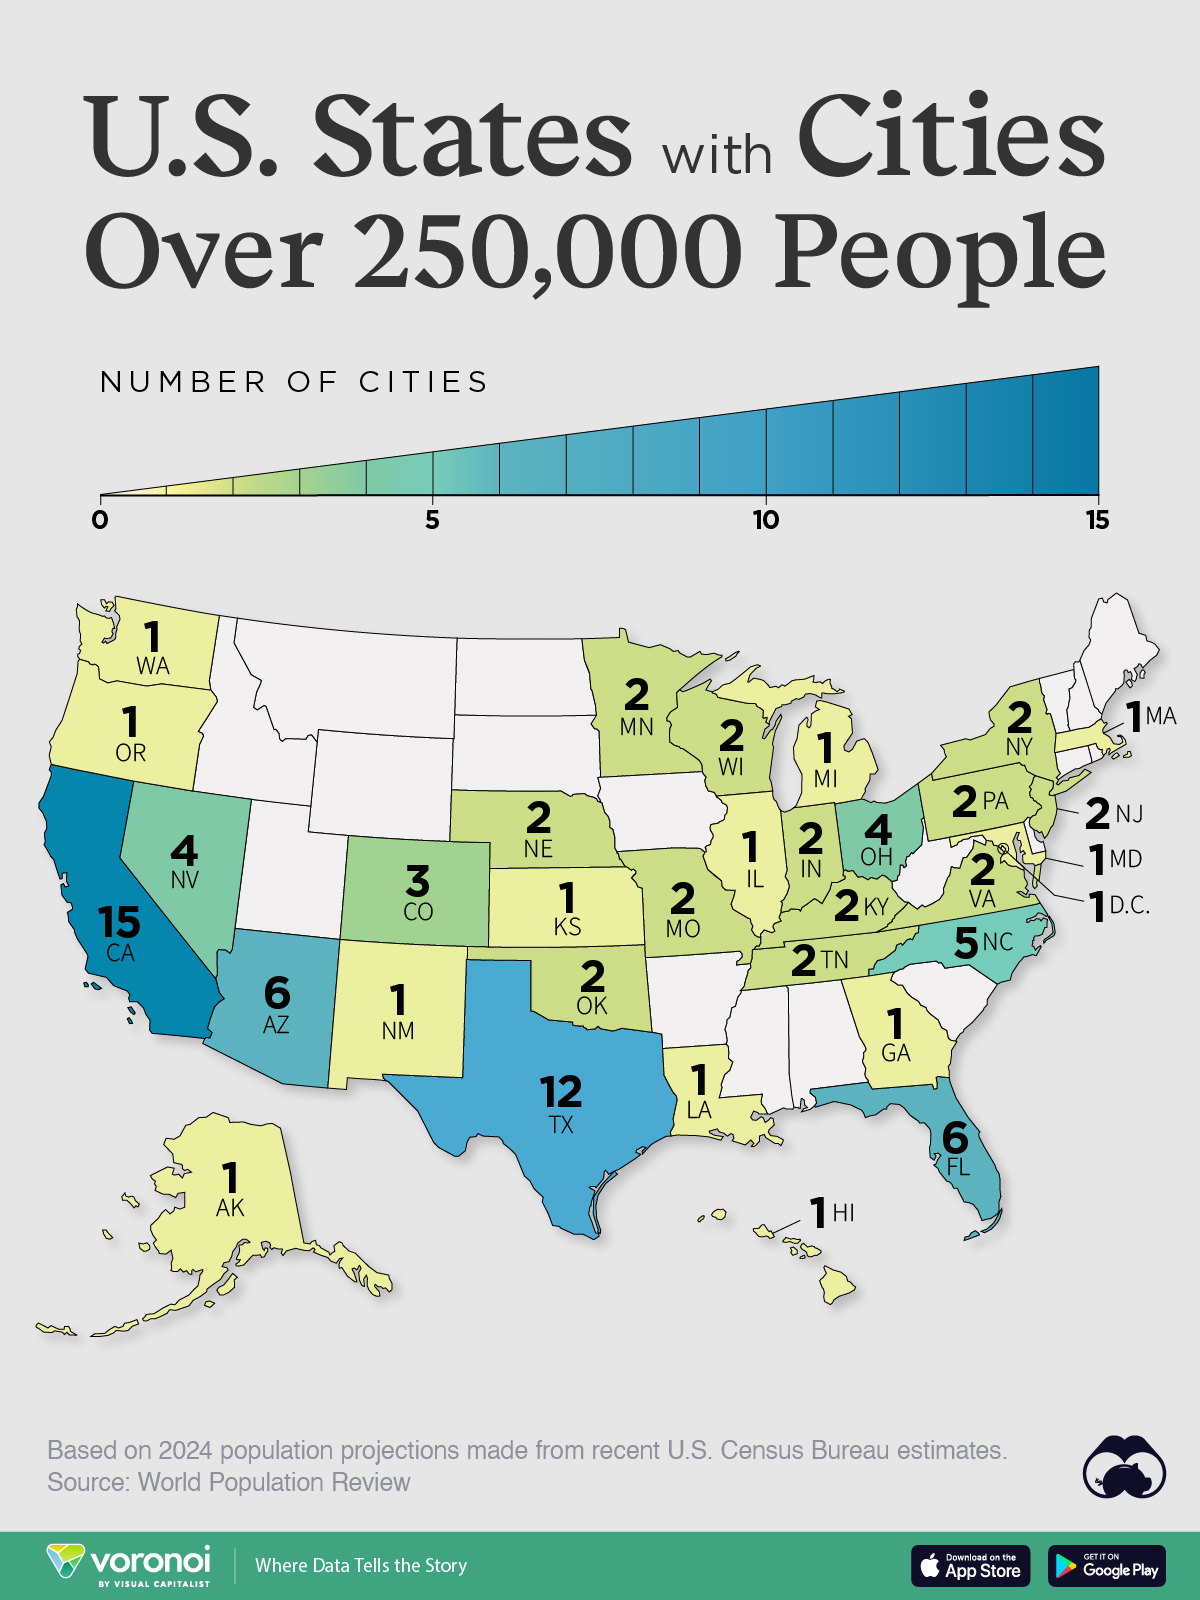
Over 80% of the American population lives in an “urban area” according to the U.S. Census Bureau. But where are all of the country’s largest cities, and what patterns can we see from their state locations?
This map shows U.S. states by their number of incorporated areas (i.e. cities or towns) that have more than 250,000 residents. Data for this map comes from 2024 estimates made by World Population Review, which were based on the latest U.S. Census Bureau figures.
Ranked: U.S. States By Number of Cities Over 250K Residents
California and Texas—also the most populous U.S. states—each have more than 10 cities with at least a quarter of a million inhabitants.
| State | Cities With 250K People | City Names |
|---|---|---|
| California | 15 | Los Angeles, San Diego, San Jose, San Francisco, Fresno, Sacramento, Long Beach, Oakland, Bakersfield, Anaheim, Riverside, Stockton, Irvine, Santa Ana, Chula Visa |
| Texas | 12 | Houston, San Antonio, Dallas, Fort Worth, Austin, El Paso, Arlington, Corpus Christi, Plano, Lubbock, Laredo, Irving |
| Arizona | 6 | Phoenix, Tucson, Mesa, Chandler, Gilbert, Glendale |
| Florida | 6 | Jacksonville, Miami, Tampa, Orlando, St. Petersburg, Port St. Lucie |
| North Carolina | 5 | Charlotte, Raleigh, Greensboro, Durham, Winston-Salem |
| Ohio | 4 | Columbus, Cleveland, Cincinnati, Toledo |
| Nevada | 4 | Las Vegas, Henderson, North Las Vegas, Reno |
| Colorado | 3 | Denver, Colorado Springs, Aurora |
| Tennessee | 2 | Nashville, Memphis |
| New York | 2 | New York, Buffalo |
| Pennsylvania | 2 | Philadelphia, Pittsburgh |
| Indiana | 2 | Indianapolis, Fort Wayne |
| Oklahoma | 2 | Oklahoma City, Tulsa |
| Kentucky | 2 | Louisville/Jefferson County, Lexington |
| Wisconsin | 2 | Milwaukee, Madison |
| Missouri | 2 | Kansas City, St. Louis |
| Nebraska | 2 | Omaha, Lincoln |
| Virginia | 2 | Virginia Beach, Chesapeake |
| Minnesota | 2 | Minneapolis, St. Paul |
| New Jersey | 2 | Newark, Jersey City |
| Illinois | 1 | Chicago |
| Washington | 1 | Seattle |
| District of Columbia | 1 | Washington D.C. |
| Massachusetts | 1 | Boston |
| Oregon | 1 | Portland |
| Michigan | 1 | Detroit |
| New Mexico | 1 | Albuquerque |
| Maryland | 1 | Baltimore |
| Georgia | 1 | Atlanta |
| Kansas | 1 | Wichita |
| Louisiana | 1 | New Orleans |
| Hawaii | 1 | Honolulu |
| Alaska | 1 | Anchorage |
Two other warm weather states, Arizona and Florida, also have a number of cities with 250,000 or more residents, at six each.
Eighteen U.S. states in total—including South Carolina, Alabama, and Utah to name a few—have no single incorporated area with 250,000 or more residents.
Cities, Towns, and Metro Areas
Like with all population data, definitions tend to play a big role in what is considered a city. In general parlance, built-up population centers are often thought of cities. However, an urban area can have a relatively big population and be incorporated as a town, as in the case of Gilbert, Arizona, which is included in the above map.
Separately, a collection of incorporated villages can be collectively referred to as a town, such as in the case of Hempstead, New York. Hempstead is an incorporated village with only 60,000 people, however it also lends its name to the wider town (an amalgamation of 22 villages and 38 hamlets) which has nearly 800,000 inhabitants. Three other New York towns listed below thus do not make the map for similar reasons.
| Town | State | Population |
|---|---|---|
| Hempstead | New York | 779,916 |
| Brookhaven | New York | 483,351 |
| Islip | New York | 333,322 |
| Oyster Bay | New York | 293,812 |
Source: World Population Review.
On the other hand, major hubs like Los Angeles often have a central city and surrounding suburbs, which are their own distinct incorporated cities as well. These are often counted as one major metropolitan region, but are still, technically separate cities. This leads to interesting results in the final count.
For example, in Arizona’s case, five of the six cities listed all belong to the greater Phoenix Metropolitan region.
Meanwhile, Nevada has two main population centers: Las Vegas and Reno. However two of Las Vegas’ suburbs, Henderson and North Las Vegas, are separately incorporated, and each have populations that crack the 250,000 mark.
Conversely, in South Carolina, there are no cities listed, despite having a state population of 5.3 million. The state’s urban areas are divided up in such a way that none of them (including the central cities of Charleston, Columbia, and Greenville) end up passing 250,000 in population.

-

 Maps7 days ago
Mapped: Southeast Asia’s GDP Per Capita, by Country
-

 Markets2 weeks ago
Visualizing Global Inflation Forecasts (2024-2026)
-

 United States2 weeks ago
Charted: What Southeast Asia Thinks About China & the U.S.
-

 United States2 weeks ago
The Evolution of U.S. Beer Logos
-

 Healthcare1 week ago
What Causes Preventable Child Deaths?
-

 Energy1 week ago
Who’s Building the Most Solar Energy?
-

 Markets1 week ago
Mapped: The Most Valuable Company in Each Southeast Asian Country
-

 Technology1 week ago
Mapped: The Number of AI Startups By Country