Misc
A Logarithmic Map of the Entire Observable Universe
Article/Editing:
For a full-size option or to inquire about posters, please visit Pablo Carlos Budassi’s website.
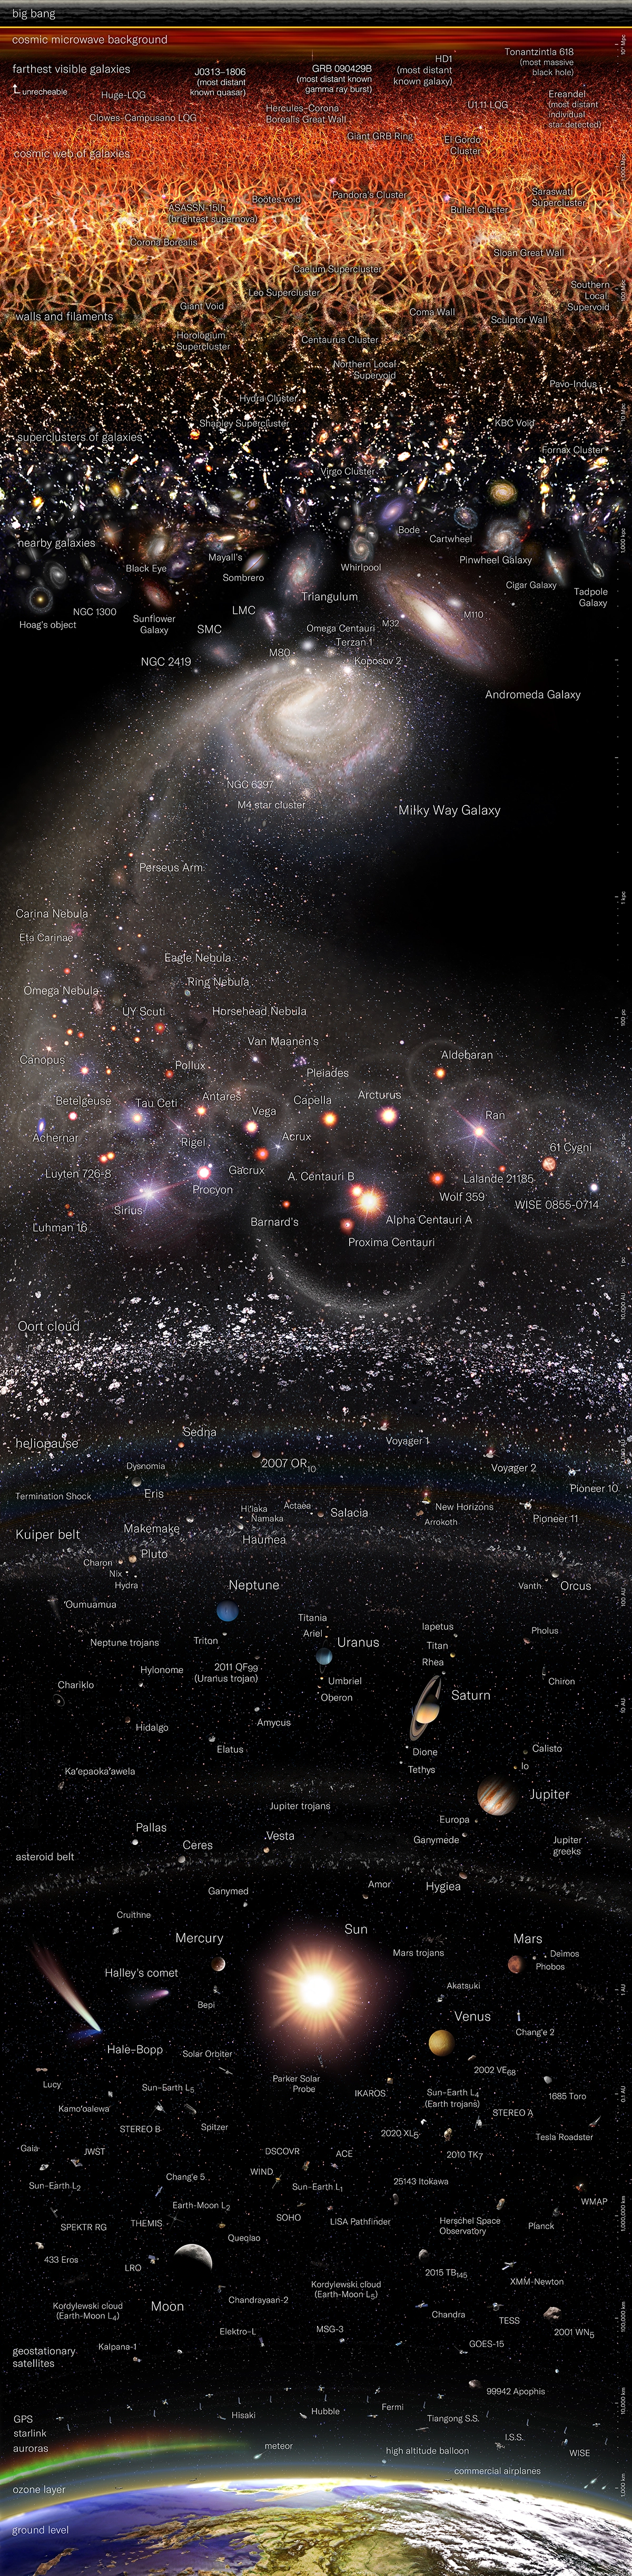
A Logarithmic Map of the Entire Observable Universe
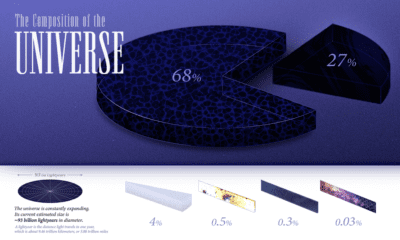
Among the scientific community, it’s widely believed that so far humans have only discovered about 5% of the universe.
Yet, despite knowing about just a fraction of what’s out there, we’ve still managed to discover galaxies billions of light-years away from Earth.
This graphic by Pablo Carlos Budassi provides a logarithmic map of the entire known universe, using data by researchers at Princeton University and updated as of May 2022.
How Does the Map Work?
Before diving in, it’s worth touching on a few key details about the map.
First off, it’s important to note that the celestial objects shown on this map are not shown to scale. If it was made to scale with sizes relative to how we see them from Earth, nearly all of the objects would be miniscule dots (except the Moon, the Sun, and some nebulae and galaxies).
Secondly, each object’s distance from the Earth is measured on a logarithmic scale, which increases exponentially, in order to fit in all the data.
Within our Solar System, the map’s scale spans astronomical units (AU), roughly the distance from the Earth to the Sun. Beyond, it grows to measure millions of parsecs, with each one of those equal to 3.26 light-years, or 206,000 AU.
Exploring the Map
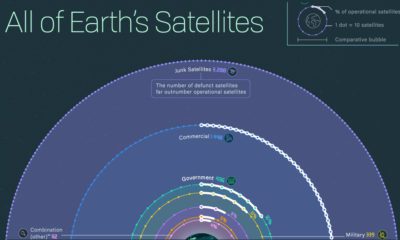
The map highlights a number of different celestial objects, including:
- The Solar System
- Comets and asteroids
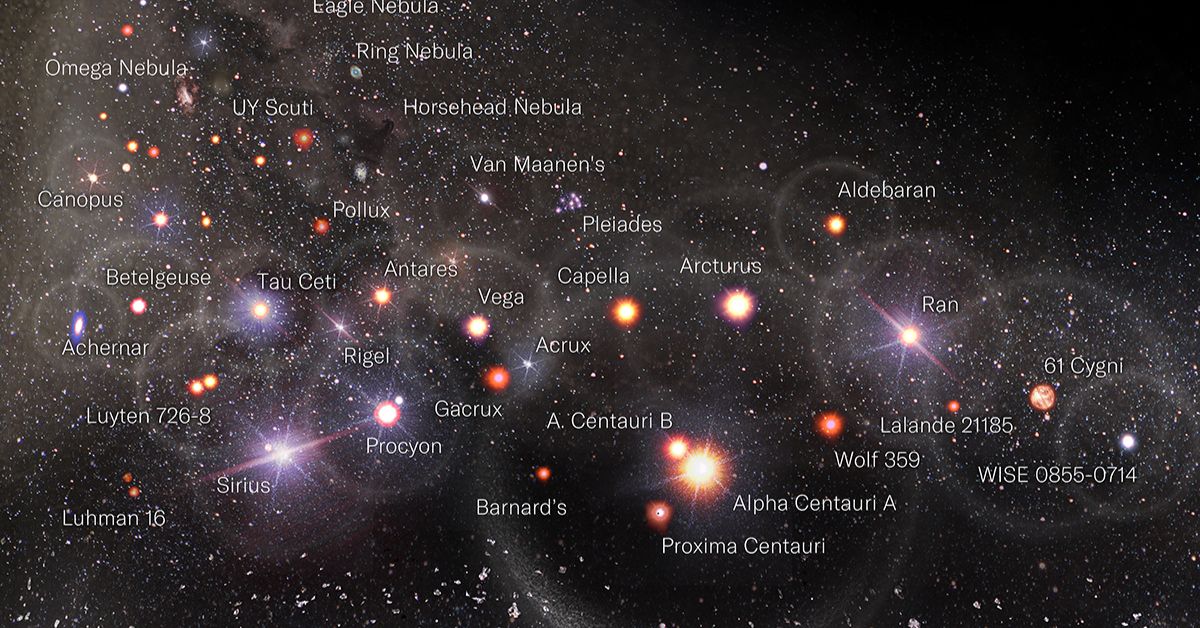
- Star systems and clusters
- Nebulae
- Galaxies, including the Milky Way
- Galaxy clusters
- Cosmic microwave background—radiation leftover from the Big Bang
Featured are some recently discovered objects, such as the most distant known galaxy to date, HD1. Scientists believe this newly-discovered galaxy was formed just 330 million years after the Big Bang, or roughly 8.4 billion years before Earth.
It also highlights some newly deployed spacecraft, including the James Webb Space Telescope (JWST), which is NASA’s latest infrared telescope, and the Tiangong Space Station, which was made by China and launched in April 2021.
Why is it called the “Observable” Universe?
Humanity has been interested in space for thousands of years, and many scientists and researchers have dedicated their lives to furthering our collective knowledge about space and the universe.
Most people are familiar with Albert Einstein and his theory of relativity, which became a cornerstone of both physics and astronomy. Another well-known scientist was Edwin Hubble, whose findings of galaxies moving away from Earth is considered to be the first observation of the universe expanding.
But the massive logarithmic map above, and any observations from Earth or probes in space, are limited in nature. The universe is currently dated to be around 13.8 billion years old, and nothing in the universe can travel faster than the speed of light.
When accounting for the expansion of the universe and observed objects moving away from us, that means that the farthest we can “see” is currently calculated at around 47.7 billion light-years. And since light takes time to travel, much of what we’re observing actually happened many millions of years ago.
But our understanding of the universe is evolving constantly with new discoveries. What will we discover next?

This article was published as a part of Visual Capitalist's Creator Program, which features data-driven visuals from some of our favorite Creators around the world.


Public Opinion
Charted: How Democrats and Republicans View Government Agencies
Predictably, results diverge when both Democrats and Republicans are asked to rate key government agencies in the United States.

How Democrats and Republicans View Government Agencies
This was originally posted on our Voronoi app. Download the app for free on iOS or Android and discover incredible data-driven charts from a variety of trusted sources.
Forget the presidential race, the partisan divide in America can also be seen by how Democrats and Republicans feel about key government agencies.
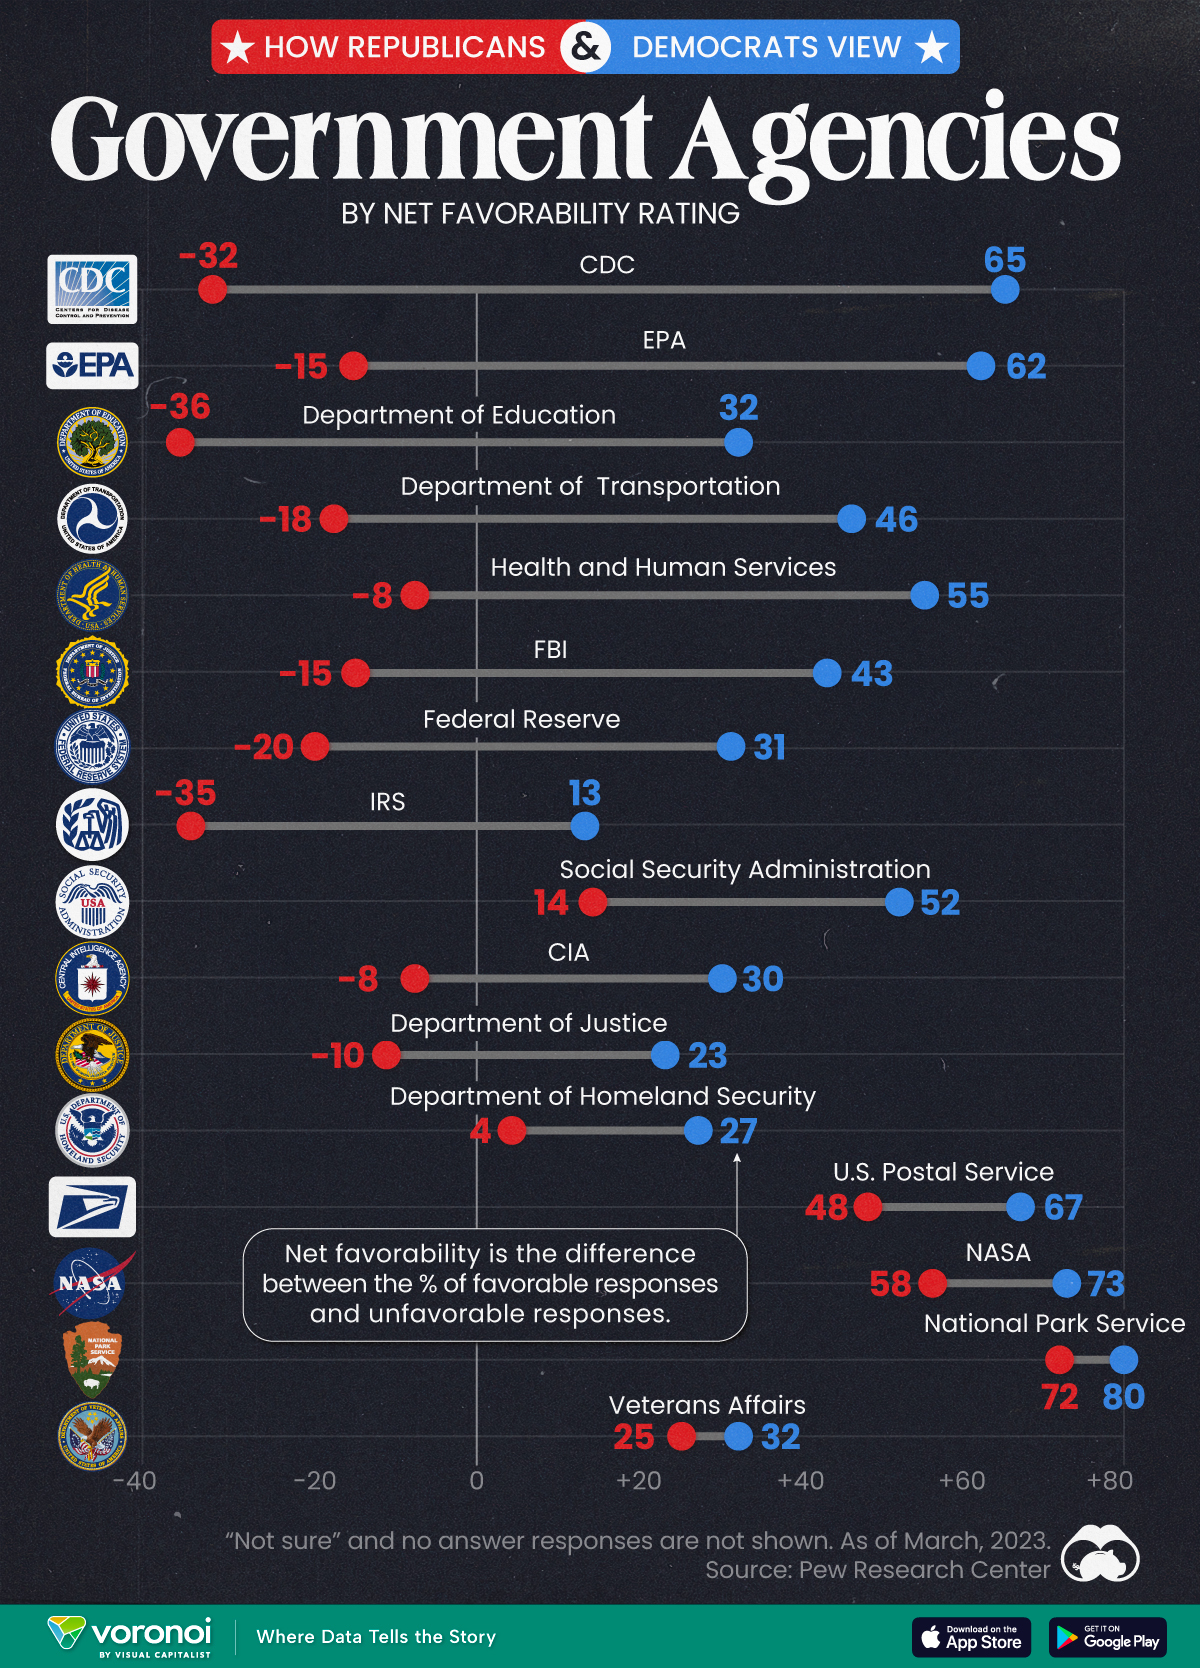
We visualize the net favorability ratings of 16 federal government agencies, based on respondent party affiliation.
To find this data, Pew Research Center surveyed more than 10,000 adults, between March 13-19, 2023. View their methodology page for more details about the survey, the questions asked, and the results obtained.
Republicans Don’t Like How the CDC Handled the Pandemic
The division in net favorability is deepest for three federal government agencies. While the CDC garnered a net favorability rating of 65 from Democrats, more Republicans rated the agency unfavorably, leading to a net favorability rating of -32.
Similarly, with the EPA and the Department of Education, the difference in net favorability between the two voting sides is as high as 70–80 points.
| Federal Agency | Republican Net Favorability Rating | Democrat Net Favorability Rating |
|---|---|---|
| 🔬 CDC | -32 | 65 |
| 🌿 EPA | -15 | 62 |
| 📚 Department of Education | -36 | 32 |
| 🚗 Department of Transportation | -18 | 46 |
| 💉 Health and Humans Services | -8 | 55 |
| 💰 Federal Reserve | -20 | 31 |
| 🕵️ FBI | -15 | 43 |
| 💼 IRS | -35 | 13 |
| 💼 Social Security Admin | 14 | 52 |
| 🕵️♂️ CIA | -8 | 30 |
| ⚖️ Justice Department | -10 | 23 |
| 🛡️ Homeland Security | 4 | 27 |
| 📮 USPS | 48 | 67 |
| 🚀 NASA | 58 | 73 |
| 🏞️ Park Service | 72 | 80 |
| 🎖️ Veterans Affairs | 25 | 32 |
Pew Research Center notes that Republicans didn’t always view the CDC quite so unfavorably, though a direct comparison is impossible.
Nevertheless, per the source, in March 2020, 84% of surveyed Republicans expressed positive views of the CDC’s performance. By October 2022, just 32% said the CDC had done an excellent or good job of handling the pandemic.
Meanwhile, there are a few agencies the two sides do agree on: the National Park Service, the Postal Service, and NASA.
And they both agree on Veterans Affairs as well: though neither share a particularly high opinion of the organization.
Finally, Democrats consistently rate all sixteen agencies on the survey more favorably than Republicans, showing consistency about how each side views the government in general.

-

 Maps7 days ago
Mapped: Southeast Asia’s GDP Per Capita, by Country
-

 Markets2 weeks ago
Visualizing Global Inflation Forecasts (2024-2026)
-

 United States2 weeks ago
Charted: What Southeast Asia Thinks About China & the U.S.
-

 United States2 weeks ago
The Evolution of U.S. Beer Logos
-

 Healthcare1 week ago
What Causes Preventable Child Deaths?
-

 Energy1 week ago
Who’s Building the Most Solar Energy?
-

 Markets1 week ago
Mapped: The Most Valuable Company in Each Southeast Asian Country
-

 Technology1 week ago
Mapped: The Number of AI Startups By Country