Maps
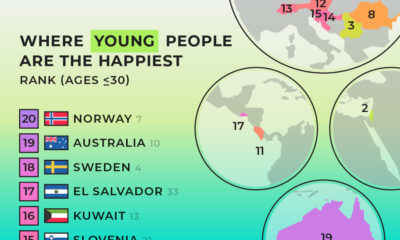
Mapped: Global Happiness Levels in 2022
Check out the latest update of the World Happiness Report.


Mapped: Global Happiness Levels in 2022
Check out the latest update of the World Happiness Report.
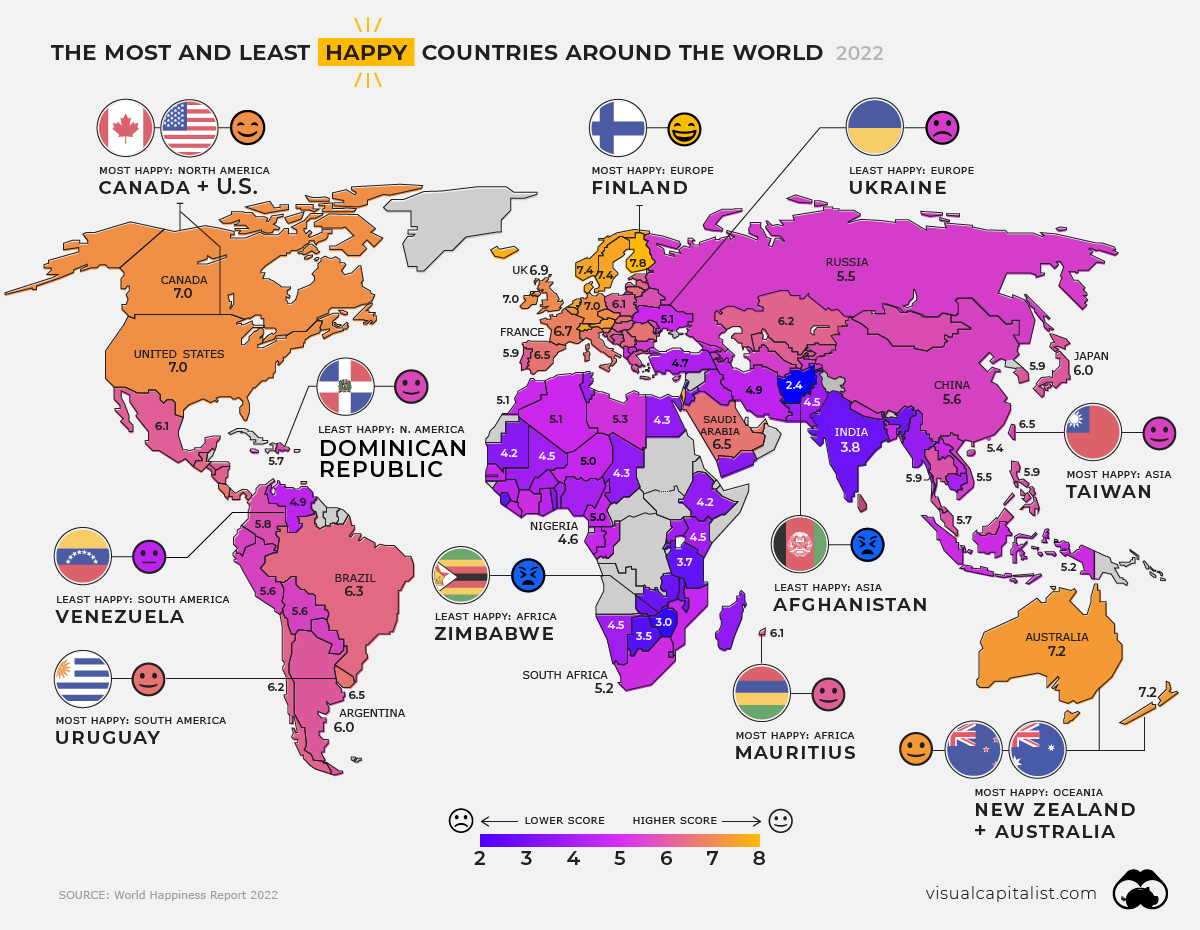
What really makes people happy? While countless academic researchers have tried to get to the bottom of this, the truth is, it’s a complicated question to answer.
Happiness levels depend on a number of factors, including one’s financial security, perceptions of social support, feelings of personal freedom, and much more.
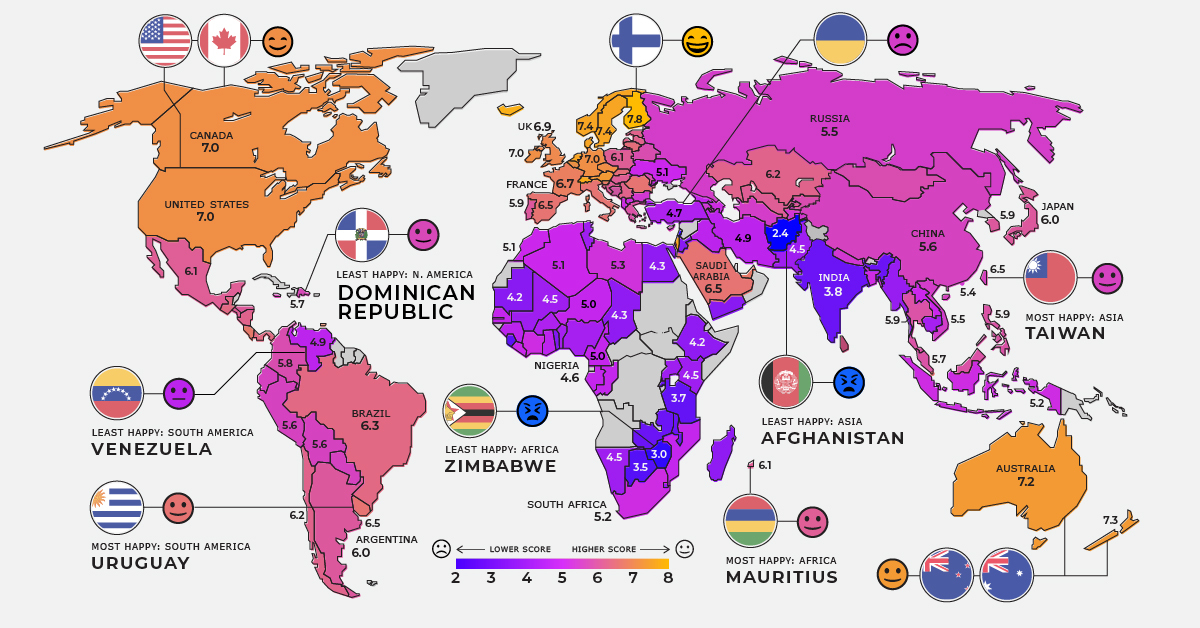
This map pulls data from the World Happiness Report to uncover the average happiness scores of 146 countries. It shows average scores from 2019 to 2021, and highlights which countries are the happiest—or unhappiest—and why.
How is Happiness Measured?
Before diving in, let’s briefly touch on how happiness levels are measured in this report.
The numbers shown represent the survey data from thousands of respondents for each country, who are asked to rate their subjective well-being (happiness score) using the Cantril life ladder question. For more information on the methodology of this and technical notes, go here.
The report also does a regression analysis to look at how happiness scores could be explained, by looking at tangible and intangible factors that could factor in:
- Social support
- Life expectancy
- Freedom to make life choices
- Generosity
- GDP per capita
- Perceptions of corruption
- Positive and negative affects
Similar to last year, the report takes special considerations to track how COVID-19 has impacted aspects of our daily lives, and how it’s affected global happiness levels.
Editor’s note: there are several countries covered in last year’s report that were not included in this year’s dataset, including Haiti, Maldives, and Burundi.
Zooming in: Regional Happiness Levels
Worldwide happiness comes in at an average score of 5.6, which is a slight improvement since last year’s report. Below, we dive into each region’s happiness levels.
North America
Current Mood: Happy (6.3)
Like last year, Canada ranks first as the happiest country in North America. However, it’s lost some ground on the global ranking, placing 15th this year compared to 14th the year prior. In contrast, the U.S. climbed three places in this year’s report and ranked just under Canada with a score of 6.97 (7.0 after rounding).
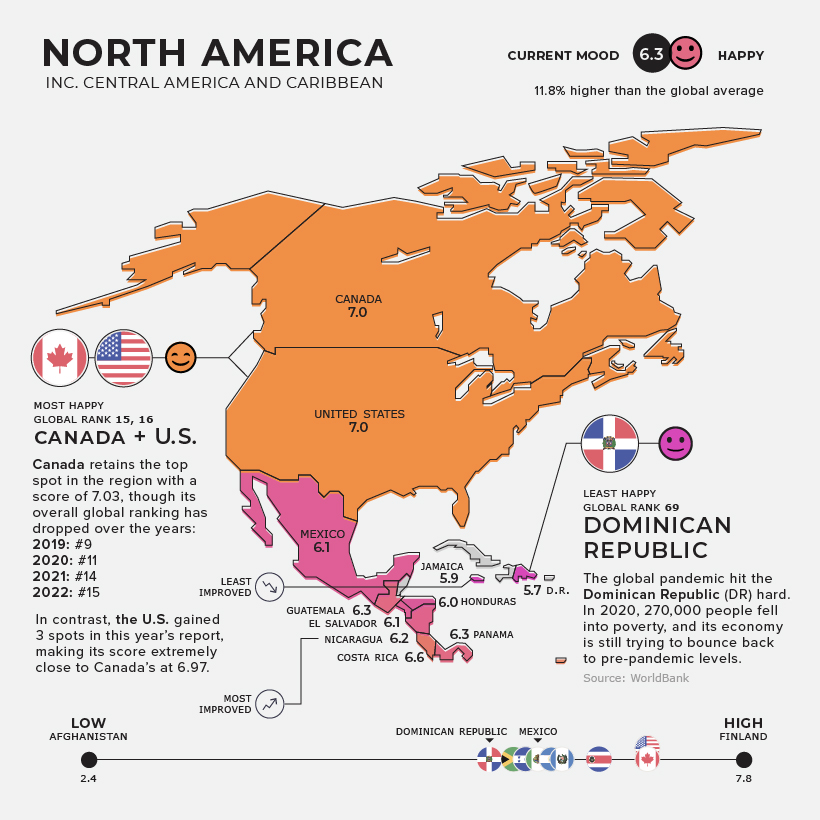
The Dominican Republic comes in last place in the region. While the Dominican Republic has experienced impressive economic growth over the last 25 years, the country was hit hard by the global pandemic—in 2020, approximately 270,000 people fell into poverty, and the economy is still struggling to reach its pre-pandemic levels.
South America
Current Mood: Content (5.8)
Uruguay retains its top spot as the happiest country in South America. It continues to rank high on the list because of its high income per capita, relatively low levels of poverty, and strong middle class.
While Uruguay was not immune to the impacts of COVID-19, the country was able to transition smoothly to online learning and was the first country in the region to reopen schools.
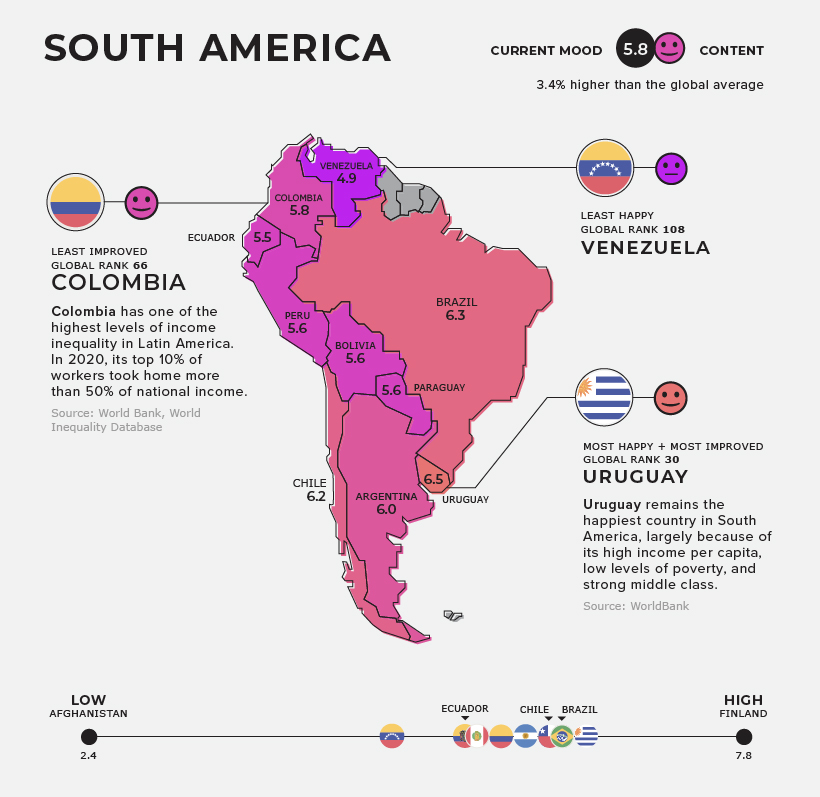
In last year’s World Happiness Report, Colombia was the most improved country in the region. But this year, it’s dropped 14 places on the global ranking, making it the least improved country in this year’s report.
While Colombia has made significant strides towards elevating extreme poverty in the last few decades, it still has one of the highest levels of income inequality in Latin America. In 2020, its top 10% of workers took home more than 50% of national income.
Europe
Current Mood: Happy (6.5)
Finland is not only the happiest country in Europe, but it also takes the top spot as the happiest country in the world, for the fifth year in a row. Finland is one of five Nordic countries to place in the top 10. Denmark comes in second place, followed by Iceland in third.
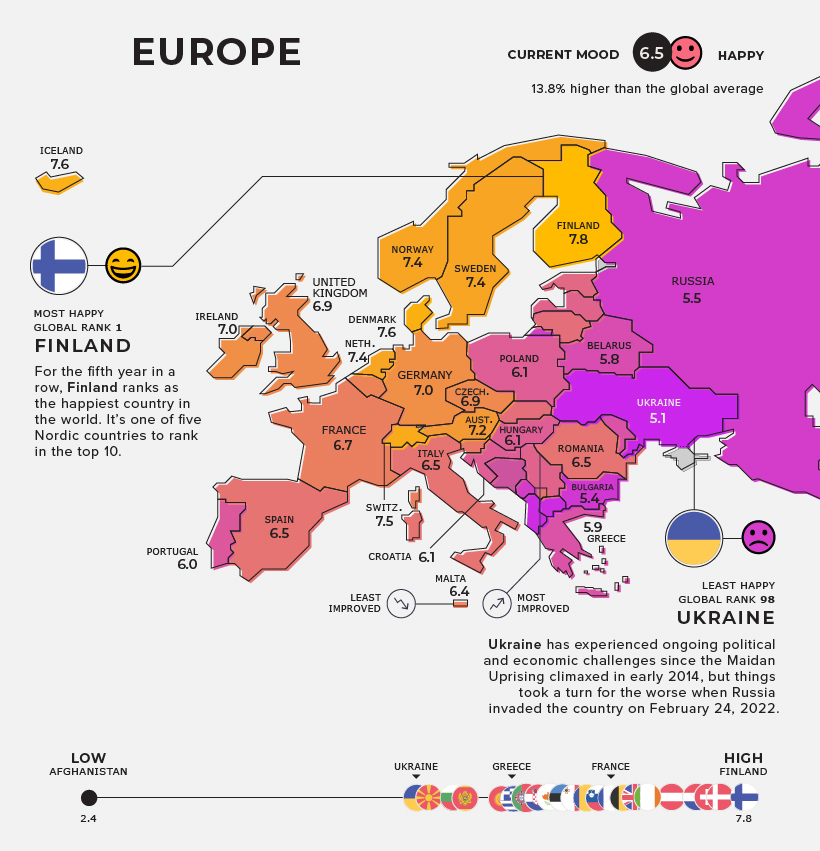
Romania was the most improved country in Europe, climbing 18 spots on the global ranking since last year’s report. Over the last decade, the country has seen some of the most significant economic growth in the European Union and was able to bounce back quickly from its COVID-19- triggered slump.
Ukraine ranks in last place, making it the unhappiest country in Europe. Ukraine has experienced ongoing challenges since the Maidan Uprising peaked in 2014. Events in the country have recently taken a turn for the worse, when Russia launched a full-scale invasion of Ukraine on February 24, 2022. As a result of the conflict, over 3 million people have fled the country.
Middle East and Central Asia
Current Mood: It’s Complicated (5.2)
Turkmenistan is the most improved country in the region, rising 19 places on the global ranking since last year’s report. The country’s boost could be explained by its rapid economic growth in recent years. In 2021, the country’s GDP grew by an estimated 6.3%.
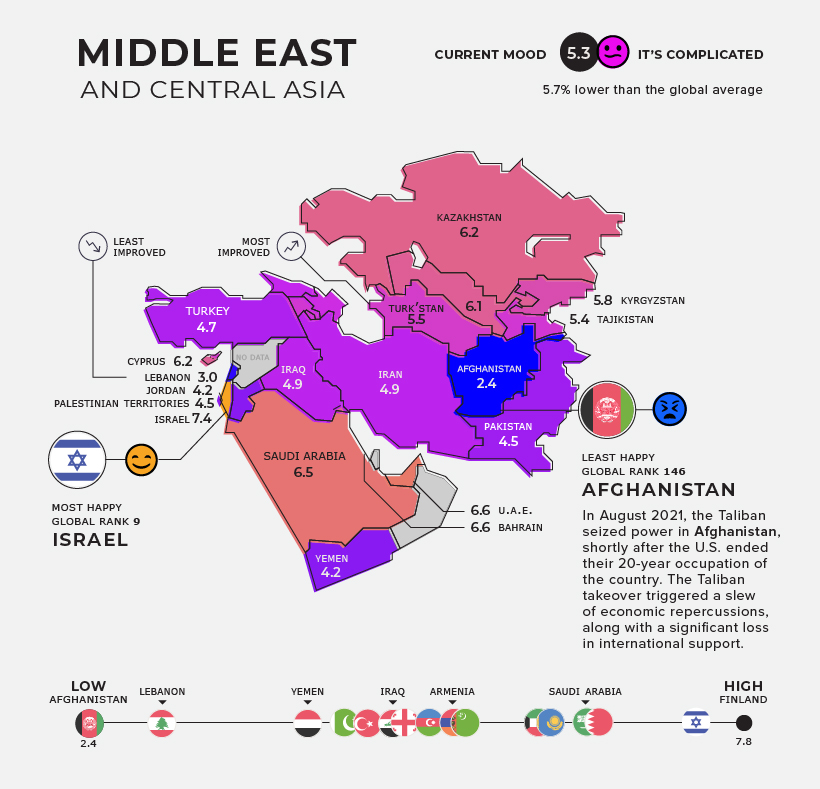
For the last two years, Lebanon has been dealing with a slew of crises. In 2020, COVID-19 spurred an economic crisis that’s been ranked as one of the top 10 most severe economic crises since the mid-nineteenth century. And on August 4th, 2020, a massive ammonium nitrate explosion left the country’s capital city, Beirut, in shambles.
East Asia and Oceania
Current Mood: Neutral (5.6)
Note: As the report only covers 146 countries, “Oceania” only refers to Australia and New Zealand in this instance.
In this year’s report, China climbed 12 places on the global ranking, making it the most improved country in East Asia and Oceania. The Chinese government recently identified “common prosperity” as a top priority, and has made numerous policy shifts in an effort to combat inequality and eradicate poverty.
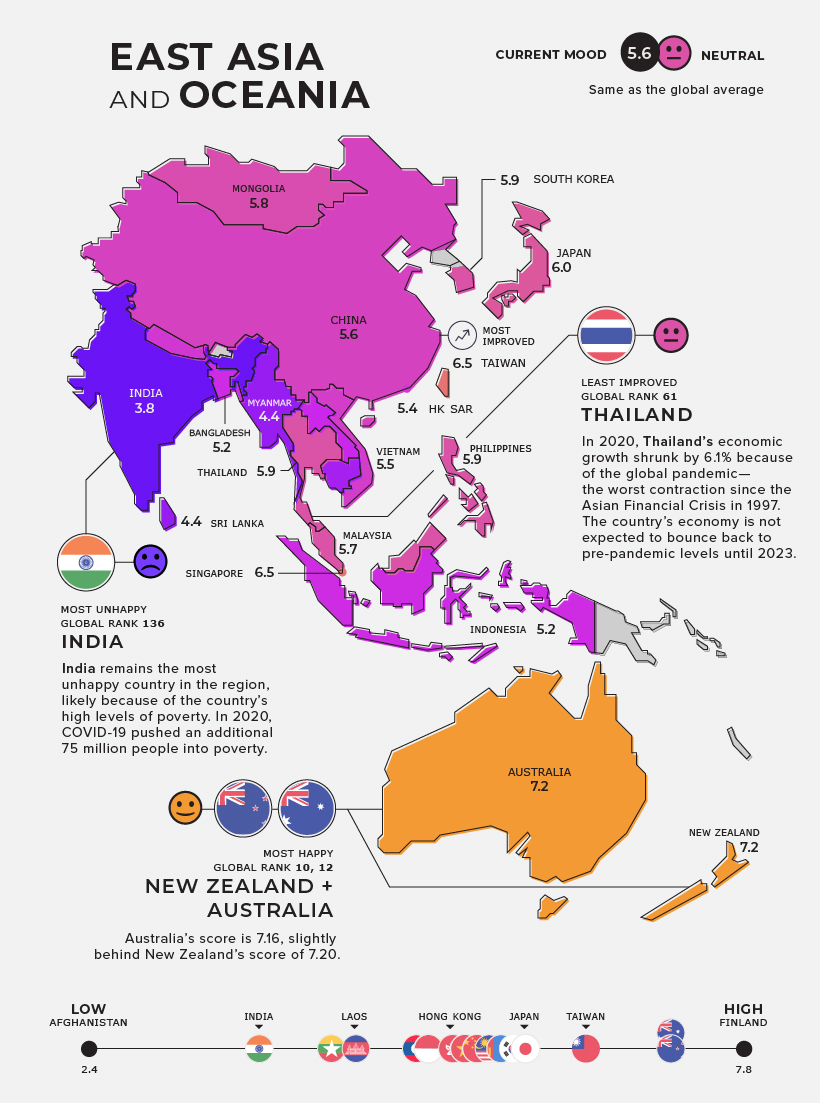
On the flipside, Thailand has improved the least in the region, likely because of the significant toll that COVID-19 had on the country’s economy. In 2020, economic growth shrunk by 6.1% in Thailand—the country’s worst contraction since the Asian Financial Crisis in 1997. Thailand’s economy is not expected to bounce back to pre-pandemic levels until 2023.
Africa
Current Mood: Unhappy (4.5)
With a regional score of 4.5, Africa ranks as the unhappiest region worldwide. Zimbabwe remains the most unhappy country in the region, as it continues to struggle with high levels of poverty. In 2021, approximately 6.1 million people were living below the international poverty line.
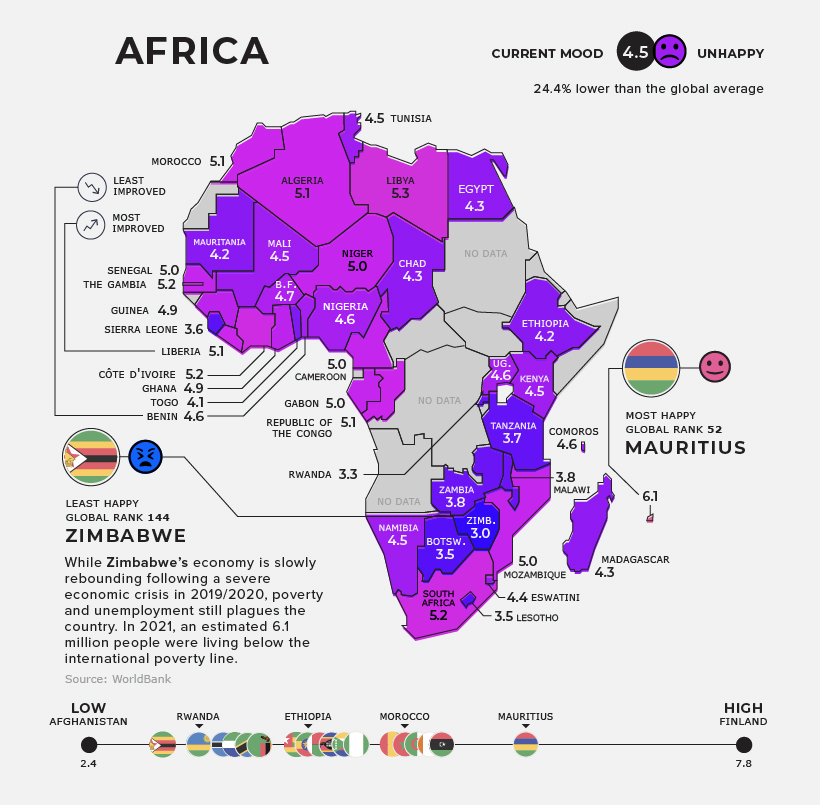
Mauritius remains the happiest country in the region, likely because of its relatively high levels of income. It’s worth noting that Mauritius became a High-Income country in July 2020, but slipped back to its Upper-Middle-Income status in 2021 because of the global pandemic.
We’re into our third year of dealing with the COVID-19 pandemic, and it’s clear that countries worldwide are still reeling from the pandemic’s devastating health, social, and economic impact. It’s unclear when things will fully return to normal—if ever. But on the bright side, countries are slowly showing signs of recovery.
Editor’s note: We’ve adjusted the “How is Happiness Measured” portion of this article to better reflect the methodology used in the World Happiness Report


United States
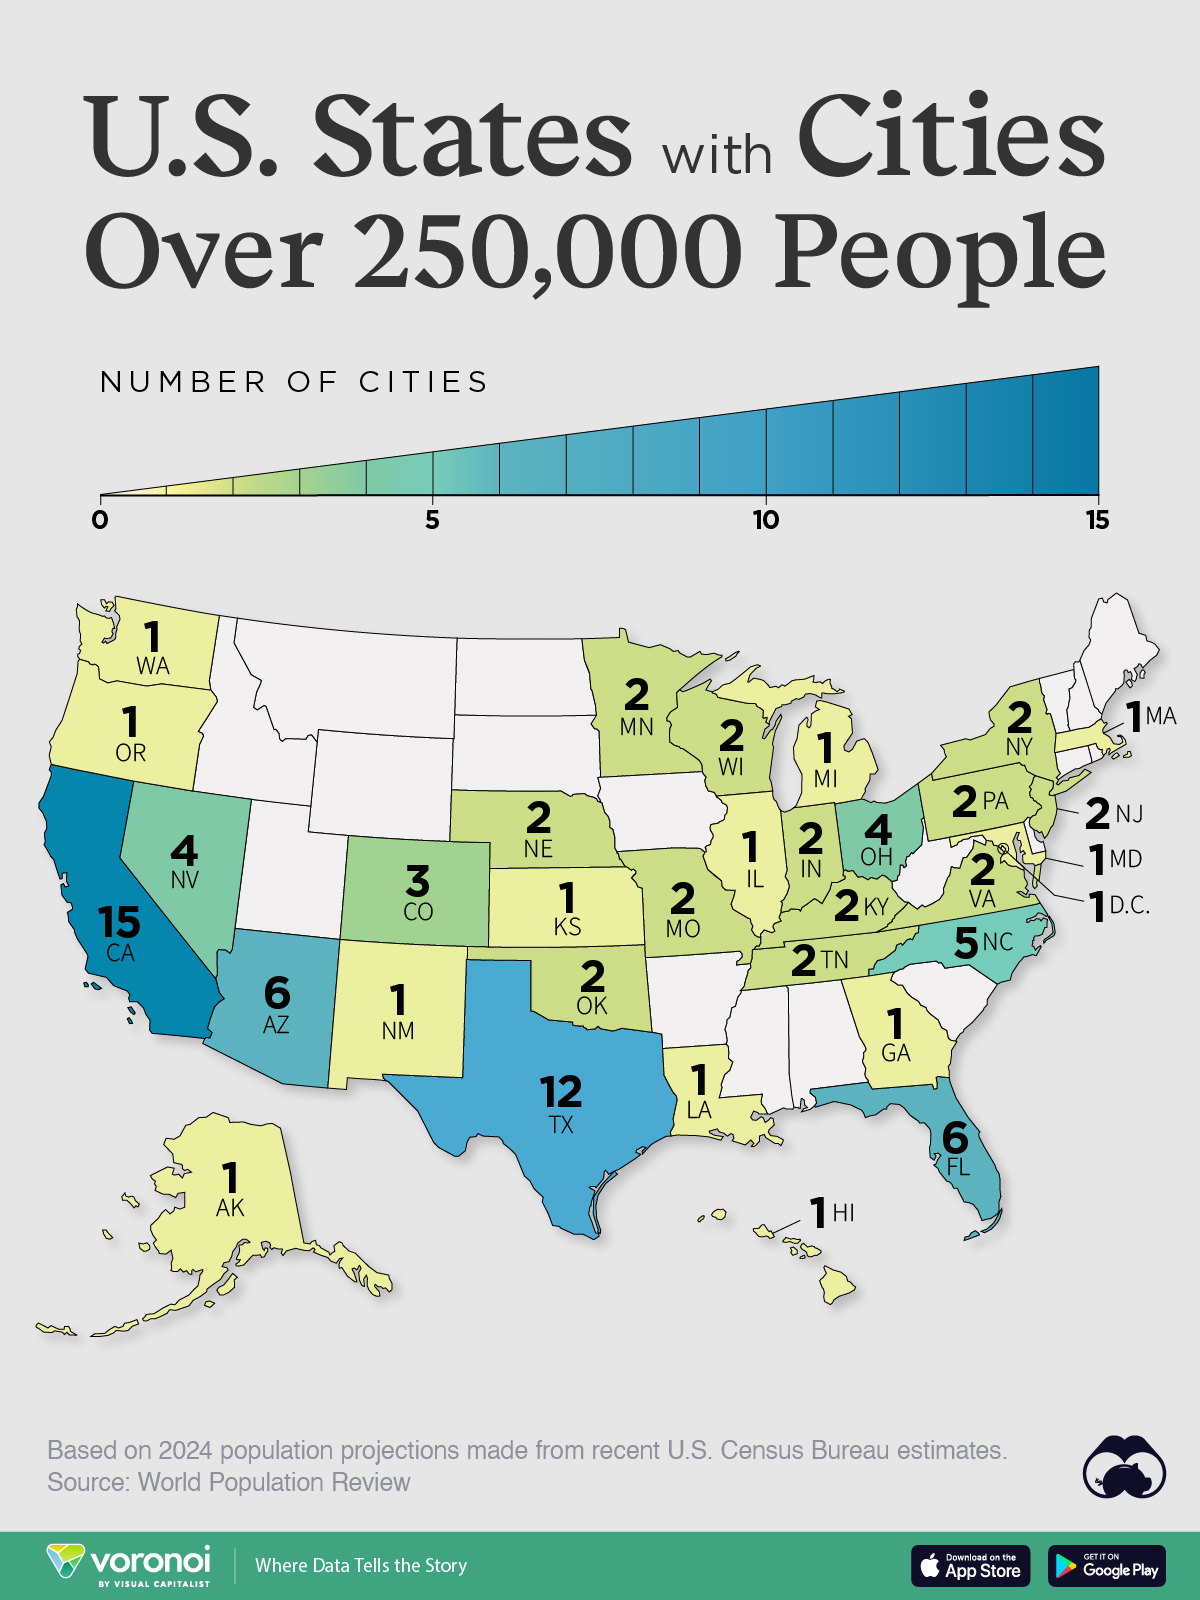
Mapped: U.S. States By Number of Cities Over 250,000 Residents
Eighteen U.S. States don’t have a single incorporated area with more than 250,000 people.
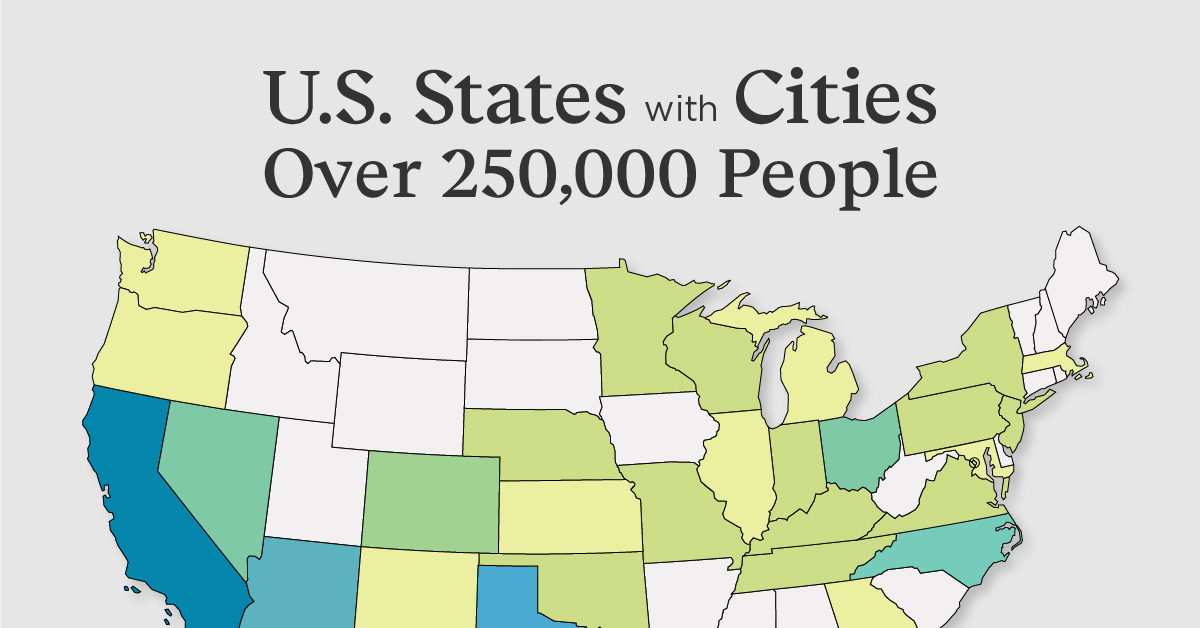
Mapped: U.S. States By Number of Cities Over 250K Residents
This was originally posted on our Voronoi app. Download the app for free on iOS or Android and discover incredible data-driven charts from a variety of trusted sources.
Over 80% of the American population lives in an “urban area” according to the U.S. Census Bureau. But where are all of the country’s largest cities, and what patterns can we see from their state locations?
This map shows U.S. states by their number of incorporated areas (i.e. cities or towns) that have more than 250,000 residents. Data for this map comes from 2024 estimates made by World Population Review, which were based on the latest U.S. Census Bureau figures.
Ranked: U.S. States By Number of Cities Over 250K Residents
California and Texas—also the most populous U.S. states—each have more than 10 cities with at least a quarter of a million inhabitants.
| State | Cities With 250K People | City Names |
|---|---|---|
| California | 15 | Los Angeles, San Diego, San Jose, San Francisco, Fresno, Sacramento, Long Beach, Oakland, Bakersfield, Anaheim, Riverside, Stockton, Irvine, Santa Ana, Chula Visa |
| Texas | 12 | Houston, San Antonio, Dallas, Fort Worth, Austin, El Paso, Arlington, Corpus Christi, Plano, Lubbock, Laredo, Irving |
| Arizona | 6 | Phoenix, Tucson, Mesa, Chandler, Gilbert, Glendale |
| Florida | 6 | Jacksonville, Miami, Tampa, Orlando, St. Petersburg, Port St. Lucie |
| North Carolina | 5 | Charlotte, Raleigh, Greensboro, Durham, Winston-Salem |
| Ohio | 4 | Columbus, Cleveland, Cincinnati, Toledo |
| Nevada | 4 | Las Vegas, Henderson, North Las Vegas, Reno |
| Colorado | 3 | Denver, Colorado Springs, Aurora |
| Tennessee | 2 | Nashville, Memphis |
| New York | 2 | New York, Buffalo |
| Pennsylvania | 2 | Philadelphia, Pittsburgh |
| Indiana | 2 | Indianapolis, Fort Wayne |
| Oklahoma | 2 | Oklahoma City, Tulsa |
| Kentucky | 2 | Louisville/Jefferson County, Lexington |
| Wisconsin | 2 | Milwaukee, Madison |
| Missouri | 2 | Kansas City, St. Louis |
| Nebraska | 2 | Omaha, Lincoln |
| Virginia | 2 | Virginia Beach, Chesapeake |
| Minnesota | 2 | Minneapolis, St. Paul |
| New Jersey | 2 | Newark, Jersey City |
| Illinois | 1 | Chicago |
| Washington | 1 | Seattle |
| District of Columbia | 1 | Washington D.C. |
| Massachusetts | 1 | Boston |
| Oregon | 1 | Portland |
| Michigan | 1 | Detroit |
| New Mexico | 1 | Albuquerque |
| Maryland | 1 | Baltimore |
| Georgia | 1 | Atlanta |
| Kansas | 1 | Wichita |
| Louisiana | 1 | New Orleans |
| Hawaii | 1 | Honolulu |
| Alaska | 1 | Anchorage |
Two other warm weather states, Arizona and Florida, also have a number of cities with 250,000 or more residents, at six each.
Eighteen U.S. states in total—including South Carolina, Alabama, and Utah to name a few—have no single incorporated area with 250,000 or more residents.
Cities, Towns, and Metro Areas
Like with all population data, definitions tend to play a big role in what is considered a city. In general parlance, built-up population centers are often thought of cities. However, an urban area can have a relatively big population and be incorporated as a town, as in the case of Gilbert, Arizona, which is included in the above map.
Separately, a collection of incorporated villages can be collectively referred to as a town, such as in the case of Hempstead, New York. Hempstead is an incorporated village with only 60,000 people, however it also lends its name to the wider town (an amalgamation of 22 villages and 38 hamlets) which has nearly 800,000 inhabitants. Three other New York towns listed below thus do not make the map for similar reasons.
| Town | State | Population |
|---|---|---|
| Hempstead | New York | 779,916 |
| Brookhaven | New York | 483,351 |
| Islip | New York | 333,322 |
| Oyster Bay | New York | 293,812 |
Source: World Population Review.
On the other hand, major hubs like Los Angeles often have a central city and surrounding suburbs, which are their own distinct incorporated cities as well. These are often counted as one major metropolitan region, but are still, technically separate cities. This leads to interesting results in the final count.
For example, in Arizona’s case, five of the six cities listed all belong to the greater Phoenix Metropolitan region.
Meanwhile, Nevada has two main population centers: Las Vegas and Reno. However two of Las Vegas’ suburbs, Henderson and North Las Vegas, are separately incorporated, and each have populations that crack the 250,000 mark.
Conversely, in South Carolina, there are no cities listed, despite having a state population of 5.3 million. The state’s urban areas are divided up in such a way that none of them (including the central cities of Charleston, Columbia, and Greenville) end up passing 250,000 in population.

-

 Maps7 days ago
Mapped: Southeast Asia’s GDP Per Capita, by Country
-

 Markets2 weeks ago
Visualizing Global Inflation Forecasts (2024-2026)
-

 United States2 weeks ago
Charted: What Southeast Asia Thinks About China & the U.S.
-

 United States2 weeks ago
The Evolution of U.S. Beer Logos
-

 Healthcare1 week ago
What Causes Preventable Child Deaths?
-

 Energy1 week ago
Who’s Building the Most Solar Energy?
-

 Markets1 week ago
Mapped: The Most Valuable Company in Each Southeast Asian Country
-

 Technology1 week ago
Mapped: The Number of AI Startups By Country