

Misc
Mapped: Countries With the Highest Flood Risk


Risk of Flooding Mapped Around the World
Devastating floods across Pakistan this summer have resulted in more than 1,400 lives lost and one-third of the country being under water.
This raises the question: which nations and their populations are the most vulnerable to the risk of flooding around the world?
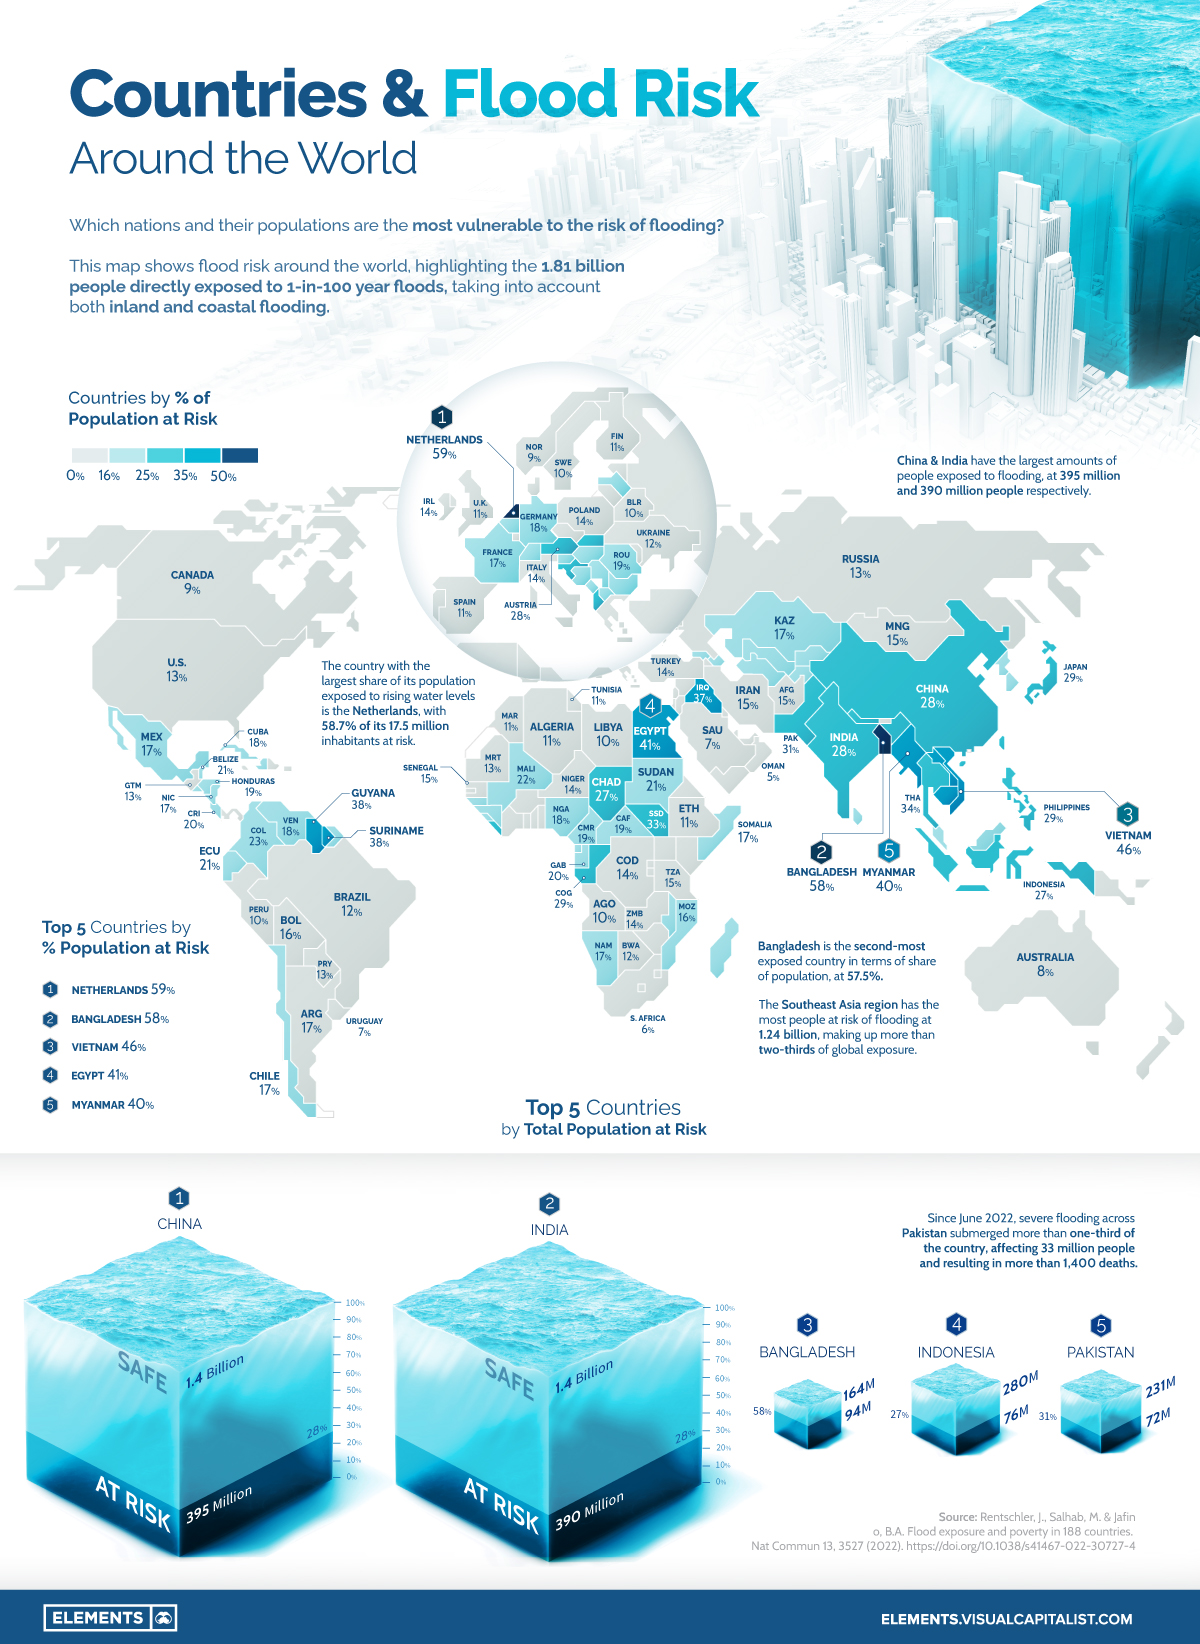
Using data from a recent study published in Nature, this graphic maps flood risk around the world, highlighting the 1.81 billion people directly exposed to 1-in-100 year floods. The methodology takes into account potential risks from both inland and coastal flooding.
Asian Countries Most at Risk from Rising Water Levels
Not surprisingly, countries with considerable coastlines, river systems, and flatlands find themselves with high percentages of their population at risk.
The Netherlands and Bangladesh are the only two nations in the world to have more than half of their population at risk due to flooding, at 59% and 58%, respectively. Vietnam (46%), Egypt (41%), and Myanmar (40%) round out the rest of the top five nations.
Besides the Netherlands, only two other European nations are in the top 20 nations by percentage of population at risk, Austria (18th at 29%) and Albania (20th at 28%).
| Rank | Country | Flood risk, by population exposed (%) | Total population exposed |
|---|---|---|---|
| #1 | 🇳🇱 Netherlands | 58.7% | 10,100,000 |
| #2 | 🇧🇩 Bangladesh | 57.5% | 94,424,000 |
| #3 | 🇻🇳 Vietnam | 46.0% | 45,504,000 |
| #4 | 🇪🇬 Egypt | 40.5% | 38,871,000 |
| #5 | 🇲🇲 Myanmar | 39.9% | 19,104,000 |
| #6 | 🇱🇦 Laos | 39.7% | 2,985,000 |
| #7 | 🇰🇭 Cambodia | 38.1% | 7,431,000 |
| #8 | 🇬🇾 Guyana | 37.9% | 276,000 |
| #9 | 🇸🇷 Suriname | 37.7% | 233,000 |
| #10 | 🇮🇶 Iraq | 36.8% | 16,350,000 |
| #11 | 🇹🇭 Thailand | 33.9% | 25,431,000 |
| #12 | 🇸🇸 South Sudan | 32.5% | 5,437,000 |
| #13 | 🇵🇰 Pakistan | 31.1% | 71,786,000 |
| #14 | 🇳🇵 Nepal | 29.4% | 11,993,000 |
| #15 | 🇨🇬 Republic of the Congo | 29.3% | 1,170,000 |
| #16 | 🇵🇭 Philippines | 29.0% | 30,483,000 |
| #17 | 🇯🇵 Japan | 28.7% | 36,060,000 |
| #18 | 🇦🇹 Austria | 27.8% | 2,437,000 |
| #19 | 🇮🇳 India | 27.7% | 389,816,000 |
| #20 | 🇦🇱 Albania | 27.6% | 771,000 |
| #21 | 🇨🇳 China | 27.5% | 394,826,000 |
| #22 | 🇹🇩 Chad | 27.4% | 4,547,000 |
| #23 | 🇮🇩 Indonesia | 27.0% | 75,696,000 |
| #24 | 🇭🇷 Croatia | 26.9% | 1,094,000 |
| #25 | 🇸🇰 Slovakia | 26.7% | 1,401,000 |
The Southeast Asia region alone makes up more than two-thirds of the global population exposed to flooding risk at 1.24 billion people.
China and India account for 395 million and 390 million people, respectively, with both nations at the top in terms of the absolute number of people at risk of rising water levels. The rest of the top five countries by total population at risk are Bangladesh (94 million people at risk), Indonesia (76 million people at risk), and Pakistan (72 million people at risk).
How Flooding is Already Affecting Countries Like Pakistan
While forecasted climate and natural disasters can often take years to manifest, flooding affected more than 100 million people in 2021. Recent summer floods in Pakistan have continued the trend in 2022.
With 31% of its population (72 million people) at risk of flooding, Pakistan is particularly vulnerable to floods.
In 2010, floods in Pakistan were estimated to have affected more than 18 million people. The recent floods, which started in June, are estimated to have affected more than 33 million people as more than one-third of the country is submerged underwater.
The Cost of Floods Today and in the Future
Although the rising human toll is by far the biggest concern that floods present, they also bring with them massive economic costs. Last year, droughts, floods, and storms caused economic losses totaling $224.2 billion worldwide, nearly doubling the 2001-2020 annual average of $117.8 billion.
A recent report forecasted that water risk (caused by droughts, floods, and storms) could eat up $5.6 trillion of global GDP by 2050, with floods projected to account for 36% of these direct losses.
As both human and economic losses caused by floods continue to mount, nations around the world will need to focus on preventative infrastructure and restorative solutions for ecosystems and communities already affected and most at risk of flooding.


Misc
Visualizing Global Aluminum Production
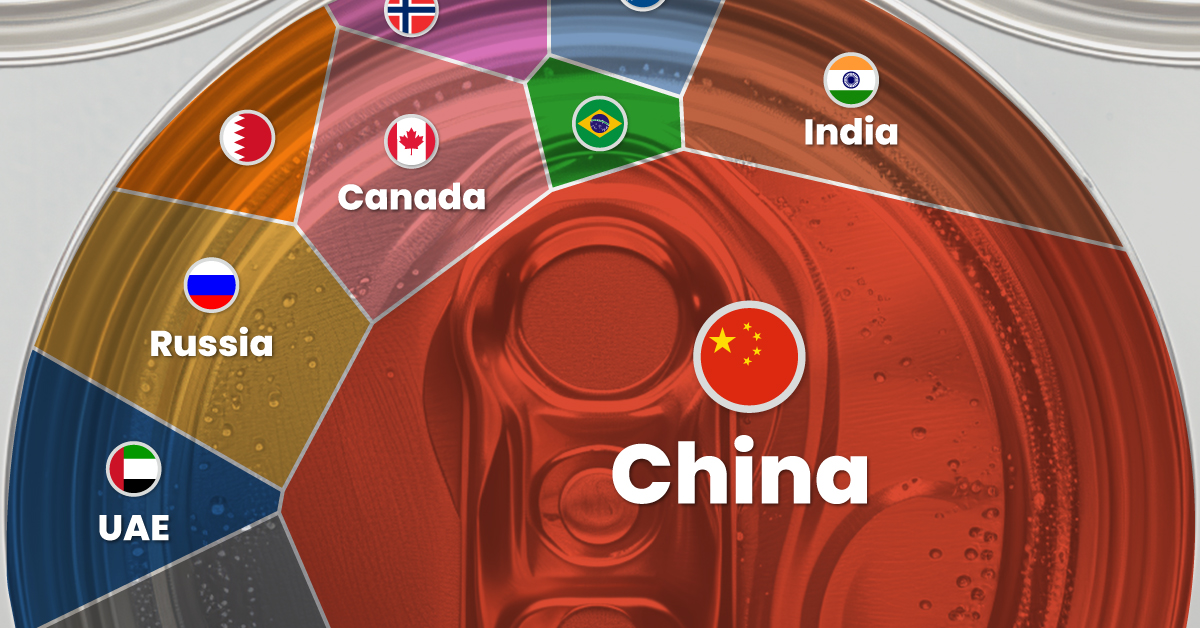
China dominates global production with nearly 60% share.
Visualizing Global Aluminum Production
This was originally posted on our Voronoi app. Download the app for free on iOS or Android and discover incredible data-driven charts from a variety of trusted sources.
This infographic shows estimated aluminum smelter production by country in 2023, based on data from the most recent U.S. Geological Survey (USGS) Mineral Commodity Summaries, published in January 2024 .
From this data, we can see that China leads as the top producer, accounting for nearly 60% of the world’s smelter capacity. Its neighbor India is the second-largest producer, making only a tenth of China’s output.
| Country | 2023 Aluminum Smelter Production (tonnes) | % of total |
|---|---|---|
| 🇨🇳 China | 41,000,000 | 59% |
| 🇮🇳 India | 4,100,000 | 6% |
| 🇷🇺 Russia | 3,800,000 | 5% |
| 🇨🇦 Canada | 3,000,000 | 4% |
| 🇦🇪 United Arab Emirates | 2,700,000 | 4% |
| 🇧🇭 Bahrain | 1,600,000 | 2% |
| 🇦🇺 Australia | 1,500,000 | 2% |
| 🇳🇴 Norway | 1,300,000 | 2% |
| 🇧🇷 Brazil | 1,100,000 | 2% |
| 🌍 Rest of the World | 9,460,000 | 14% |
| Total | 69,560,000 | 100% |
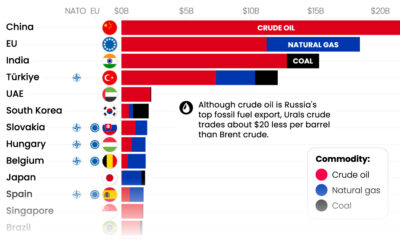
Responsible for 5% of global aluminum output, Russia has been targeted by recent sanctions from the U.S. and the UK.
The sanctions include prohibiting metal-trading exchanges from accepting new aluminum produced by Russia and barring the import of the Russian metal into the U.S. and Britain. The actions are aimed at disrupting Russian export revenue amid Moscow’s ongoing invasion of Ukraine.
The World’s Most Common Metal
Aluminum is the primary material used for making cans, foil, and many other products. It originates from bauxites, rocks composed of aluminum oxides, and various minerals.
Approximately 25% of annually produced aluminum is utilized by the construction industry, while another 23% is allocated to vehicle frames, wires, wheels, and other components within the transportation sector. Aluminum foil, cans, and packaging constitute another significant end-use category, accounting for 17% of consumption.
Despite its extensive use, aluminum is still plentiful. Aluminum is the world’s most common metal by crustal abundance, making up 8.2% of the Earth’s crust.
According to the USGS, global resources of bauxite are estimated to be between 55 billion and 75 billion tonnes and are sufficient to meet world demand for metal well into the future.
Misc
Brass Rods: The Sustainable Choice
Brass rods can help cut emissions in machine shops, be recycled without losing properties, and contribute to a cleaner environment.

Brass Rods: The Sustainable Choice
Brass rods have a powerful lineup of green attributes, making them the sustainable choice for manufacturers and end-users of precision machined and forged parts.
This infographic, from the Copper Development Association, shows how brass rods can reduce emissions in machine shops, be recycled without losing properties, and contribute to a cleaner environment.
The Brass Rod Circular Economy
The metallurgical properties of brass allow pre- and post-consumer sources of brass scrap to be recycled with no loss in properties.
Brass scrap can retain over 90% of the original material value. In addition, brass doesn’t need energy-intensive processing, unlike steel and aluminum, which must be smelted and refined before being recycled into new products.
As a result, there is a greater chance that steel and aluminum scrap will end up in landfills.
Most brass-rod alloys produced in North America contain 95% or higher recycled content.
Closed-loop recycling of brass keeps this valuable engineering material out of landfills, reducing the need for new mines and all the environmental impacts that entails.
Higher Machinability Leads to Lower Operational Carbon Emissions
Machinability is how easily a material can be worked using cutting processes. It directly impacts the amount of energy required to produce finished parts.
With typical machine shops producing millions of parts each year, the carbon impact can be significant.
Here’s how brass and steel compare when manufacturing complex parts using computer numerical control (CNC) machining.
| Material | Brass | Steel |
|---|---|---|
| Type | Free-cutting brass (C36000) | Free-cutting steel (12L14) |
| Maximum machinability rating (0-100) | 100 | 21 |
| Metal Removal Rate (cubic inches per minute) | 0.238 | 0.114 |
| Time to remove material (hours) | 161,111 | 336,111 |
| Energy required to produce parts (kilowatt-hour) | 9,475 | 18,931 |
In this example, using brass represented a savings of 3,510 kg in carbon dioxide (CO2).
The significantly longer tool life enabled by brass also reduces the need for new cutting tools, further decreasing emissions.
High recycled content and exceptional machinability make brass rods the sustainable choice for manufacturers and end-users seeking to reduce their environmental footprint and support the transition to a low-carbon future.
Explore the advantages of brass rod solutions.

-

 Electrification3 years ago
Ranked: The Top 10 EV Battery Manufacturers
-

 Electrification2 years ago
The Key Minerals in an EV Battery
-

 Real Assets3 years ago
The World’s Top 10 Gold Mining Companies
-

 Electrification2 years ago
Mapped: Solar Power by Country in 2021
-

 Misc3 years ago
All the Metals We Mined in One Visualization
-

 Energy Shift2 years ago
What Are the Five Major Types of Renewable Energy?
-

 Electrification2 years ago
The World’s Largest Nickel Mining Companies
-

 Misc3 years ago
The Largest Copper Mines in the World by Capacity