

Misc
Mapped: The 3 Billion People Who Can’t Afford a Healthy Diet
VC+ members get access to our World at 8 Billion Report.
Gain access to this exclusive new report and webinar by becoming a VC+ member.
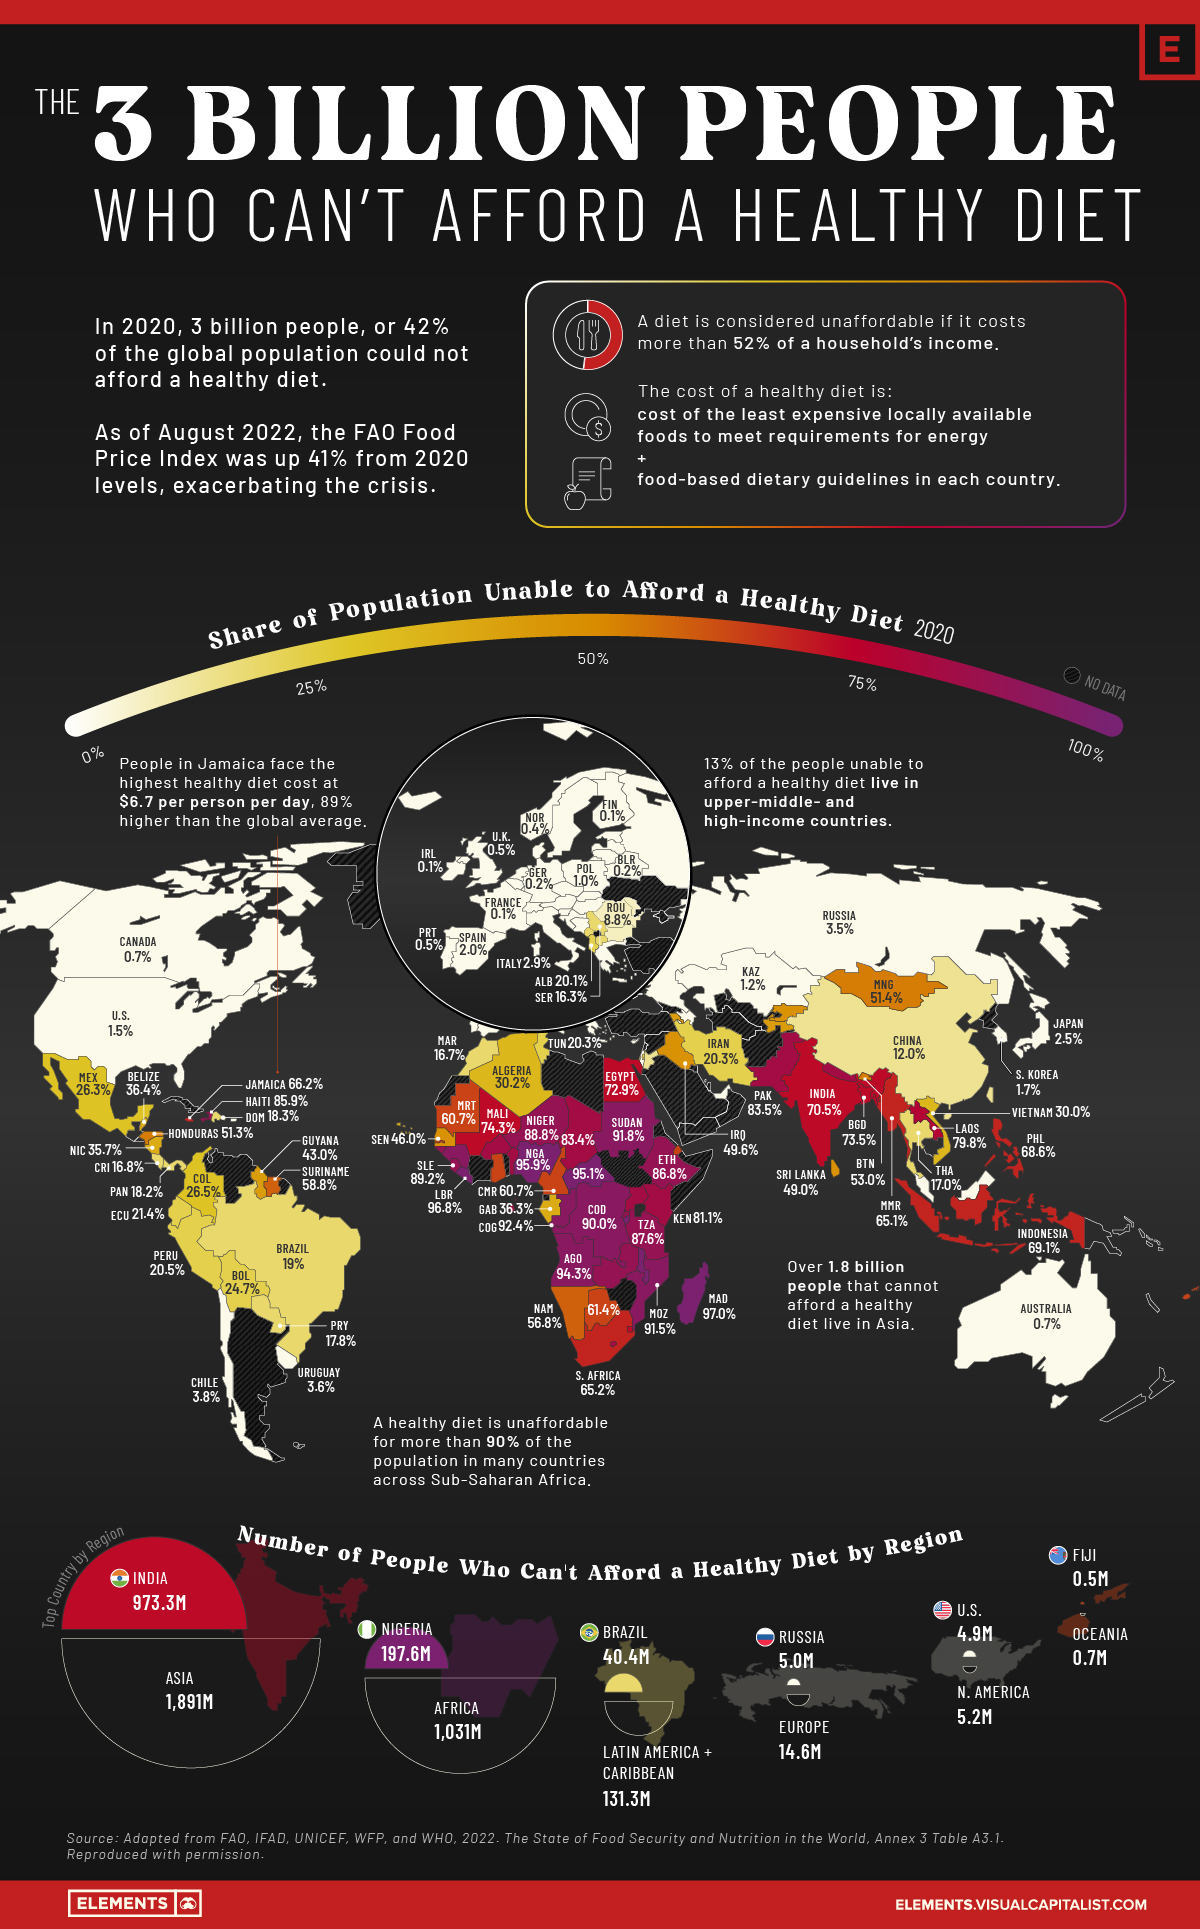
The 3 Billion People Who Can’t Afford a Healthy Diet
While they aren’t often the focus of news media, hunger and undernourishment are problems plaguing millions of people every day.
According to the UN Food and Agriculture Organization (FAO), more than 3 billion people could not afford a healthy diet in 2020, an additional 112 million more people than in 2019. The increase was partly because of rising food prices, with the average cost of a healthy diet rising by 3.3% from 2019 levels.
As of August 2022, the FAO food price index was up 40.6% from average 2020 levels. Unless income levels increased by a similar magnitude, the healthy diet crisis is likely to have worsened, especially in low-income countries experiencing rampant food inflation.
Using data from the FAO, the above infographic maps the share of people unable to afford a healthy diet in 138 different countries as of 2020 (latest available data).
The Cost and Affordability of a Healthy Diet
According to the FAO, a healthy diet is one that meets daily energy needs as well as requirements within the food and dietary guidelines created by the country.
The (un)affordability is measured by comparing the cost of a healthy diet to income levels in the country. If the cost exceeds 52% of an average household’s income, the diet is deemed unaffordable.
Here’s a look at the share of populations unable to afford a healthy diet, and the cost of such a diet around the world:
| Country | Percent of population unable to afford a healthy diet | Cost of Healthy Diet (USD per Person per Day) |
|---|---|---|
| Burundi 🇧🇮 | 97.2% | $2.9 |
| Madagascar 🇲🇬 | 97.0% | $3.2 |
| Liberia 🇱🇷 | 96.8% | $3.9 |
| Malawi 🇲🇼 | 96.6% | $3.1 |
| Nigeria 🇳🇬 | 95.9% | $4.1 |
| Central African Republic 🇨🇫 | 95.1% | $3.6 |
| Guinea 🇬🇳 | 94.9% | $4.1 |
| Angola 🇦🇴 | 94.3% | $4.5 |
| Congo 🇨🇬 | 92.4% | $3.4 |
| Sudan 🇸🇩 | 91.8% | $4.3 |
| Mozambique 🇲🇿 | 91.5% | $3.2 |
| Democratic Republic of Congo 🇨🇩 | 90.0% | $2.1 |
| Sierra Leone 🇸🇱 | 89.2% | $2.9 |
| Niger 🇳🇪 | 88.8% | $2.9 |
| Zambia 🇿🇲 | 88.0% | $3.3 |
| Tanzania 🇹🇿 | 87.6% | $2.7 |
| Guinea-Bissau 🇬🇼 | 87.2% | $3.5 |
| Ethiopia 🇪🇹 | 86.8% | $3.4 |
| Rwanda 🇷🇼 | 86.3% | $2.7 |
| Haiti 🇭🇹 | 85.9% | $4.5 |
| Sao Tome and Principe 🇸🇹 | 84.7% | $3.6 |
| Nepal 🇳🇵 | 84.0% | $4.4 |
| Lesotho 🇱🇸 | 83.5% | $4.3 |
| Pakistan 🇵🇰 | 83.5% | $3.7 |
| Chad 🇹🇩 | 83.4% | $2.8 |
| Benin 🇧🇯 | 82.9% | $3.7 |
| Uganda 🇺🇬 | 82.2% | $2.7 |
| Kenya 🇰🇪 | 81.1% | $3.0 |
| Burkina Faso 🇧🇫 | 80.1% | $3.3 |
| Laos 🇱🇦 | 79.8% | $4.1 |
| Mali 🇲🇱 | 74.3% | $3.1 |
| Bangladesh 🇧🇩 | 73.5% | $3.1 |
| Egypt 🇪🇬 | 72.9% | $3.4 |
| Eswatini 🇸🇿 | 71.8% | $3.4 |
| India 🇮🇳 | 70.5% | $3.0 |
| Indonesia 🇮🇩 | 69.1% | $4.5 |
| Philippines 🇵🇭 | 68.6% | $4.1 |
| Jamaica 🇯🇲 | 66.2% | $6.7 |
| South Africa 🇿🇦 | 65.2% | $4.3 |
| Myanmar 🇲🇲 | 65.1% | $4.2 |
| Gambia 🇬🇲 | 64.0% | $3.1 |
| Djibouti 🇩🇯 | 63.9% | $3.1 |
| Botswana 🇧🇼 | 61.4% | $3.7 |
| Ghana 🇬🇭 | 61.2% | $4.0 |
| Cameroon 🇨🇲 | 60.7% | $2.8 |
| Mauritania 🇲🇷 | 60.7% | $3.7 |
| Fiji 🇫🇯 | 60.4% | $3.9 |
| Suriname 🇸🇷 | 58.8% | $5.7 |
| Namibia 🇳🇦 | 56.8% | $3.5 |
| Bhutan 🇧🇹 | 53.0% | $5.0 |
| Mongolia 🇲🇳 | 51.4% | $5.1 |
| Honduras 🇭🇳 | 51.3% | $3.5 |
| Iraq 🇮🇶 | 49.6% | $3.5 |
| Kyrgyzstan 🇰🇬 | 49.6% | $3.2 |
| Sri Lanka 🇱🇰 | 49.0% | $3.9 |
| Senegal 🇸🇳 | 46.0% | $2.3 |
| Guyana 🇬🇾 | 43.0% | $4.9 |
| Armenia 🇦🇲 | 42.9% | $3.2 |
| Tajikistan 🇹🇯 | 42.1% | $3.5 |
| Cabo Verde 🇨🇻 | 38.1% | $3.6 |
| Belize 🇧🇿 | 36.4% | $2.1 |
| Gabon 🇬🇦 | 36.3% | $3.6 |
| Nicaragua 🇳🇮 | 35.7% | $3.3 |
| Algeria 🇩🇿 | 30.2% | $3.8 |
| Vietnam 🇻🇳 | 30.0% | $4.1 |
| Colombia 🇨🇴 | 26.5% | $3.1 |
| Mexico 🇲🇽 | 26.3% | $3.3 |
| Bolivia 🇧🇴 | 24.7% | $3.8 |
| Palestine 🇵🇸 | 23.1% | $3.4 |
| Ecuador 🇪🇨 | 21.4% | $2.9 |
| Saint Lucia 🇱🇨 | 20.6% | $3.6 |
| Peru 🇵🇪 | 20.5% | $3.3 |
| Iran 🇮🇷 | 20.3% | $3.6 |
| Tunisia 🇹🇳 | 20.3% | $3.6 |
| Albania 🇦🇱 | 20.1% | $4.2 |
| Brazil 🇧🇷 | 19.0% | $3.1 |
| Dominican Republic 🇩🇴 | 18.3% | $3.9 |
| Panama 🇵🇦 | 18.2% | $4.5 |
| North Macedonia 🇲🇰 | 18.0% | $3.4 |
| Paraguay 🇵🇾 | 17.8% | $3.5 |
| Montenegro 🇲🇪 | 17.5% | $3.5 |
| Thailand 🇹🇭 | 17.0% | $4.3 |
| Costa Rica 🇨🇷 | 16.8% | $4.1 |
| Morocco 🇲🇦 | 16.7% | $2.8 |
| Serbia 🇷🇸 | 16.3% | $4.2 |
| Jordan 🇯🇴 | 14.9% | $3.6 |
| Mauritius 🇲🇺 | 13.5% | $3.6 |
| China 🇨🇳 | 12.0% | $3.0 |
| Trinidad and Tobago 🇹🇹 | 11.6% | $4.2 |
| Romania 🇷🇴 | 8.8% | $3.2 |
| Bulgaria 🇧🇬 | 8.5% | $4.1 |
| Seychelles 🇸🇨 | 6.8% | $3.8 |
| Moldova 🇲🇩 | 6.7% | $2.8 |
| Chile 🇨🇱 | 3.8% | $3.4 |
| Croatia 🇭🇷 | 3.8% | $4.3 |
| Bosnia and Herzegovina 🇧🇦 | 3.7% | $4.0 |
| Uruguay 🇺🇾 | 3.6% | $3.4 |
| Russia 🇷🇺 | 3.5% | $3.4 |
| Greece 🇬🇷 | 3.2% | $3.1 |
| Italy 🇮🇹 | 2.9% | $3.1 |
| Japan 🇯🇵 | 2.5% | $5.8 |
| Hungary 🇭🇺 | 2.0% | $3.5 |
| Spain 🇪🇸 | 2.0% | $2.8 |
| Malaysia 🇲🇾 | 1.9% | $3.5 |
| Latvia 🇱🇻 | 1.8% | $3.2 |
| South Korea 🇰🇷 | 1.7% | $5.2 |
| United States 🇺🇸 | 1.5% | $3.4 |
| Maldives 🇲🇻 | 1.4% | $3.9 |
| Estonia 🇪🇪 | 1.3% | $3.3 |
| Kazakhstan 🇰🇿 | 1.2% | $2.7 |
| Lithuania 🇱🇹 | 1.2% | $3.1 |
| Slovakia 🇸🇰 | 1.2% | $3.2 |
| Israel 🇮🇱 | 1.0% | $2.5 |
| Poland 🇵🇱 | 1.0% | $3.2 |
| Austria 🇦🇹 | 0.8% | $3.0 |
| Australia 🇦🇺 | 0.7% | $2.6 |
| Canada 🇨🇦 | 0.7% | $3.0 |
| Malta 🇲🇹 | 0.7% | $3.8 |
| Sweden 🇸🇪 | 0.6% | $3.3 |
| Portugal 🇵🇹 | 0.5% | $2.7 |
| United Kingdom 🇬🇧 | 0.5% | $1.9 |
| Denmark 🇩🇰 | 0.4% | $2.5 |
| Norway 🇳🇴 | 0.4% | $3.5 |
| Cyprus 🇨🇾 | 0.3% | $3.0 |
| Belarus 🇧🇾 | 0.2% | $3.3 |
| Belgium 🇧🇪 | 0.2% | $3.1 |
| Czechia | 0.2% | $3.0 |
| Germany 🇩🇪 | 0.2% | $3.0 |
| Netherlands 🇳🇱 | 0.2% | $3.0 |
| Finland 🇫🇮 | 0.1% | $2.7 |
| France 🇫🇷 | 0.1% | $3.2 |
| Ireland 🇮🇪 | 0.1% | $2.2 |
| Luxembourg 🇱🇺 | 0.1% | $2.7 |
| Slovenia 🇸🇮 | 0.1% | $3.1 |
| Azerbaijan 🇦🇿 | 0.0% | $2.5 |
| Iceland 🇮🇸 | 0.0% | $2.4 |
| Switzerland 🇨🇭 | 0.0% | $2.7 |
| United Arab Emirates 🇦🇪 | 0.0% | $3.1 |
| World 🌎 | 42.0% | $3.5 |
In 52 countries, more than half of the population cannot afford a healthy diet. The majority of these are in Africa, with the rest located across Asia, Oceania, and the Americas.
By contrast, in four countries—Azerbaijan, Iceland, Switzerland, and the UAE—everyone is able to afford a healthy diet. The picture is similar for most European and developed high-income countries, where more than 95% of the population can afford a healthy diet.
When the percentages are translated into numbers, Asia contains the most number of people unable to afford a healthy diet at 1.89 billion, of which 973 million people are in India alone. Another 1 billion people are in Africa, with around 151 million people in the Americas and Oceania.
While hunger is a worldwide concern, it is particularly acute in African countries, which cover all of the top 20 spots in the above table.
Africa’s Deepening Food Crisis
In many countries across sub-Saharan Africa, more than 90% of the population cannot afford a healthy diet.
Sub-Saharan Africa is particularly susceptible to extreme climate events and the resulting volatility in food prices. Roughly one-third of the world’s droughts occur in the region, and some sub-Saharan countries are also heavily reliant on imports for food.
Russia’s invasion of Ukraine has deepened the crisis, with many African countries importing over 50% of their wheat from the two countries in conflict. The rising food prices from this supply chain disruption have resulted in double-digit food inflation in many African nations, which means that more people are likely to be unable to afford healthy diets.
The Horn of Africa region at the Eastern tip of Africa is particularly in turmoil. All the countries in the region are reliant on wheat from Russia and Ukraine, with Eritrea (100%) and Somalia (>90%) high up in the import dependency chart. Additionally, the region is facing its worst drought in 40 years alongside ongoing political conflicts. As a result, 22 million people are at risk of starvation.
Population Growth and Food Insecurity
In November of 2022, the global population is projected to surpass 8 billion people, and many of the fastest growing countries are also food-insecure.
By 2050, the global population is likely to increase by 35%, and to meet the growing demand for food, crop production will need to double. Given that agriculture is one of the biggest contributors to greenhouse gas emissions, this increase in crop production will also need to be environmentally sustainable.
As the impacts of climate change intensify and food demand increases, reducing food waste, building climate-resilient agricultural infrastructure, and improving agricultural productivity will all play a key role in reducing the levels of food insecurity sustainably.


Misc
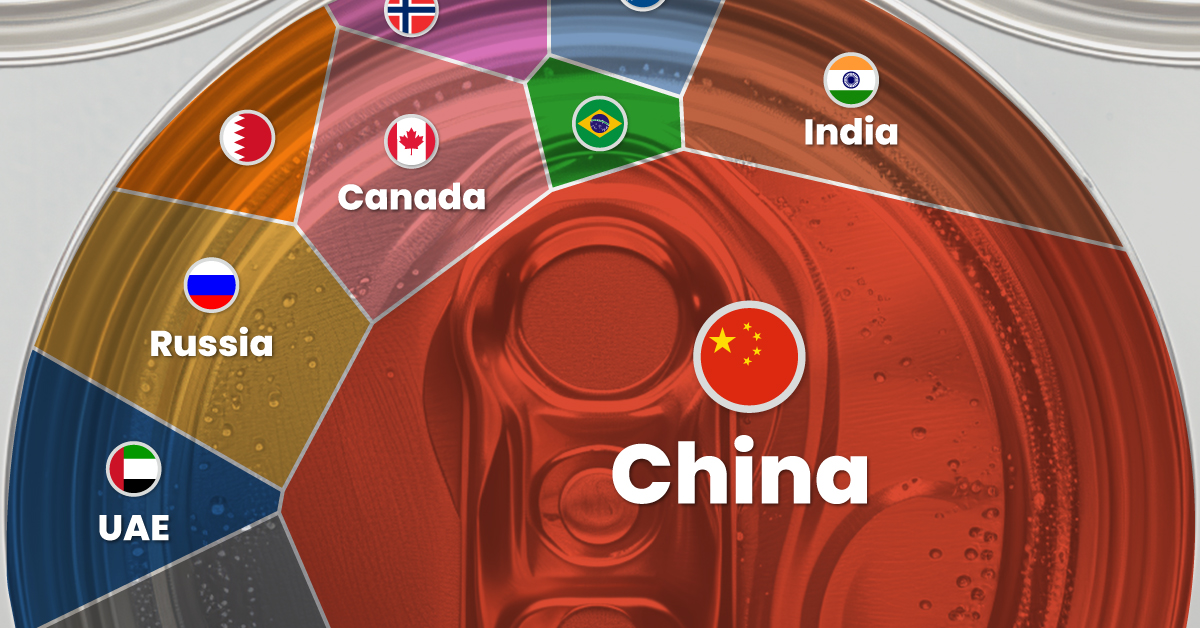
Visualizing Global Aluminum Production
China dominates global production with nearly 60% share.
Visualizing Global Aluminum Production
This was originally posted on our Voronoi app. Download the app for free on iOS or Android and discover incredible data-driven charts from a variety of trusted sources.
This infographic shows estimated aluminum smelter production by country in 2023, based on data from the most recent U.S. Geological Survey (USGS) Mineral Commodity Summaries, published in January 2024 .
From this data, we can see that China leads as the top producer, accounting for nearly 60% of the world’s smelter capacity. Its neighbor India is the second-largest producer, making only a tenth of China’s output.
| Country | 2023 Aluminum Smelter Production (tonnes) | % of total |
|---|---|---|
| 🇨🇳 China | 41,000,000 | 59% |
| 🇮🇳 India | 4,100,000 | 6% |
| 🇷🇺 Russia | 3,800,000 | 5% |
| 🇨🇦 Canada | 3,000,000 | 4% |
| 🇦🇪 United Arab Emirates | 2,700,000 | 4% |
| 🇧🇭 Bahrain | 1,600,000 | 2% |
| 🇦🇺 Australia | 1,500,000 | 2% |
| 🇳🇴 Norway | 1,300,000 | 2% |
| 🇧🇷 Brazil | 1,100,000 | 2% |
| 🌍 Rest of the World | 9,460,000 | 14% |
| Total | 69,560,000 | 100% |
Responsible for 5% of global aluminum output, Russia has been targeted by recent sanctions from the U.S. and the UK.
The sanctions include prohibiting metal-trading exchanges from accepting new aluminum produced by Russia and barring the import of the Russian metal into the U.S. and Britain. The actions are aimed at disrupting Russian export revenue amid Moscow’s ongoing invasion of Ukraine.
The World’s Most Common Metal
Aluminum is the primary material used for making cans, foil, and many other products. It originates from bauxites, rocks composed of aluminum oxides, and various minerals.
Approximately 25% of annually produced aluminum is utilized by the construction industry, while another 23% is allocated to vehicle frames, wires, wheels, and other components within the transportation sector. Aluminum foil, cans, and packaging constitute another significant end-use category, accounting for 17% of consumption.
Despite its extensive use, aluminum is still plentiful. Aluminum is the world’s most common metal by crustal abundance, making up 8.2% of the Earth’s crust.
According to the USGS, global resources of bauxite are estimated to be between 55 billion and 75 billion tonnes and are sufficient to meet world demand for metal well into the future.
Misc
Brass Rods: The Sustainable Choice
Brass rods can help cut emissions in machine shops, be recycled without losing properties, and contribute to a cleaner environment.

Brass Rods: The Sustainable Choice
Brass rods have a powerful lineup of green attributes, making them the sustainable choice for manufacturers and end-users of precision machined and forged parts.
This infographic, from the Copper Development Association, shows how brass rods can reduce emissions in machine shops, be recycled without losing properties, and contribute to a cleaner environment.
The Brass Rod Circular Economy
The metallurgical properties of brass allow pre- and post-consumer sources of brass scrap to be recycled with no loss in properties.
Brass scrap can retain over 90% of the original material value. In addition, brass doesn’t need energy-intensive processing, unlike steel and aluminum, which must be smelted and refined before being recycled into new products.
As a result, there is a greater chance that steel and aluminum scrap will end up in landfills.
Most brass-rod alloys produced in North America contain 95% or higher recycled content.
Closed-loop recycling of brass keeps this valuable engineering material out of landfills, reducing the need for new mines and all the environmental impacts that entails.
Higher Machinability Leads to Lower Operational Carbon Emissions
Machinability is how easily a material can be worked using cutting processes. It directly impacts the amount of energy required to produce finished parts.
With typical machine shops producing millions of parts each year, the carbon impact can be significant.
Here’s how brass and steel compare when manufacturing complex parts using computer numerical control (CNC) machining.
| Material | Brass | Steel |
|---|---|---|
| Type | Free-cutting brass (C36000) | Free-cutting steel (12L14) |
| Maximum machinability rating (0-100) | 100 | 21 |
| Metal Removal Rate (cubic inches per minute) | 0.238 | 0.114 |
| Time to remove material (hours) | 161,111 | 336,111 |
| Energy required to produce parts (kilowatt-hour) | 9,475 | 18,931 |
In this example, using brass represented a savings of 3,510 kg in carbon dioxide (CO2).
The significantly longer tool life enabled by brass also reduces the need for new cutting tools, further decreasing emissions.
High recycled content and exceptional machinability make brass rods the sustainable choice for manufacturers and end-users seeking to reduce their environmental footprint and support the transition to a low-carbon future.
Explore the advantages of brass rod solutions.

-

 Electrification3 years ago
Ranked: The Top 10 EV Battery Manufacturers
-

 Electrification2 years ago
The Key Minerals in an EV Battery
-

 Real Assets3 years ago
The World’s Top 10 Gold Mining Companies
-

 Electrification3 years ago
Mapped: Solar Power by Country in 2021
-

 Misc3 years ago
All the Metals We Mined in One Visualization
-

 Energy Shift2 years ago
What Are the Five Major Types of Renewable Energy?
-

 Electrification2 years ago
The World’s Largest Nickel Mining Companies
-

 Misc3 years ago
The Largest Copper Mines in the World by Capacity