

Real Assets
Mapped: Which Countries Have the Highest Inflation?
Mapped: Which Countries Have the Highest Inflation Rate?
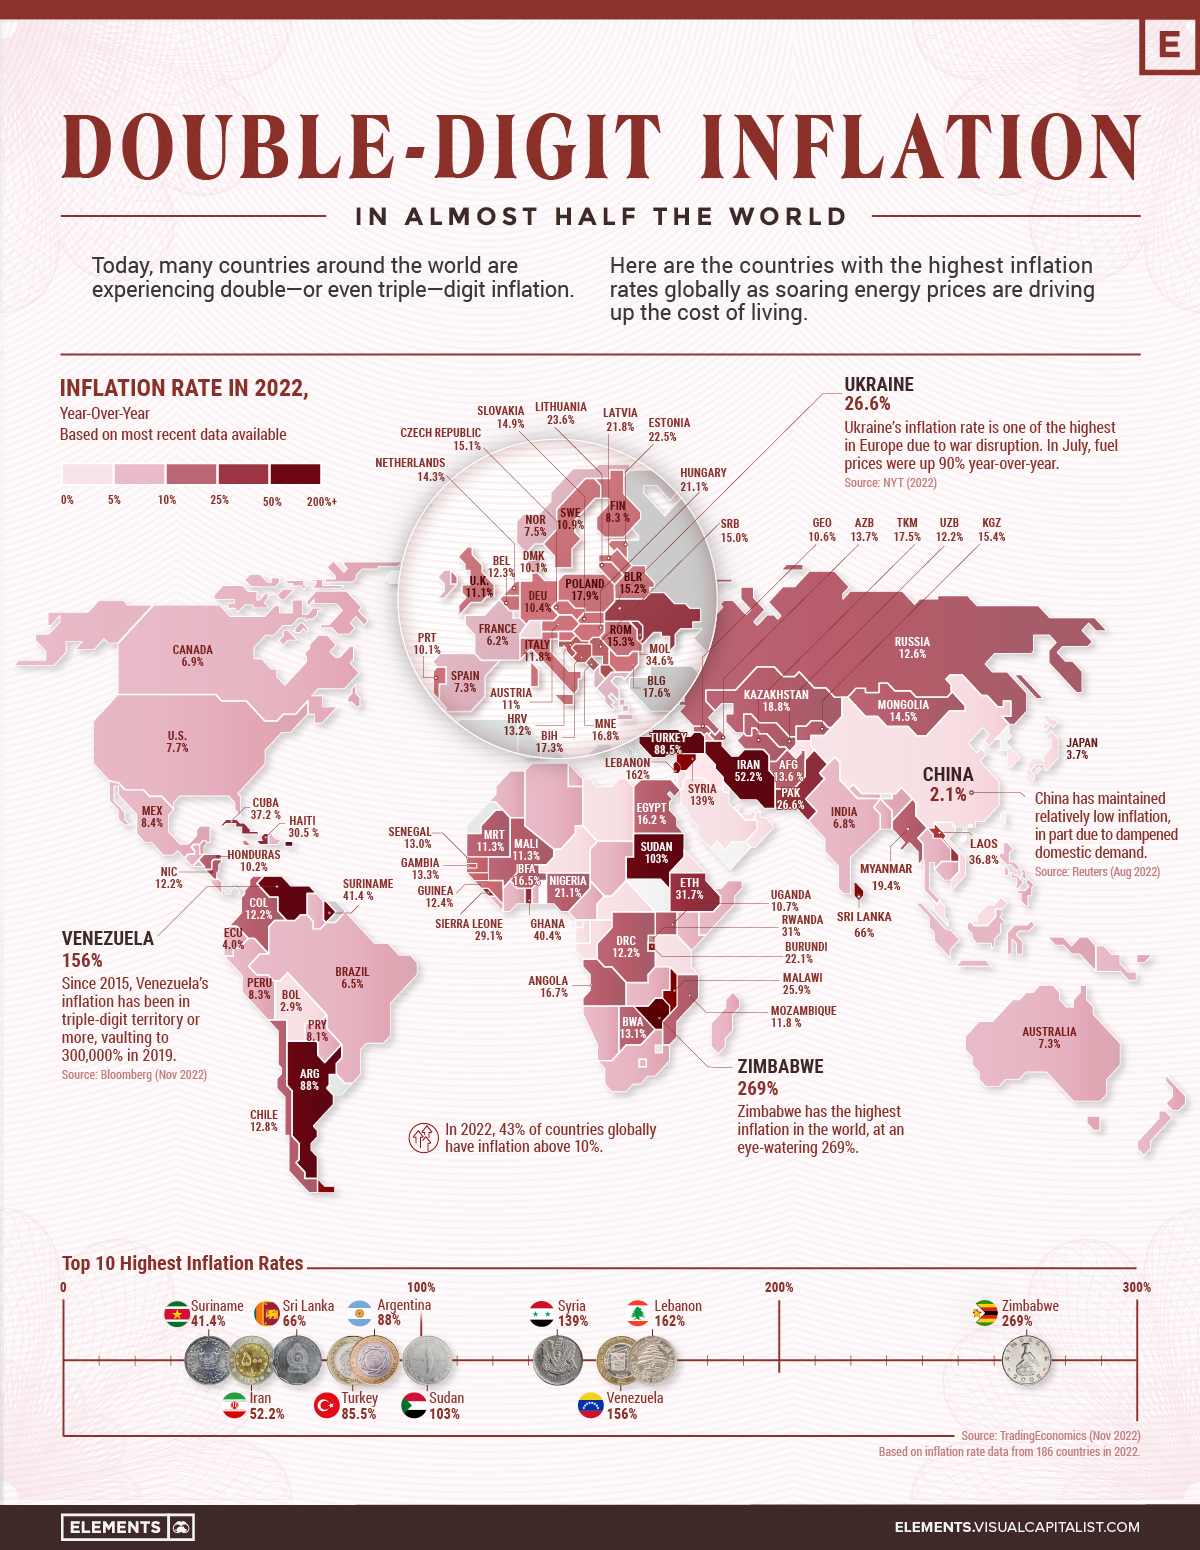
Inflation is surging nearly everywhere in 2022.
Geopolitical tensions are triggering high energy costs, while supply-side disruptions are also distorting consumer prices. The end result is that almost half of countries worldwide are seeing double-digit inflation rates or higher.
With new macroeconomic forces shaping the global economy, the above infographic shows countries with the highest inflation rates, using data from Trading Economics.
Double-Digit Inflation in 2022
As the table below shows, countless countries are navigating record-high levels of inflation. Some are even facing triple-digit inflation rates. Globally, Zimbabwe, Lebanon, and Venezuela have the highest rates in the world.
| Country | Inflation Rate, Year-Over-Year | Date |
|---|---|---|
| 🇿🇼 Zimbabwe | 269.0% | Oct 2022 |
| 🇱🇧 Lebanon | 162.0% | Sep 2022 |
| 🇻🇪 Venezuela | 156.0% | Oct 2022 |
| 🇸🇾 Syria | 139.0% | Aug 2022 |
| 🇸🇩 Sudan | 103.0% | Oct 2022 |
| 🇦🇷 Argentina | 88.0% | Oct 2022 |
| 🇹🇷 Turkey | 85.5% | Oct 2022 |
| 🇱🇰 Sri Lanka | 66.0% | Oct 2022 |
| 🇮🇷 Iran | 52.2% | Aug 2022 |
| 🇸🇷 Suriname | 41.4% | Sep 2022 |
| 🇬🇭 Ghana | 40.4% | Oct 2022 |
| 🇨🇺 Cuba | 37.2% | Sep 2022 |
| 🇱🇦 Laos | 36.8% | Oct 2022 |
| 🇲🇩 Moldova | 34.6% | Oct 2022 |
| 🇪🇹 Ethiopia | 31.7% | Oct 2022 |
| 🇷🇼 Rwanda | 31.0% | Oct 2022 |
| 🇭🇹 Haiti | 30.5% | Jul 2022 |
| 🇸🇱 Sierra Leone | 29.1% | Sep 2022 |
| 🇵🇰 Pakistan | 26.6% | Oct 2022 |
| 🇺🇦 Ukraine | 26.6% | Oct 2022 |
| 🇲🇼 Malawi | 25.9% | Sep 2022 |
| 🇱🇹 Lithuania | 23.6% | Oct 2022 |
| 🇪🇪 Estonia | 22.5% | Oct 2022 |
| 🇧🇮 Burundi | 22.1% | Oct 2022 |
| 🇸🇹 Sao Tome and Principe | 21.9% | Sep 2022 |
| 🇱🇻 Latvia | 21.8% | Oct 2022 |
| 🇭🇺 Hungary | 21.1% | Oct 2022 |
| 🇳🇬 Nigeria | 21.1% | Oct 2022 |
| 🇲🇰 Macedonia | 19.8% | Oct 2022 |
| 🇲🇲 Myanmar | 19.4% | Jun 2022 |
| 🇰🇿 Kazakhstan | 18.8% | Oct 2022 |
| 🇵🇱 Poland | 17.9% | Oct 2022 |
| 🇧🇬 Bulgaria | 17.6% | Oct 2022 |
| 🇹🇲 Turkmenistan | 17.5% | Dec 2021 |
| 🇧🇦 Bosnia and Herzegovina | 17.3% | Sep 2022 |
| 🇲🇪 Montenegro | 16.8% | Oct 2022 |
| 🇦🇴 Angola | 16.7% | Oct 2022 |
| 🇧🇫 Burkina Faso | 16.5% | Sep 2022 |
| 🇪🇬 Egypt | 16.2% | Oct 2022 |
| 🇰🇲 Comoros | 15.9% | Sep 2022 |
| 🇰🇬 Kyrgyzstan | 15.4% | Oct 2022 |
| 🇷🇴 Romania | 15.3% | Oct 2022 |
| 🇧🇾 Belarus | 15.2% | Oct 2022 |
| 🇨🇿 Czech Republic | 15.1% | Oct 2022 |
| 🇷🇸 Serbia | 15.0% | Oct 2022 |
| 🇸🇰 Slovakia | 14.9% | Oct 2022 |
| 🇲🇳 Mongolia | 14.5% | Oct 2022 |
| 🇳🇱 Netherlands | 14.3% | Oct 2022 |
| 🇦🇿 Azerbaijan | 13.7% | Oct 2022 |
| 🇦🇫 Afghanistan | 13.6% | Sep 2022 |
| 🇬🇲 Gambia | 13.3% | Sep 2022 |
| 🇭🇷 Croatia | 13.2% | Oct 2022 |
| 🇧🇼 Botswana | 13.1% | Oct 2022 |
| 🇸🇳 Senegal | 13.0% | Oct 2022 |
| 🇨🇱 Chile | 12.8% | Oct 2022 |
| 🇽🇰 Kosovo | 12.7% | Oct 2022 |
| 🇷🇺 Russia | 12.6% | Oct 2022 |
| 🇬🇳 Guinea | 12.4% | Jul 2022 |
| 🇧🇪 Belgium | 12.3% | Oct 2022 |
| 🇨🇴 Colombia | 12.2% | Oct 2022 |
| 🇺🇿 Uzbekistan | 12.2% | Oct 2022 |
| 🇨🇬 Congo | 12.2% | Oct 2022 |
| 🇳🇮 Nicaragua | 12.2% | Oct 2022 |
| 🇰🇾 Cayman Islands | 12.1% | Jun 2022 |
| 🇲🇺 Mauritius | 11.9% | Oct 2022 |
| 🇲🇿 Mozambique | 11.8% | Oct 2022 |
| 🇮🇹 Italy | 11.8% | Oct 2022 |
| 🇲🇱 Mali | 11.3% | Sep 2022 |
| 🇲🇷 Mauritania | 11.3% | Sep 2022 |
| 🇬🇧 United Kingdom | 11.1% | Oct 2022 |
| 🇦🇹 Austria | 11.0% | Oct 2022 |
| 🇸🇪 Sweden | 10.9% | Oct 2022 |
| 🇺🇬 Uganda | 10.7% | Oct 2022 |
| 🇬🇪 Georgia | 10.6% | Oct 2022 |
| 🇩🇪 Germany | 10.4% | Oct 2022 |
| 🇭🇳 Honduras | 10.2% | Oct 2022 |
| 🇩🇰 Denmark | 10.1% | Oct 2022 |
| 🇵🇹 Portugal | 10.1% | Oct 2022 |
| 🇯🇲 Jamaica | 9.9% | Oct 2022 |
| 🇸🇮 Slovenia | 9.9% | Oct 2022 |
| 🇬🇹 Guatemala | 9.7% | Oct 2022 |
| 🇿🇲 Zambia | 9.7% | Oct 2022 |
| 🇰🇪 Kenya | 9.6% | Oct 2022 |
| 🇦🇲 Armenia | 9.5% | Oct 2022 |
| 🇮🇸 Iceland | 9.4% | Oct 2022 |
| 🇲🇬 Madagascar | 9.3% | Aug 2022 |
| 🇮🇪 Ireland | 9.2% | Oct 2022 |
| 🇱🇸 Lesotho | 9.2% | Sep 2022 |
| 🇹🇳 Tunisia | 9.2% | Oct 2022 |
| 🇬🇷 Greece | 9.1% | Oct 2022 |
| 🇺🇾 Uruguay | 9.1% | Oct 2022 |
| 🇨🇷 Costa Rica | 9.0% | Oct 2022 |
| 🇧🇩 Bangladesh | 8.9% | Oct 2022 |
| 🇨🇾 Cyprus | 8.8% | Oct 2022 |
| 🇫🇴 Faroe Islands | 8.8% | Sep 2022 |
| 🇩🇿 Algeria | 8.7% | Sep 2022 |
| 🇳🇵 Nepal | 8.6% | Sep 2022 |
| 🇸🇧 Solomon Islands | 8.5% | Aug 2022 |
| 🇲🇽 Mexico | 8.4% | Oct 2022 |
| 🇬🇼 Guinea Bissau | 8.4% | Sep 2022 |
| 🇦🇱 Albania | 8.3% | Oct 2022 |
| 🇧🇧 Barbados | 8.3% | Aug 2022 |
| 🇫🇮 Finland | 8.3% | Oct 2022 |
| 🇲🇦 Morocco | 8.3% | Sep 2022 |
| 🇵🇪 Peru | 8.3% | Oct 2022 |
| 🇩🇴 Dominican Republic | 8.2% | Oct 2022 |
| 🇨🇻 Cape Verde | 8.2% | Oct 2022 |
| 🇵🇾 Paraguay | 8.1% | Oct 2022 |
| 🇹🇱 East Timor | 7.9% | Sep 2022 |
| 🇹🇬 Togo | 7.9% | Sep 2022 |
| 🇵🇭 Philippines | 7.7% | Oct 2022 |
| 🇺🇸 U.S. | 7.7% | Oct 2022 |
| 🇨🇲 Cameroon | 7.6% | Sep 2022 |
| 🇳🇴 Norway | 7.5% | Oct 2022 |
| 🇸🇬 Singapore | 7.5% | Sep 2022 |
| 🇿🇦 South Africa | 7.5% | Sep 2022 |
| 🇸🇻 El Salvador | 7.5% | Oct 2022 |
| 🇲🇹 Malta | 7.4% | Oct 2022 |
| 🇦🇺 Australia | 7.3% | Sep 2022 |
| 🇪🇸 Spain | 7.3% | Oct 2022 |
| 🇹🇩 Chad | 7.2% | Sep 2022 |
| 🇳🇿 New Zealand | 7.2% | Sep 2022 |
| 🇧🇿 Belize | 7.1% | Sep 2022 |
| 🇳🇦 Namibia | 7.1% | Oct 2022 |
| 🇦🇼 Aruba | 7.0% | Sep 2022 |
| 🇨🇦 Canada | 6.9% | Oct 2022 |
| 🇱🇺 Luxembourg | 6.9% | Oct 2022 |
| 🇸🇴 Somalia | 6.9% | Oct 2022 |
| 🇮🇳 India | 6.8% | Oct 2022 |
| 🇦🇪 United Arab Emirates | 6.8% | Jun 2022 |
| 🇬🇾 Guyana | 6.5% | Sep 2022 |
| 🇱🇷 Liberia | 6.5% | Jul 2022 |
| 🇧🇷 Brazil | 6.5% | Oct 2022 |
| 🇧🇸 Bahamas | 6.3% | Aug 2022 |
| 🇨🇮 Ivory Coast | 6.3% | Sep 2022 |
| 🇹🇹 Trinidad and Tobago | 6.3% | Aug 2022 |
| 🇫🇷 France | 6.2% | Oct 2022 |
| 🇩🇯 Djibouti | 6.1% | Sep 2022 |
| 🇵🇷 Puerto Rico | 6.1% | Sep 2022 |
| 🇧🇹 Bhutan | 6.1% | Sep 2022 |
| 🇧🇹 Qatar | 6.0% | Sep 2022 |
| 🇹🇭 Thailand | 6.0% | Oct 2022 |
| 🇸🇿 Swaziland | 5.8% | Aug 2022 |
| 🇮🇩 Indonesia | 5.7% | Oct 2022 |
| 🇰🇷 South Korea | 5.7% | Oct 2022 |
| 🇹🇯 Tajikistan | 5.7% | Sep 2022 |
| 🇵🇬 Papua New Guinea | 5.5% | Jun 2022 |
| 🇰🇭 Cambodia | 5.4% | Jul 2022 |
| 🇮🇶 Iraq | 5.3% | Sep 2022 |
| 🇯🇴 Jordan | 5.2% | Oct 2022 |
| 🇫🇯 Fiji | 5.1% | Sep 2022 |
| 🇮🇱 Israel | 5.1% | Oct 2022 |
| 🇳🇨 New Caledonia | 5.0% | Sep 2022 |
| 🇹🇿 Tanzania | 4.9% | Oct 2022 |
| 🇧🇲 Bermuda | 4.5% | Jul 2022 |
| 🇪🇷 Eritrea | 4.5% | Dec 2021 |
| 🇲🇾 Malaysia | 4.5% | Sep 2022 |
| 🇭🇰 Hong Kong | 4.4% | Sep 2022 |
| 🇵🇸 Palestine | 4.4% | Oct 2022 |
| 🇧🇳 Brunei | 4.3% | Sep 2022 |
| 🇱🇾 Libya | 4.3% | Sep 2022 |
| 🇻🇳 Vietnam | 4.3% | Oct 2022 |
| 🇪🇨 Ecuador | 4.0% | Oct 2022 |
| 🇧🇭 Bahrain | 4.0% | Sep 2022 |
| 🇯🇵 Japan | 3.7% | Oct 2022 |
| 🇰🇼 Kuwait | 3.2% | Sep 2022 |
| 🇳🇪 Niger | 3.2% | Sep 2022 |
| 🇲🇻 Maldives | 3.1% | Sep 2022 |
| 🇬🇦 Gabon | 3.0% | Jul 2022 |
| 🇱🇮 Liechtenstein | 3.0% | Oct 2022 |
| 🇸🇦 Saudi Arabia | 3.0% | Oct 2022 |
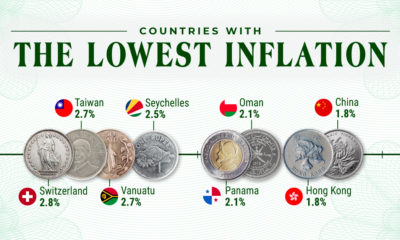
| 🇨🇭 Switzerland | 3.0% | Oct 2022 |
| 🇸🇨 Seychelles | 2.9% | Oct 2022 |
| 🇬🇶 Equatorial Guinea | 2.9% | Dec 2021 |
| 🇧🇴 Bolivia | 2.9% | Oct 2022 |
| 🇹🇼 Taiwan | 2.7% | Oct 2022 |
| 🇨🇫 Central African Republic | 2.7% | Dec 2021 |
| 🇻🇺 Vanuatu | 2.7% | Mar 2022 |
| 🇴🇲 Oman | 2.4% | Sep 2022 |
| 🇧🇯 Benin | 2.1% | Oct 2022 |
| 🇨🇳 China | 2.1% | Oct 2022 |
| 🇵🇦 Panama | 1.9% | Sep 2022 |
| 🇲🇴 Macau | 1.1% | Sep 2022 |
| 🇸🇸 South Sudan | -2.5% | Aug 2022 |
*Inflation rates based on the latest available data.
As price pressures mount, 33 central banks tracked by the Bank of International Settlements (out of a total of 38) have raised interest rates this year. These coordinated rate hikes are the largest in two decades, representing an end to an era of rock-bottom interest rates.
Going into 2023, central banks could continue this shift towards hawkish policies as inflation remains aggressively high.
The Role of Energy Prices
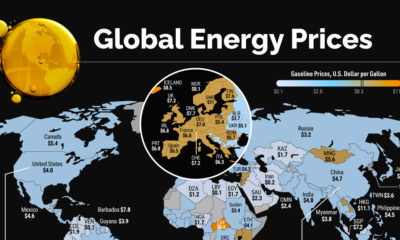
Driven by the war in Ukraine, energy inflation is pushing up the cost of living around the world.
Since October 2020, an index of global energy prices—made up of crude oil, natural gas, coal, and propane—has increased drastically.
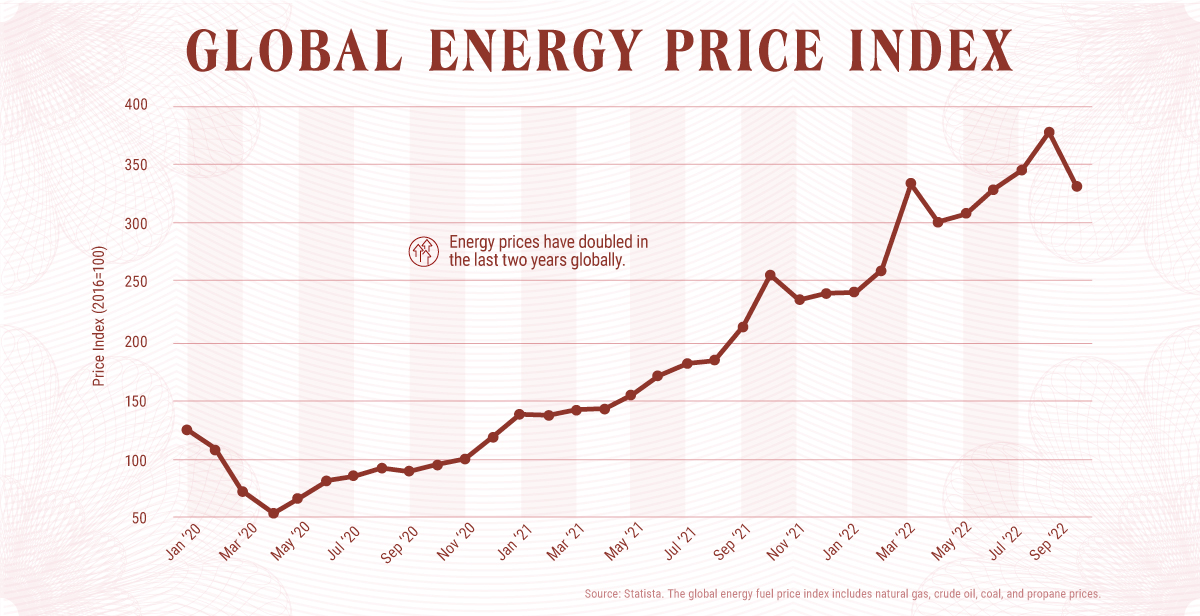
Compared to the 2021 average, natural gas prices in Europe are up sixfold. Real European household electricity prices are up 78% and gas prices have climbed even more, at 144% compared to 20-year averages.
Amid global competition for liquefied natural gas supplies, price pressures are likely to stay high, even though they have fallen recently. Other harmful consequences of the energy shock include price volatility, economic strain, and energy shortages.
“The world is in the midst of the first truly global energy crisis, with impacts that will be felt for years to come”.
-Fatih Birol, executive director of the IEA
Double-Digit Inflation: Will it Last?
If history is an example, taming rising prices could take at least a few years yet.
Take the sky-high inflation of the 1980s. Italy, which managed to combat inflation faster than most countries, brought down inflation from 22% in 1980 to 4% in 1986.
If global inflation rates, which hover around 9.8% in 2022, were to follow this course, it would take at least until 2025 for levels to reach the 2% target.
It’s worth noting that inflation was also highly volatile over this decade. Consider how inflation fell across much of the rich world by 1981 but shot up again in 1987 amid higher energy prices. Federal Reserve chair Jerome Powell spoke to the volatility of inflation at their November meeting, indicating that high inflation has a chance of following a period of low inflation.
While the Federal Reserve projects U.S. inflation to fall closer to its 2% target by 2024, the road ahead could still get a lot bumpier between now and then.


Real Assets
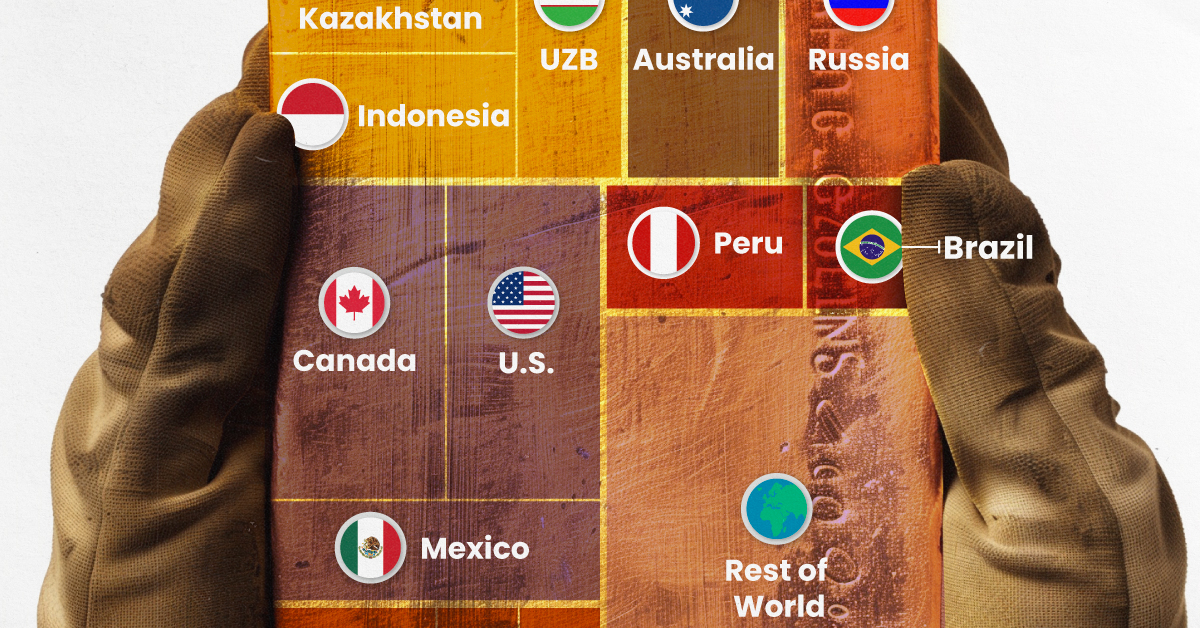
Visualizing Global Gold Production in 2023
Gold production in 2023 was led by China, Australia, and Russia, with each outputting over 300 tonnes.
Visualizing Global Gold Production in 2023
This was originally posted on our Voronoi app. Download the app for free on iOS or Android and discover incredible data-driven charts from a variety of trusted sources.
Over 3,000 tonnes of gold were produced globally in 2023.
In this graphic, we list the world’s leading countries in terms of gold production. These figures come from the latest USGS publication on gold statistics (published January 2024).
China, Australia, and Russia Produced the Most Gold in 2023
China was the top producer in 2023, responsible for over 12% of total global production, followed by Australia and Russia.
| Country | Region | 2023E Production (tonnes) |
|---|---|---|
| 🇨🇳 China | Asia | 370 |
| 🇦🇺 Australia | Oceania | 310 |
| 🇷🇺 Russia | Europe | 310 |
| 🇨🇦 Canada | North America | 200 |
| 🇺🇸 United States | North America | 170 |
| 🇰🇿 Kazakhstan | Asia | 130 |
| 🇲🇽 Mexico | North America | 120 |
| 🇮🇩 Indonesia | Asia | 110 |
| 🇿🇦 South Africa | Africa | 100 |
| 🇺🇿 Uzbekistan | Asia | 100 |
| 🇬🇭 Ghana | Africa | 90 |
| 🇵🇪 Peru | South America | 90 |
| 🇧🇷 Brazil | South America | 60 |
| 🇧🇫 Burkina Faso | Africa | 60 |
| 🇲🇱 Mali | Africa | 60 |
| 🇹🇿 Tanzania | Africa | 60 |
| 🌍 Rest of World | - | 700 |
Gold mines in China are primarily concentrated in eastern provinces such as Shandong, Henan, Fujian, and Liaoning. As of January 2024, China’s gold mine reserves stand at an estimated 3,000 tonnes, representing around 5% of the global total of 59,000 tonnes.
In addition to being the top producer, China emerged as the largest buyer of the yellow metal for the year. In fact, the country’s central bank alone bought 225 tonnes of gold in 2023, according the World Gold Council.
Estimated Global Gold Consumption
Most of the gold produced in 2023 was used in jewelry production, while another significant portion was sold as a store of value, such as in gold bars or coins.
- Jewelry: 46%
- Central Banks and Institutions: 23%
- Physical Bars: 16%
- Official Coins, Medals, and Imitation Coins: 9%
- Electrical and Electronics: 5%
- Other: 1%
According to Fitch Solutions, over the medium term (2023-2032), global gold mine production is expected to grow 15%, as high prices encourage investment and output.
Real Assets
Charted: The Value Gap Between the Gold Price and Gold Miners
While gold prices hit all-time highs, gold mining stocks have lagged far behind.

Gold Price vs. Gold Mining Stocks
This was originally posted on our Voronoi app. Download the app for free on Apple or Android and discover incredible data-driven charts from a variety of trusted sources.
Although the price of gold has reached new record highs in 2024, gold miners are still far from their 2011 peaks.
In this graphic, we illustrate the evolution of gold prices since 2000 compared to the NYSE Arca Gold BUGS Index (HUI), which consists of the largest and most widely held public gold production companies. The data was compiled by Incrementum AG.
Mining Stocks Lag Far Behind
In April 2024, gold reached a new record high as Federal Reserve Chair Jerome Powell signaled policymakers may delay interest rate cuts until clearer signs of declining inflation materialize.
Additionally, with elections occurring in more than 60 countries in 2024 and ongoing conflicts in Ukraine and Gaza, central banks are continuing to buy gold to strengthen their reserves, creating momentum for the metal.
Traditionally known as a hedge against inflation and a safe haven during times of political and economic uncertainty, gold has climbed over 11% so far this year.
According to Business Insider, gold miners experienced their best performance in a year in March 2024. During that month, the gold mining sector outperformed all other U.S. industries, surpassing even the performance of semiconductor stocks.
Still, physical gold has outperformed shares of gold-mining companies over the past three years by one of the largest margins in decades.
| Year | Gold Price | NYSE Arca Gold BUGS Index (HUI) |
|---|---|---|
| 2023 | $2,062.92 | $243.31 |
| 2022 | $1,824.32 | $229.75 |
| 2021 | $1,828.60 | $258.87 |
| 2020 | $1,895.10 | $299.64 |
| 2019 | $1,523.00 | $241.94 |
| 2018 | $1,281.65 | $160.58 |
| 2017 | $1,296.50 | $192.31 |
| 2016 | $1,151.70 | $182.31 |
| 2015 | $1,060.20 | $111.18 |
| 2014 | $1,199.25 | $164.03 |
| 2013 | $1,201.50 | $197.70 |
| 2012 | $1,664.00 | $444.22 |
| 2011 | $1,574.50 | $498.73 |
| 2010 | $1,410.25 | $573.32 |
| 2009 | $1,104.00 | $429.91 |
| 2008 | $865.00 | $302.41 |
| 2007 | $836.50 | $409.37 |
| 2006 | $635.70 | $338.24 |
| 2005 | $513.00 | $276.90 |
| 2004 | $438.00 | $215.33 |
| 2003 | $417.25 | $242.93 |
| 2002 | $342.75 | $145.12 |
| 2001 | $276.50 | $65.20 |
| 2000 | $272.65 | $40.97 |
Among the largest companies on the NYSE Arca Gold BUGS Index, Colorado-based Newmont has experienced a 24% drop in its share price over the past year. Similarly, Canadian Barrick Gold also saw a decline of 6.5% over the past 12 months.

-

 Electrification3 years ago
Ranked: The Top 10 EV Battery Manufacturers
-

 Electrification2 years ago
The Key Minerals in an EV Battery
-

 Real Assets3 years ago
The World’s Top 10 Gold Mining Companies
-

 Electrification2 years ago
Mapped: Solar Power by Country in 2021
-

 Misc3 years ago
All the Metals We Mined in One Visualization
-

 Energy Shift2 years ago
What Are the Five Major Types of Renewable Energy?
-

 Electrification2 years ago
The World’s Largest Nickel Mining Companies
-

 Misc3 years ago
The Largest Copper Mines in the World by Capacity