Misc
Countries with the Highest (and Lowest) Proportion of Immigrants
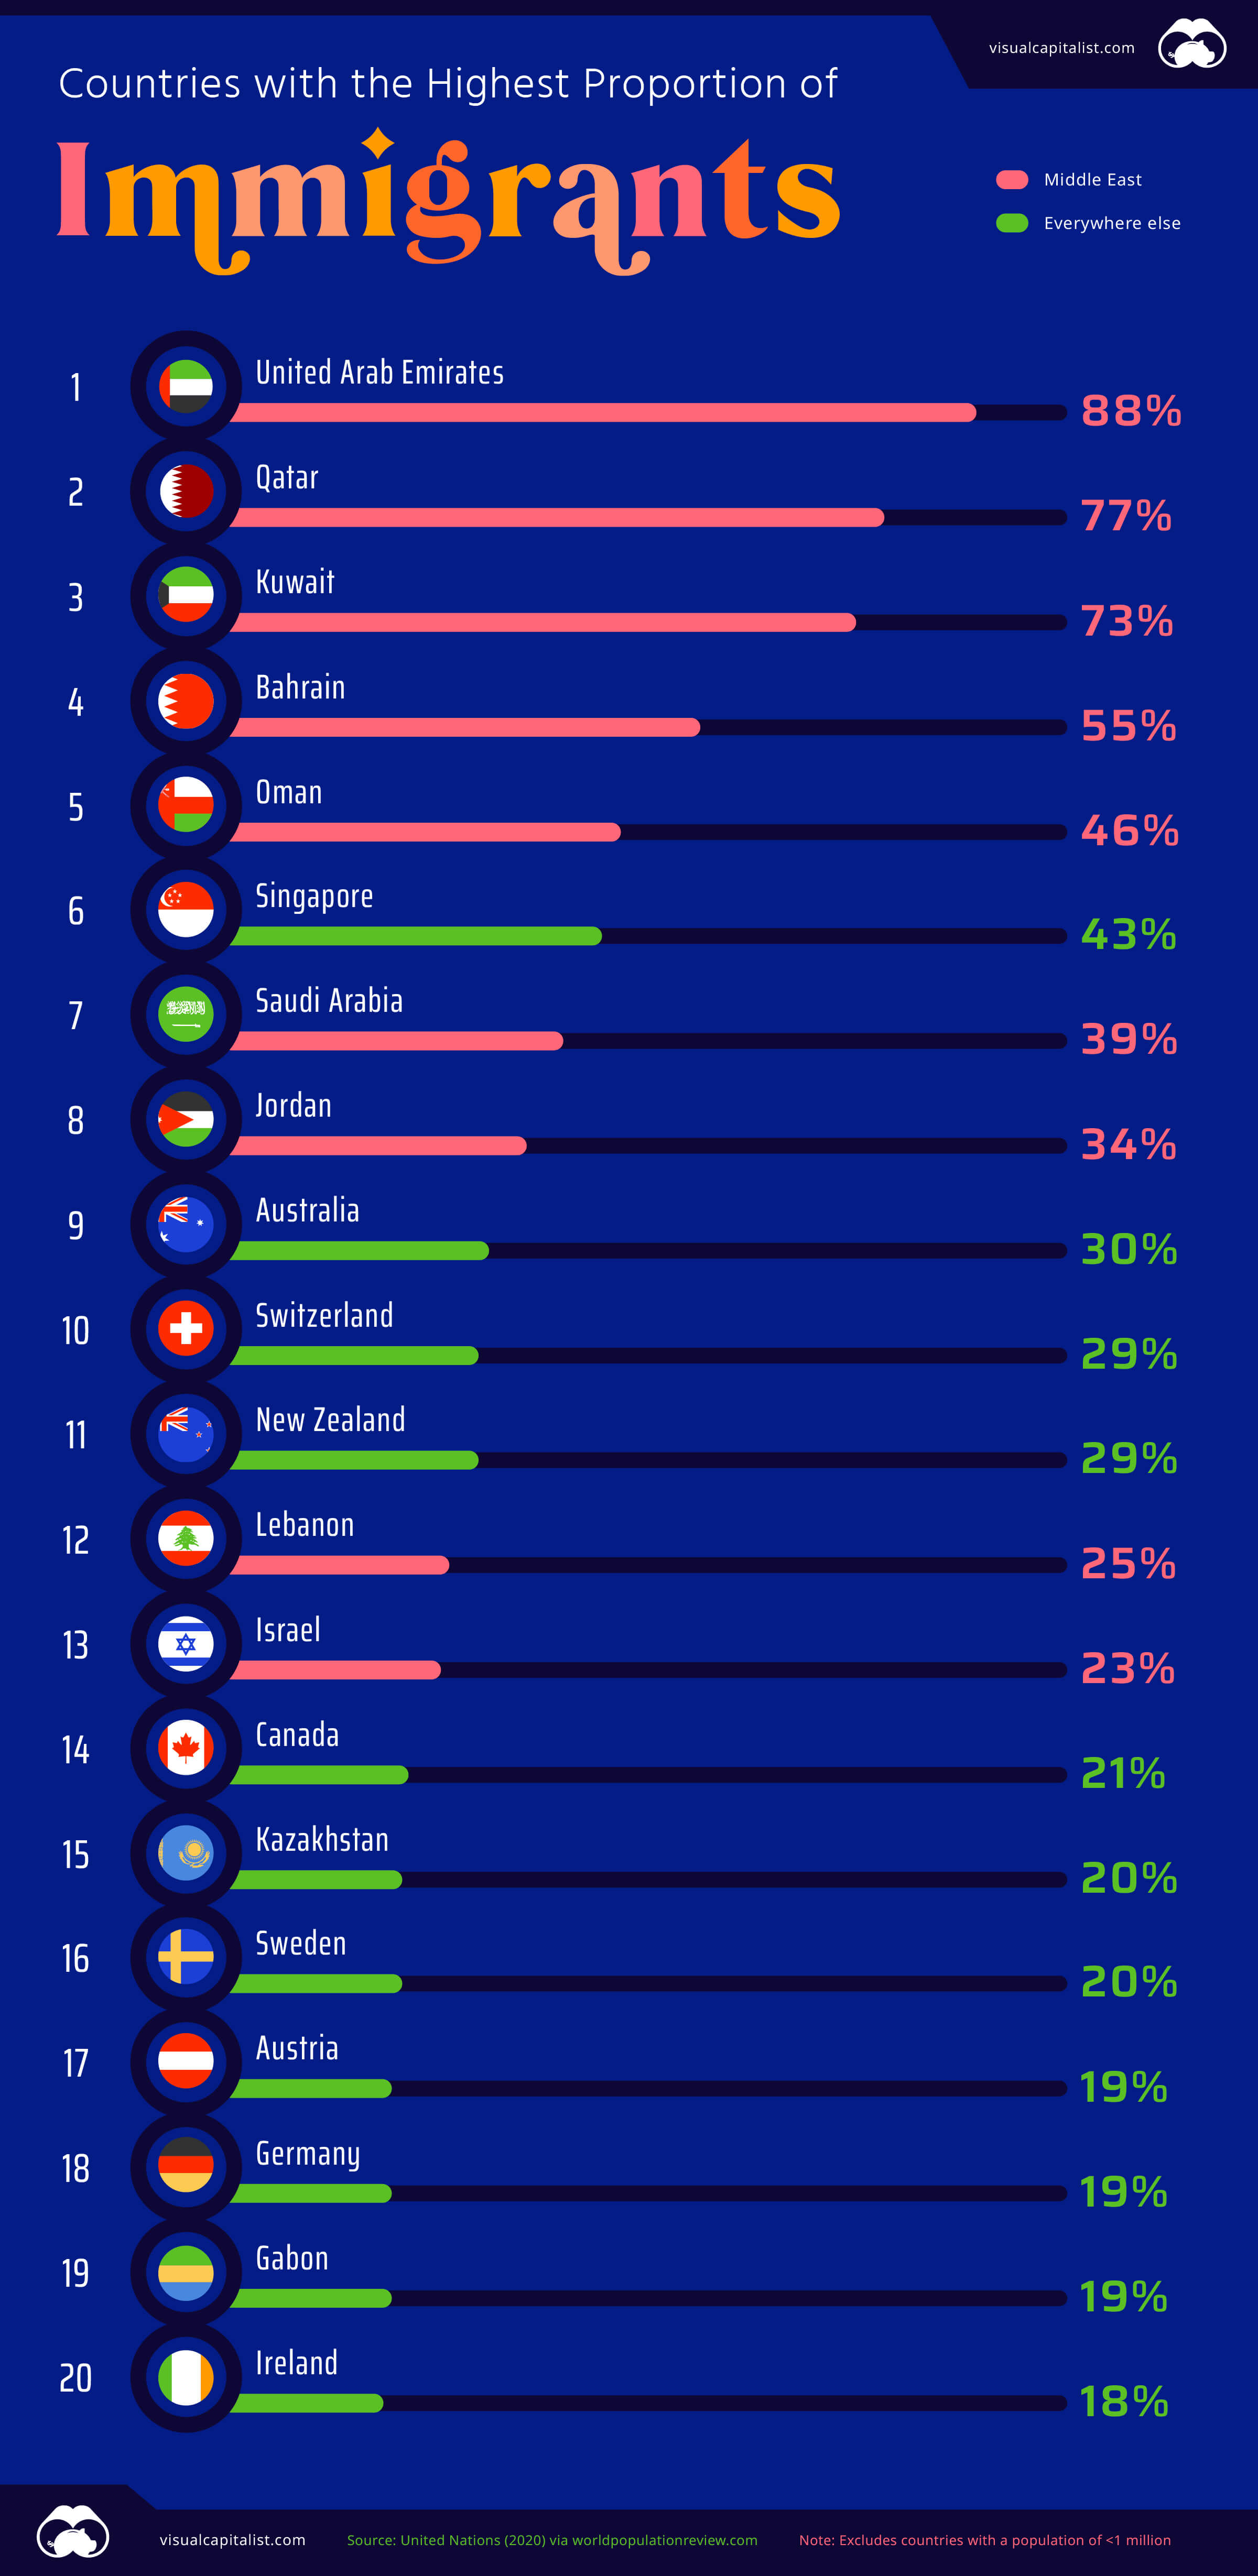
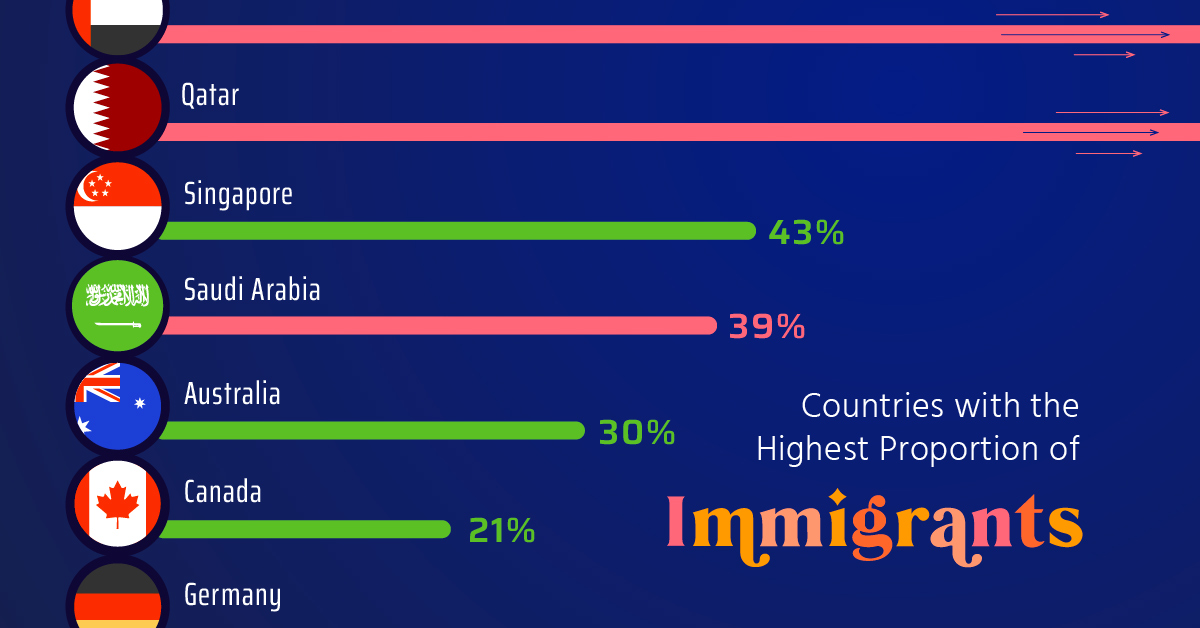
Countries with the Highest Proportion of Immigrants
For people living in cosmopolitan urban centers, it’s easy to overestimate the prevalence of immigrants around the world.
The median proportion of foreign-born people in all countries is just over 5%. In countries with a population greater than one million, only four are majority foreign-born, and only eight surpass the one-third mark.
Here are the top 20 countries with the highest proportion of immigrants in their populations:
| Country | Immigrants as a percentage of population |
|---|---|
| 🇦🇪 United Arab Emirates | 88% |
| 🇶🇦 Qatar | 77% |
| 🇰🇼 Kuwait | 73% |
| 🇧🇭 Bahrain | 55% |
| 🇴🇲 Oman | 46% |
| 🇸🇬 Singapore | 43% |
| 🇸🇦 Saudi Arabia | 39% |
| 🇯🇴 Jordan | 34% |
| 🇦🇺 Australia | 30% |
| 🇨🇭 Switzerland | 29% |
| 🇳🇿 New Zealand | 29% |
| 🇱🇧 Lebanon | 25% |
| 🇮🇱 Israel | 23% |
| 🇨🇦 Canada | 21% |
| 🇰🇿 Kazakhstan | 20% |
| 🇸🇪 Sweden | 20% |
| 🇦🇹 Austria | 19% |
| 🇩🇪 Germany | 19% |
| 🇬🇦 Gabon | 19% |
| 🇮🇪 Ireland | 18% |
Source: UN via World Population Review. Note: Only countries with a population of greater than one million are included.
The United Arab Emirates comes out on top for the highest proportion of immigrants in its population. Impressively, the small Middle Eastern nation ranks sixth in the world for total immigrant population (8.7 million people).
Other countries on the Arabian Peninsula also rank at the top of this list. In Qatar, current host of the 2022 World Cup, 3-in-4 people are immigrants. The high proportion of foreign workers in the country also results in an extreme demographic skew—approximately 75% of the population of Qatar is male.
The one extreme outlier in the region is war-torn Yemen, where only 1.3% of the population are immigrants.
Outside the Middle East, Singapore (43%) takes top spot, followed by Australia (30%).
Spotlight on U.S. Immigration
Although the United States is outside the top 20, it still has by far the most immigrants of any other country (50 million vs. 16 million in second-place Germany).
About 15% of people in the U.S. are immigrants—numbers which are comparable to the historic high in the late 19th century. The proportion of foreign-born people in the country has been on the rise since the 1970s, and is projected to continue rising in coming decades. Around 2030, immigration is expected to surpass natural increases as a driver of population growth.
Countries with the Lowest Proportion of Immigrants
A few countries are magnets for immigration, while a great many more receive very little immigration. This can simply be due to lack of demand, or because of more extreme circumstances such as war or a failing economy. In other cases, immigration policies may limit the number of people who can migrate to a country.
Here are the top 20 countries with the lowest proportion of immigrants in their populations:
| Country | Immigrants as a percentage of population |
|---|---|
| 🇨🇺 Cuba | 0.03% |
| 🇨🇳 China | 0.07% |
| 🇻🇳 Vietnam | 0.08% |
| 🇮🇩 Indonesia | 0.13% |
| 🇲🇬 Madagascar | 0.13% |
| 🇲🇲 Myanmar | 0.14% |
| 🇭🇹 Haiti | 0.17% |
| 🇰🇵 North Korea | 0.19% |
| 🇱🇰 Sri Lanka | 0.19% |
| 🇵🇭 Philippines | 0.21% |
| 🇲🇦 Morocco | 0.28% |
| 🇮🇳 India | 0.35% |
| 🇵🇬 Papua New Guinea | 0.35% |
| 🇦🇫 Afghanistan | 0.37% |
| 🇸🇴 Somalia | 0.37% |
| 🇪🇷 Eritrea | 0.39% |
| 🇭🇳 Honduras | 0.40% |
| 🇬🇹 Guatemala | 0.47% |
| 🇰🇭 Cambodia | 0.47% |
| 🇹🇳 Tunisia | 0.51% |
Cuba has the lowest level of foreign-born people in its population. The Caribbean nation makes it very difficult for foreign nationals obtain permanent residency.
China comes in second last. In absolute terms, the million or so immigrants living in China may sound like a lot, but pales in comparison to the overall population of 1.4 billion.
Interestingly, Japan–which is the poster child for low immigration–isn’t on the list above. The country’s foreign-born population sits at just over 2%.


Automotive
How People Get Around in America, Europe, and Asia
Examining how people get around using cars, public transit, and walking or biking, and the regional differences in usage.


How People Get Around in America, Europe, and Asia
This was originally posted on our Voronoi app. Download the app for free on iOS or Android and discover incredible data-driven charts from a variety of trusted sources.
This chart highlights the popularity of different transportation types in the Americas, Europe, and Asia, calculated by modal share.
Data for this article and visualization is sourced from ‘The ABC of Mobility’, a research paper by Rafael Prieto-Curiel (Complexity Science Hub) and Juan P. Ospina (EAFIT University), accessed through ScienceDirect.
The authors gathered their modal share data through travel surveys, which focused on the primary mode of transportation a person employs for each weekday trip. Information from 800 cities across 61 countries was collected for this study.
North American Car Culture Contrasts with the Rest of the World
In the U.S. and Canada, people heavily rely on cars to get around, no matter the size of the city. There are a few exceptions of course, such as New York, Toronto, and smaller college towns across the United States.
| Region | 🚗 Cars | 🚌 Public Transport | 🚶 Walking/Biking |
|---|---|---|---|
| North America* | 92% | 5% | 4% |
| Central America | 23% | 42% | 35% |
| South America | 29% | 40% | 31% |
| Northern Europe | 48% | 29% | 24% |
| Western Europe | 43% | 24% | 34% |
| Southern Europe | 50% | 24% | 25% |
| Eastern Europe | 35% | 40% | 25% |
| Southeastern Asia | 44% | 43% | 13% |
| Western Asia | 43% | 28% | 29% |
| Southern Asia | 22% | 39% | 39% |
| Eastern Asia | 19% | 46% | 35% |
| World | 51% | 26% | 22% |
Note: *Excluding Mexico. Percentages are rounded.
As a result, North America’s share of public transport and active mobility (walking and biking) is the lowest amongst all surveyed regions by a significant amount.
On the other hand, public transport reigns supreme in South and Central America as well as Southern and Eastern Asia. It ties with cars in Southeastern Asia, and is eclipsed by cars in Western Asia.
As outlined in the paper, Europe sees more city-level differences in transport popularity.
For example, Utrecht, Netherlands prefers walking and biking. People in Paris and London like using their extensive transit systems. And in Manchester and Rome, roughly two out of three journeys are by car.

-

 Markets5 days ago
Visualizing Global Inflation Forecasts (2024-2026)
-

 Green2 weeks ago
The Carbon Footprint of Major Travel Methods
-

 United States2 weeks ago
Visualizing the Most Common Pets in the U.S.
-

 Culture2 weeks ago
The World’s Top Media Franchises by All-Time Revenue
-

 voronoi1 week ago
Best Visualizations of April on the Voronoi App
-

 Wealth1 week ago
Charted: Which Country Has the Most Billionaires in 2024?
-

 Business1 week ago
The Top Private Equity Firms by Country
-

 Markets1 week ago
The Best U.S. Companies to Work for According to LinkedIn