United States
Charted: Rising Mass Shootings in America
Article/Editing:
Charted: Rising Mass Shootings in America
The United States of America has a new fatal epidemic on its hands. But it’s not a new virus or disease; it’s the skyrocketing number of mass shootings.
On January 21, 2023, a gunman opened fire on a group celebrating the Lunar New Year in California, killing 10 and injuring 10 others.
This graphic by Pablo Alvarez used data from the Gun Violence Archive to track the number of mass shootings in the U.S. over the past eight years and highlight the states that have witnessed the worst of it.
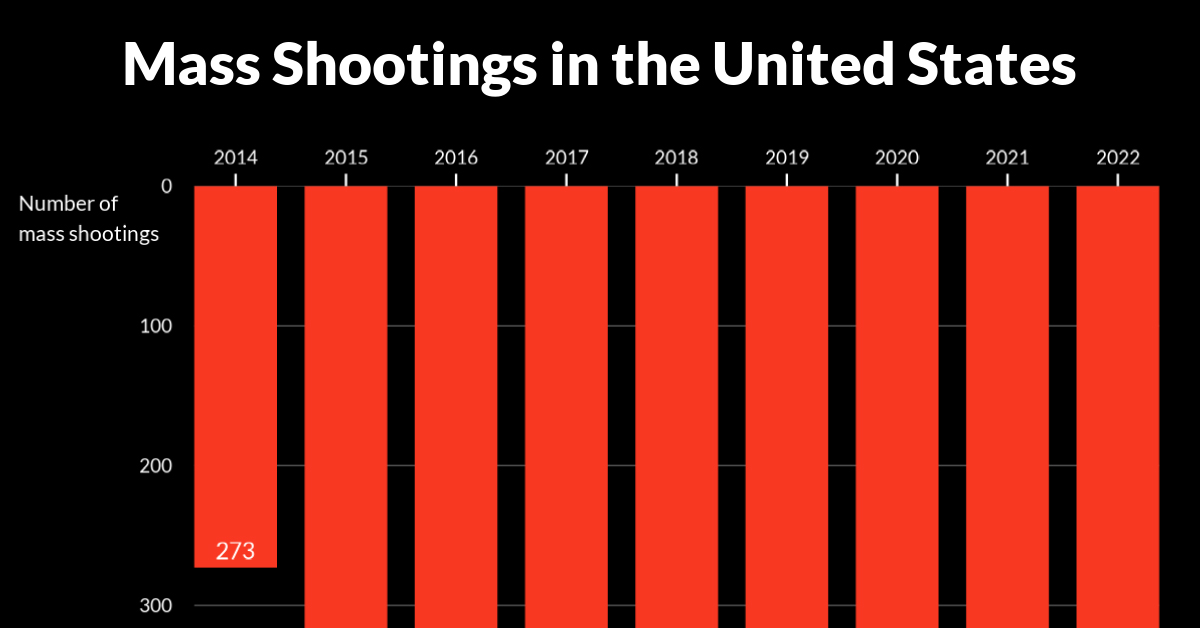
U.S. Mass Shootings From 2014‒2022
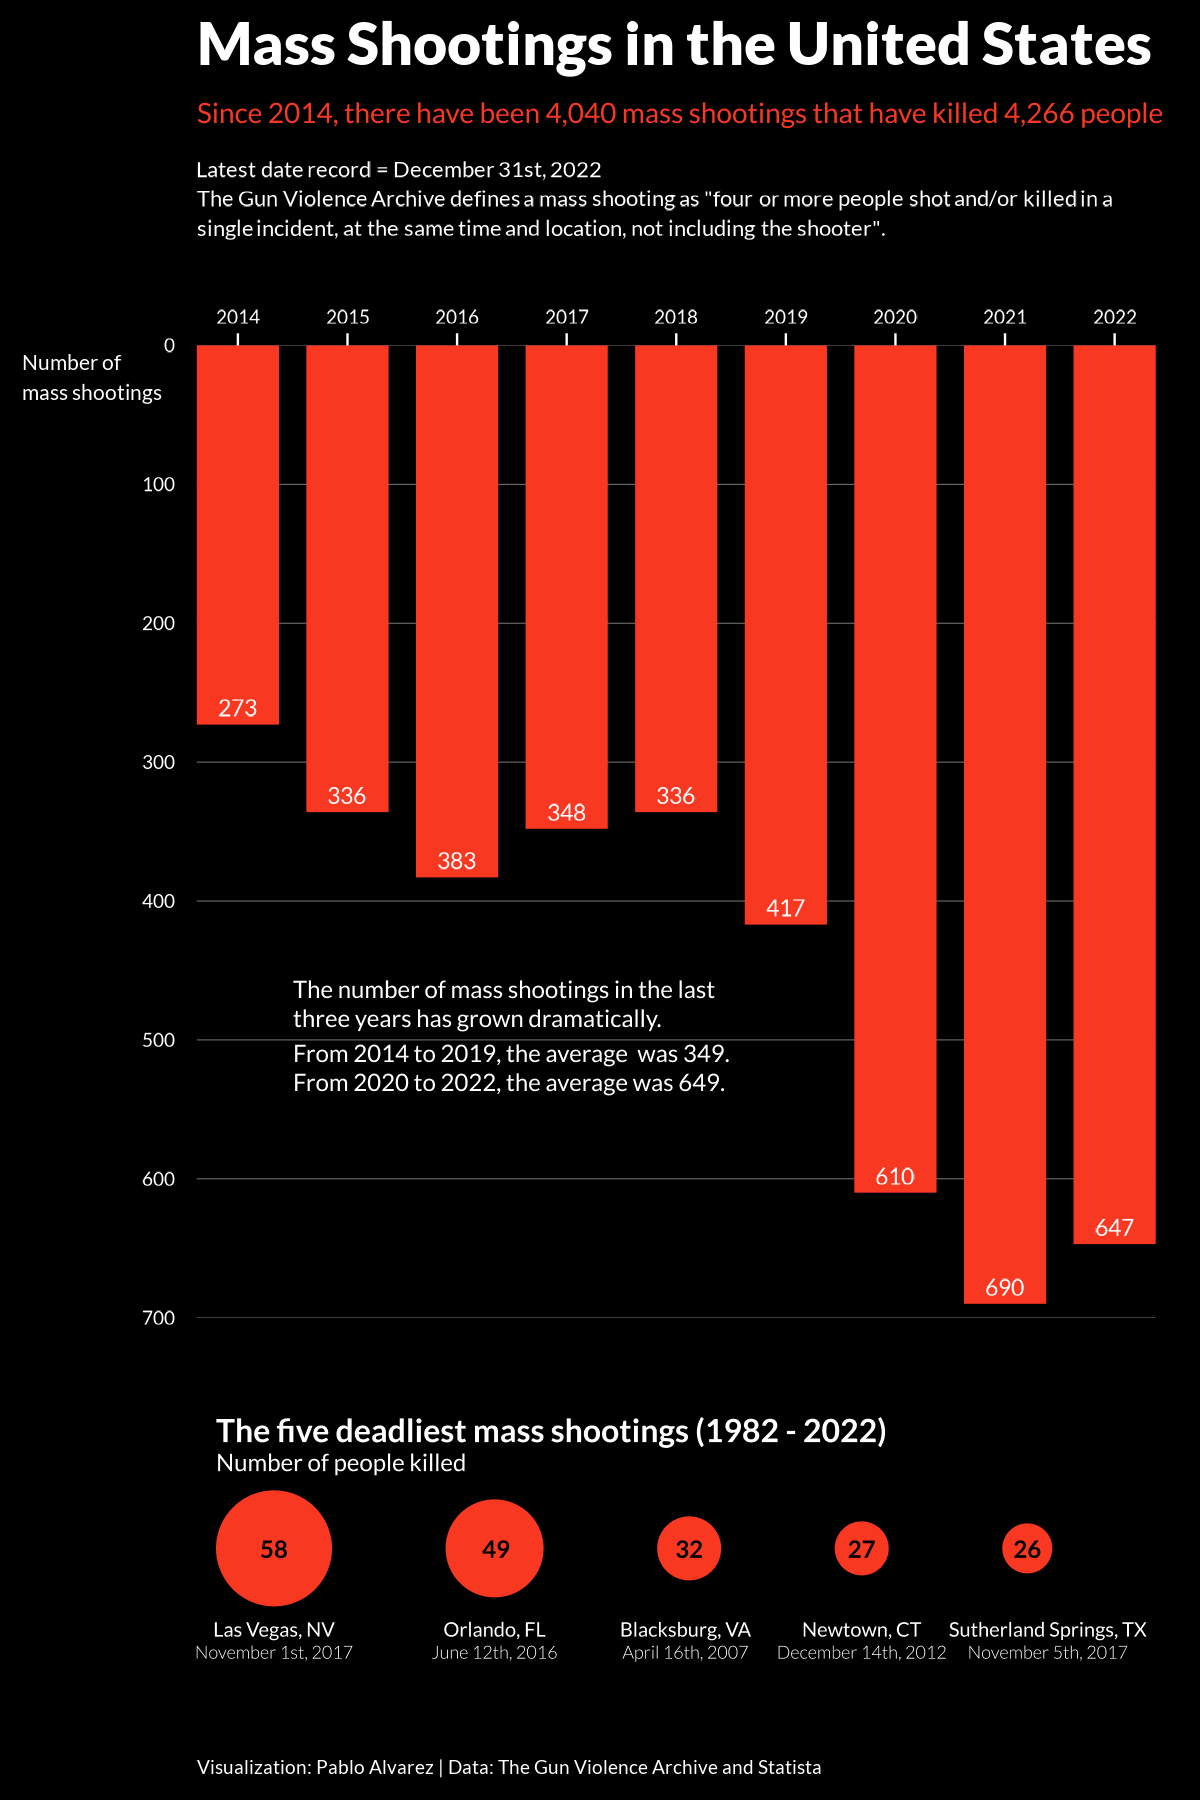
While gun violence has been a hot topic in the U.S. for many years, mass shootings are now visibly on the rise. In fact, they have almost doubled post-pandemic.
According to the Gun Violence Archive, mass shootings comprise incidents where four or more people (not including the shooter) are shot at the same time and in the same location.
| Year | Number of Mass Shootings | Killed | Injured |
|---|---|---|---|
| 2022 | 647 | 673 | 2700 |
| 2021 | 690 | 704 | 2827 |
| 2020 | 610 | 513 | 2540 |
| 2019 | 417 | 465 | 1712 |
| 2018 | 336 | 372 | 1330 |
| 2017 | 348 | 441 | 1807 |
| 2016 | 383 | 453 | 1539 |
| 2015 | 336 | 369 | 1337 |
| 2014 | 273 | 275 | 1086 |
Between 2020 and 2022, the U.S. saw 1,947 mass shootings. These tragic incidents killed 1890 people and left over 8,000 others injured.
Las Vegas witnessed the deadliest mass shooting in modern U.S. history on October 1, 2017, when a gunman opened fire on a crowd of 22,000 people attending a country music festival. The incident took 58 lives and injured over 500 people.
A year before this tragedy, 49 people lost their lives in the mass shooting at Orlando’s Pulse nightclub, with more than 50 additional people wounded. In fact, many of the deadliest mass shootings in U.S. history have occurred in the 21st century, and especially over the last 10 years.

This article was published as a part of Visual Capitalist's Creator Program, which features data-driven visuals from some of our favorite Creators around the world.


Public Opinion
Charted: How Democrats and Republicans View Government Agencies
Predictably, results diverge when both Democrats and Republicans are asked to rate key government agencies in the United States.

How Democrats and Republicans View Government Agencies
This was originally posted on our Voronoi app. Download the app for free on iOS or Android and discover incredible data-driven charts from a variety of trusted sources.
Forget the presidential race, the partisan divide in America can also be seen by how Democrats and Republicans feel about key government agencies.
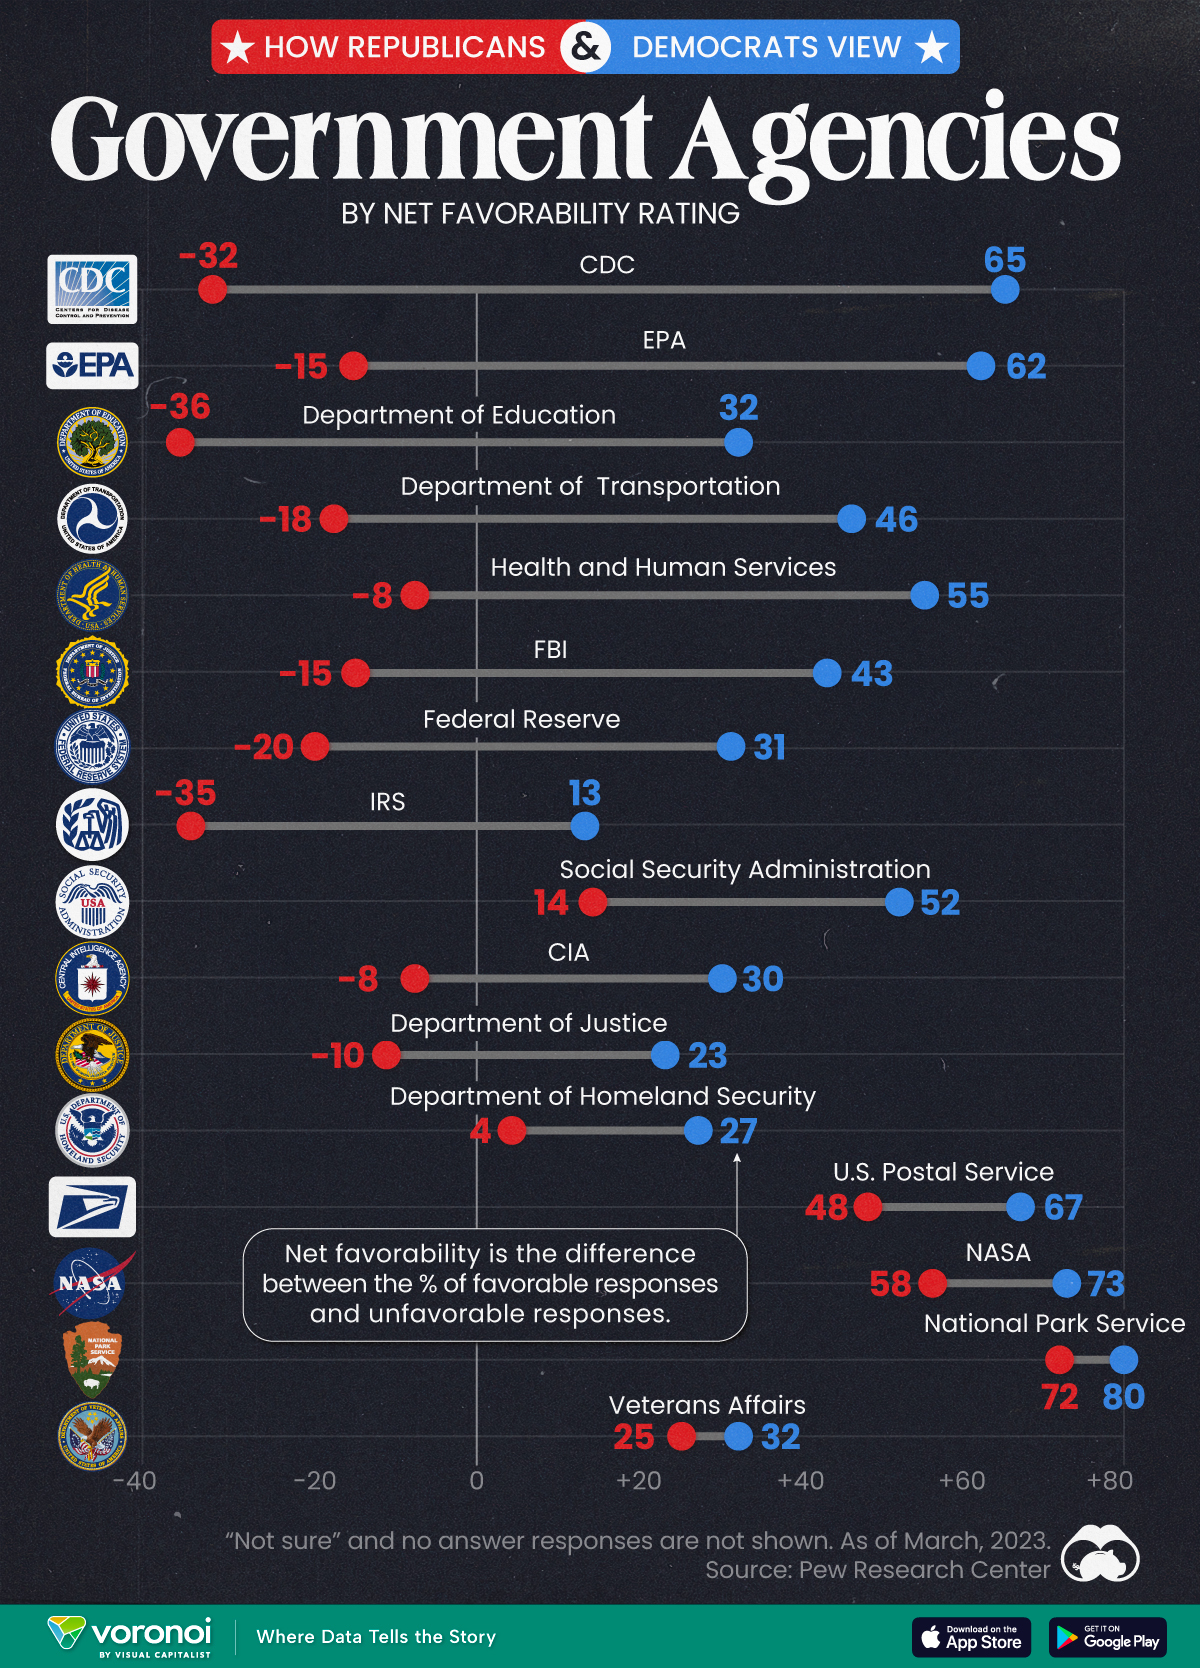
We visualize the net favorability ratings of 16 federal government agencies, based on respondent party affiliation.
To find this data, Pew Research Center surveyed more than 10,000 adults, between March 13-19, 2023. View their methodology page for more details about the survey, the questions asked, and the results obtained.
Republicans Don’t Like How the CDC Handled the Pandemic
The division in net favorability is deepest for three federal government agencies. While the CDC garnered a net favorability rating of 65 from Democrats, more Republicans rated the agency unfavorably, leading to a net favorability rating of -32.
Similarly, with the EPA and the Department of Education, the difference in net favorability between the two voting sides is as high as 70–80 points.
| Federal Agency | Republican Net Favorability Rating | Democrat Net Favorability Rating |
|---|---|---|
| 🔬 CDC | -32 | 65 |
| 🌿 EPA | -15 | 62 |
| 📚 Department of Education | -36 | 32 |
| 🚗 Department of Transportation | -18 | 46 |
| 💉 Health and Humans Services | -8 | 55 |
| 💰 Federal Reserve | -20 | 31 |
| 🕵️ FBI | -15 | 43 |
| 💼 IRS | -35 | 13 |
| 💼 Social Security Admin | 14 | 52 |
| 🕵️♂️ CIA | -8 | 30 |
| ⚖️ Justice Department | -10 | 23 |
| 🛡️ Homeland Security | 4 | 27 |
| 📮 USPS | 48 | 67 |
| 🚀 NASA | 58 | 73 |
| 🏞️ Park Service | 72 | 80 |
| 🎖️ Veterans Affairs | 25 | 32 |
Pew Research Center notes that Republicans didn’t always view the CDC quite so unfavorably, though a direct comparison is impossible.
Nevertheless, per the source, in March 2020, 84% of surveyed Republicans expressed positive views of the CDC’s performance. By October 2022, just 32% said the CDC had done an excellent or good job of handling the pandemic.
Meanwhile, there are a few agencies the two sides do agree on: the National Park Service, the Postal Service, and NASA.
And they both agree on Veterans Affairs as well: though neither share a particularly high opinion of the organization.
Finally, Democrats consistently rate all sixteen agencies on the survey more favorably than Republicans, showing consistency about how each side views the government in general.

-

 Maps7 days ago
Mapped: Southeast Asia’s GDP Per Capita, by Country
-

 Markets2 weeks ago
Visualizing Global Inflation Forecasts (2024-2026)
-

 United States2 weeks ago
Charted: What Southeast Asia Thinks About China & the U.S.
-

 United States2 weeks ago
The Evolution of U.S. Beer Logos
-

 Healthcare1 week ago
What Causes Preventable Child Deaths?
-

 Energy1 week ago
Who’s Building the Most Solar Energy?
-

 Markets1 week ago
Mapped: The Most Valuable Company in Each Southeast Asian Country
-

 Technology1 week ago
Mapped: The Number of AI Startups By Country