Politics
Timeline: Cannabis Legislation in the U.S.
Timeline: Cannabis Legislation in the U.S.
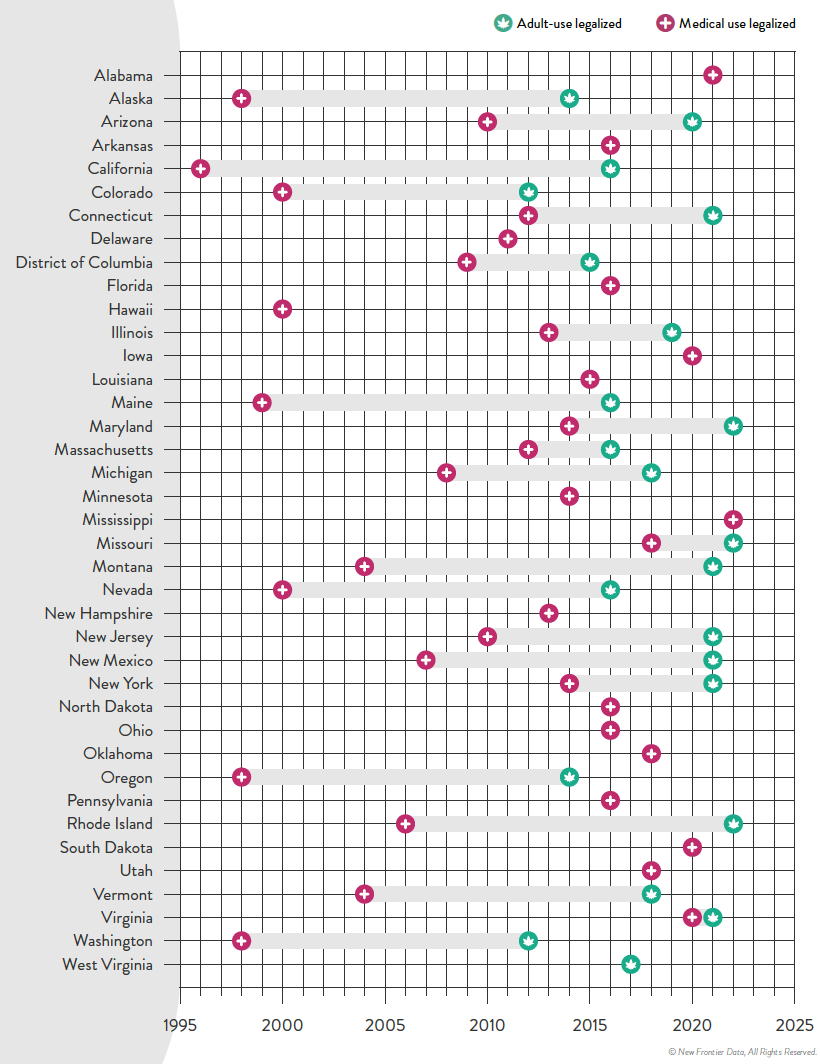
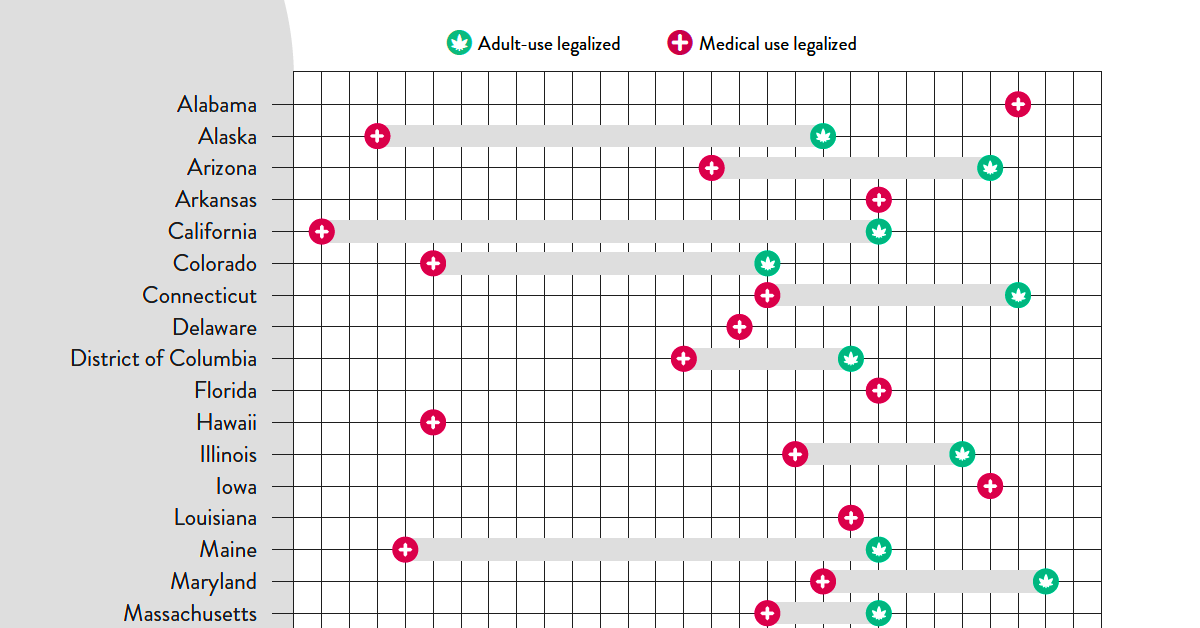
At the federal level, cannabis is still considered an illegal substance. That said, individual states do have the right to determine their own laws around cannabis sales and usage.
This visual from New Frontier Data looks at the status of cannabis in every state and the timeline of when medical and/or recreational use became legal.
Cannabis Through the Years
In the U.S., the oldest legalese concerning cannabis dates back to the 1600s—the colony of Virginia required every farm to grow and produce hemp. Since then, cannabis use was fairly wide open until the 1930s when the Marihuana Tax Act was enforced, prohibiting marijuana federally but still technically allowing medical use.
Jumping ahead, the Controlled Substances Act was passed in 1970, classifying cannabis as Schedule I drug—the same category as heroin. This prohibited any use of the substance.
However, the 1970s also saw a counter movement, wherein many states made the move towards decriminalization. Decriminalization means that although possessing cannabis remained illegal, a person would not be subject to jail time or prosecution for possessing certain amounts.
By the 1990s, some of the first states passed laws to allow the medical usage of cannabis, and by 2012 two states in the U.S.—Washington and Colorado—legalized the recreational use of cannabis.
Cannabis Legislation Today and Beyond
The MORE Act (the Marijuana Opportunity Reinvestment and Expungement Act) was passed in the House early 2022, and if made law, it would decriminalize marijuana federally.
“This bill decriminalizes marijuana. Specifically, it removes marijuana from the list of scheduled substances under the Controlled Substances Act and eliminates criminal penalties for an individual who manufactures, distributes, or possesses marijuana.”– U.S. Congress
Cannabis still remains illegal at the federal level, but at the state levels, cannabis is now fully legal (both for medicinal and recreational purposes) in a total of 22 states.
Over 246 million Americans have legal access to some form of marijuana products with high THC levels. Looking to the future, many new cannabis markets are expected to open up in the next few years:
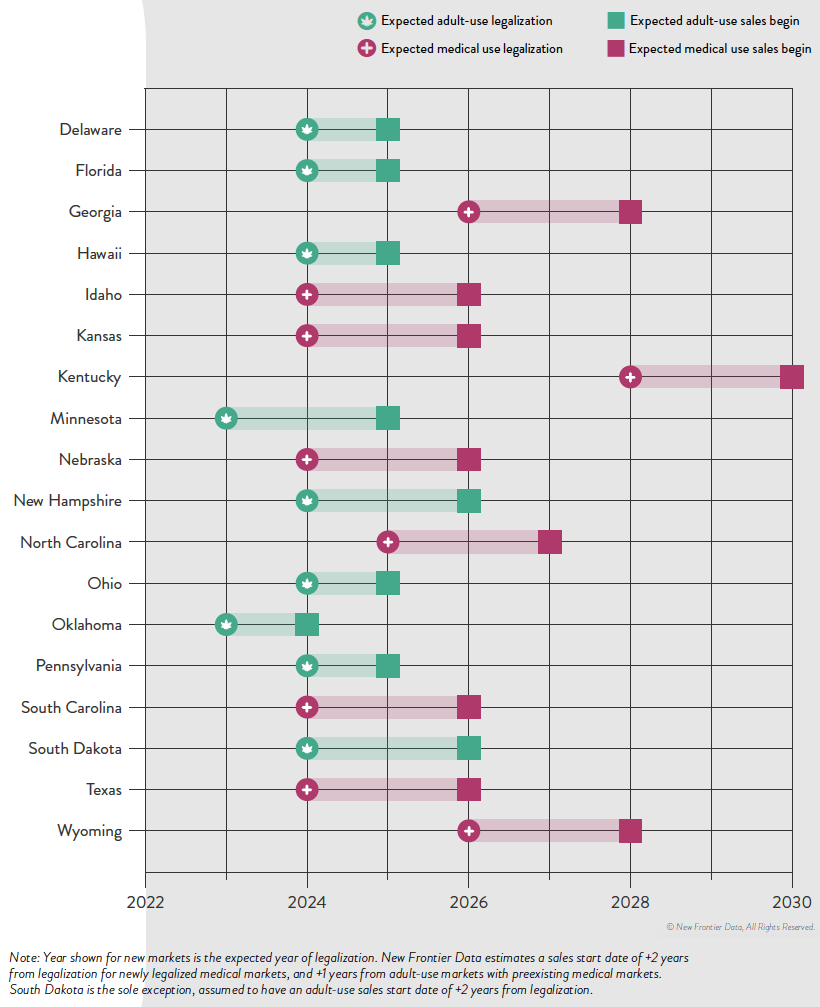
The earliest states expected to open up next for recreational cannabis sales are Minnesota and Oklahoma. There is always a lag between legalization and actual sales, wherein local regulatory bodies and governments set standards. States like Kentucky, on the other hand, aren’t likely to even legalize medicinal cannabis until 2028.
It’s estimated that by 2030, there will be 69 million cannabis consumers in the country, up 33% from 2022.
Overall, the U.S. cannabis market is likely an important one to watch as legal sales hit $30 billion in 2022. By the end of the decade, that number is expected to be anywhere from $58 billion to as much as $72 billion.


Public Opinion
Charted: How Democrats and Republicans View Government Agencies
Predictably, results diverge when both Democrats and Republicans are asked to rate key government agencies in the United States.

How Democrats and Republicans View Government Agencies
This was originally posted on our Voronoi app. Download the app for free on iOS or Android and discover incredible data-driven charts from a variety of trusted sources.
Forget the presidential race, the partisan divide in America can also be seen by how Democrats and Republicans feel about key government agencies.
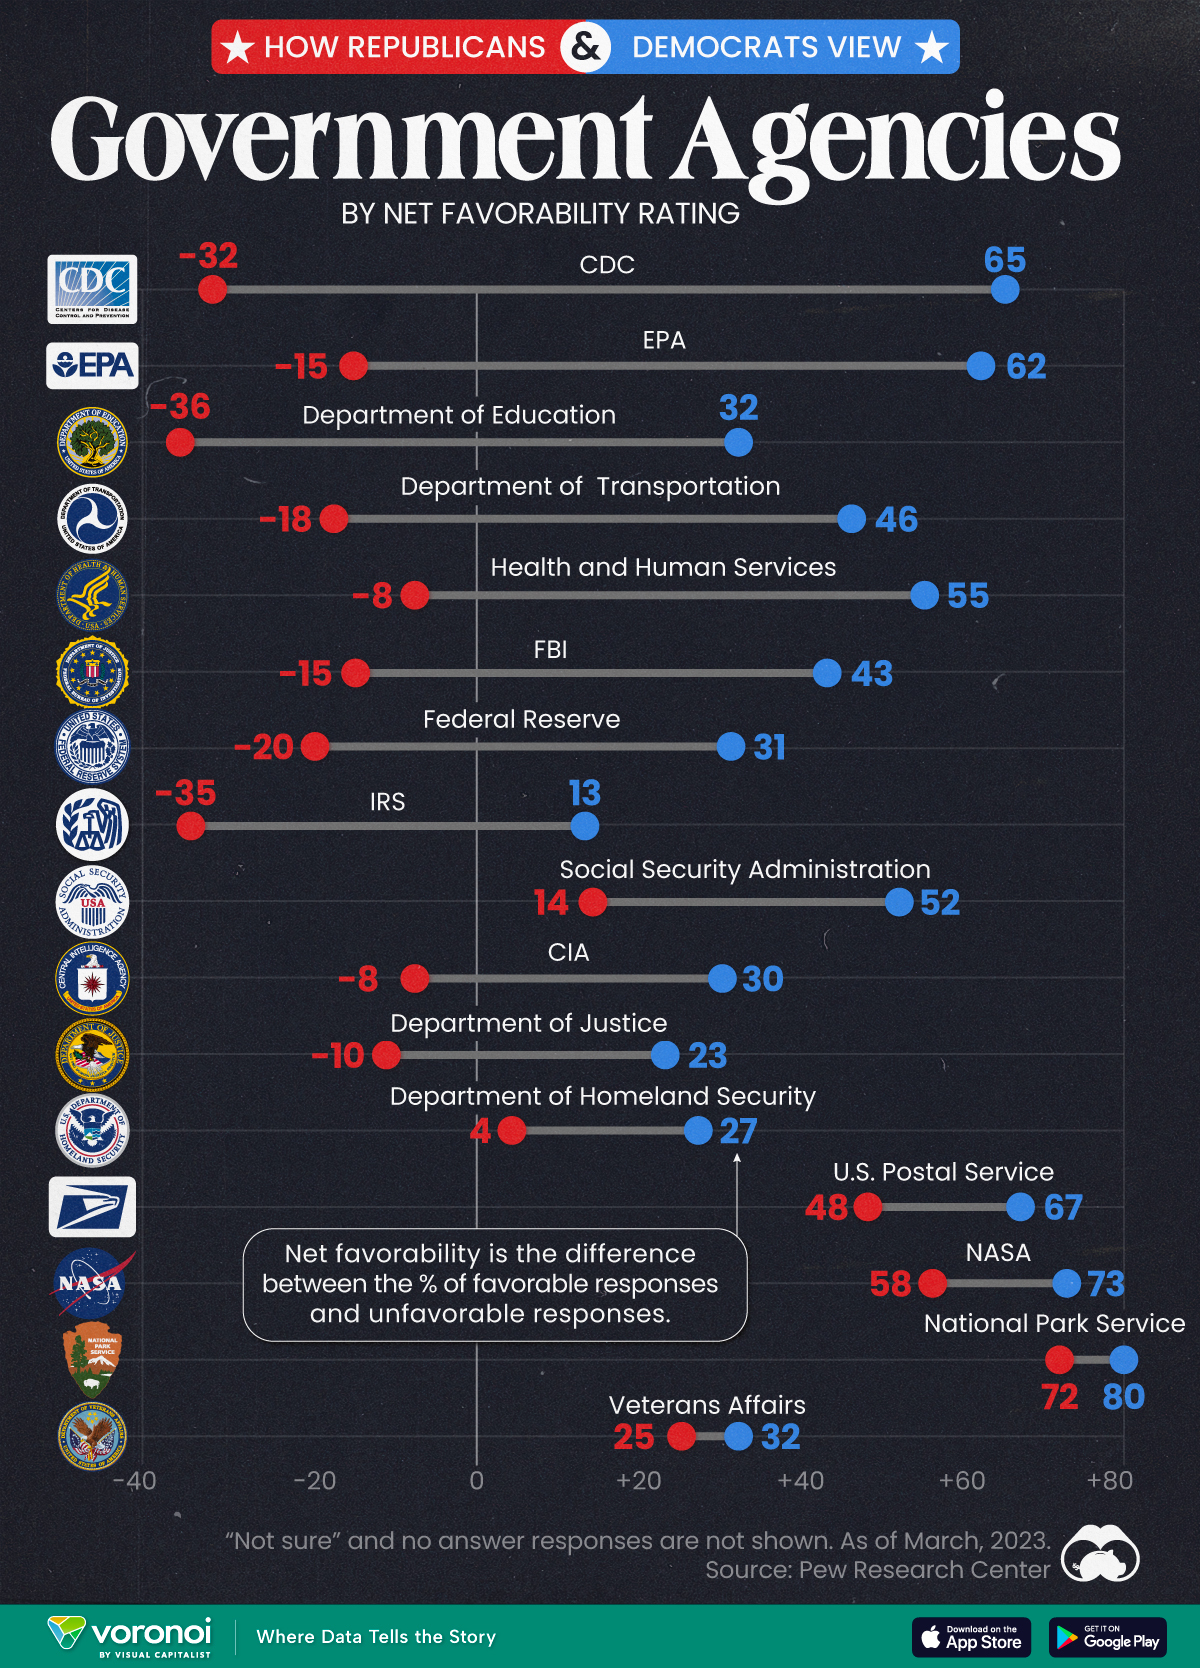
We visualize the net favorability ratings of 16 federal government agencies, based on respondent party affiliation.
To find this data, Pew Research Center surveyed more than 10,000 adults, between March 13-19, 2023. View their methodology page for more details about the survey, the questions asked, and the results obtained.
Republicans Don’t Like How the CDC Handled the Pandemic
The division in net favorability is deepest for three federal government agencies. While the CDC garnered a net favorability rating of 65 from Democrats, more Republicans rated the agency unfavorably, leading to a net favorability rating of -32.
Similarly, with the EPA and the Department of Education, the difference in net favorability between the two voting sides is as high as 70–80 points.
| Federal Agency | Republican Net Favorability Rating | Democrat Net Favorability Rating |
|---|---|---|
| 🔬 CDC | -32 | 65 |
| 🌿 EPA | -15 | 62 |
| 📚 Department of Education | -36 | 32 |
| 🚗 Department of Transportation | -18 | 46 |
| 💉 Health and Humans Services | -8 | 55 |
| 💰 Federal Reserve | -20 | 31 |
| 🕵️ FBI | -15 | 43 |
| 💼 IRS | -35 | 13 |
| 💼 Social Security Admin | 14 | 52 |
| 🕵️♂️ CIA | -8 | 30 |
| ⚖️ Justice Department | -10 | 23 |
| 🛡️ Homeland Security | 4 | 27 |
| 📮 USPS | 48 | 67 |
| 🚀 NASA | 58 | 73 |
| 🏞️ Park Service | 72 | 80 |
| 🎖️ Veterans Affairs | 25 | 32 |
Pew Research Center notes that Republicans didn’t always view the CDC quite so unfavorably, though a direct comparison is impossible.
Nevertheless, per the source, in March 2020, 84% of surveyed Republicans expressed positive views of the CDC’s performance. By October 2022, just 32% said the CDC had done an excellent or good job of handling the pandemic.
Meanwhile, there are a few agencies the two sides do agree on: the National Park Service, the Postal Service, and NASA.
And they both agree on Veterans Affairs as well: though neither share a particularly high opinion of the organization.
Finally, Democrats consistently rate all sixteen agencies on the survey more favorably than Republicans, showing consistency about how each side views the government in general.

-

 Maps7 days ago
Mapped: Southeast Asia’s GDP Per Capita, by Country
-

 Markets2 weeks ago
Visualizing Global Inflation Forecasts (2024-2026)
-

 United States2 weeks ago
Charted: What Southeast Asia Thinks About China & the U.S.
-

 United States2 weeks ago
The Evolution of U.S. Beer Logos
-

 Healthcare1 week ago
What Causes Preventable Child Deaths?
-

 Energy1 week ago
Who’s Building the Most Solar Energy?
-

 Markets1 week ago
Mapped: The Most Valuable Company in Each Southeast Asian Country
-

 Technology1 week ago
Mapped: The Number of AI Startups By Country