Misc
Ranked: The Cities with the Best Work-Life Balance in the World


Ranked: The Cities with the Best Work-Life Balance in the World
While some careers can be relatively stress-free, maintaining a healthy work-life balance can seem impossible for many.
The easy access to technology, blurred boundaries around work and personal time, and fear of job loss push many to work overtime, and fail to use vacation time or sick leave.
However, in some cities across the world, the situation is very different. In top-ranked locales, companies offer working professionals an opportunity to maintain a work-life balance through good healthcare, ample vacation time, and so on.
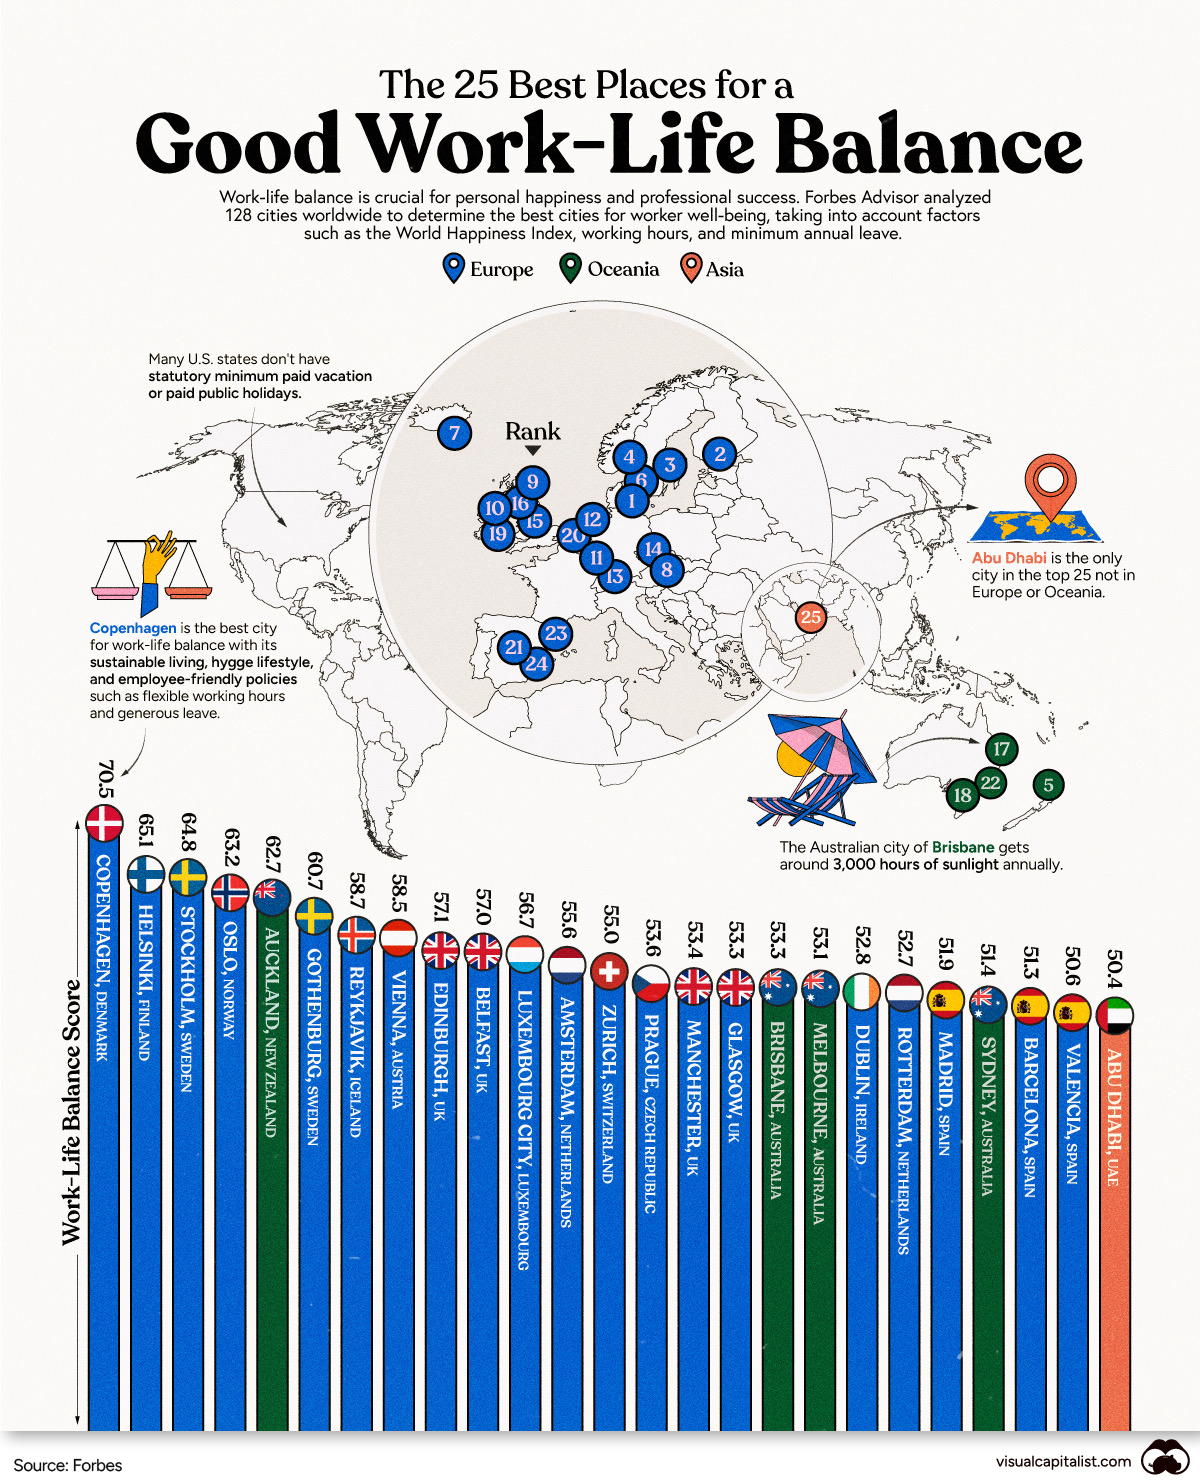
In this graphic, we use the Forbes Advisor 2023 ranking to highlight the top cities in the world that encourage work-life balance. The ranking compares data from 128 cities to form the Work-Life Balance Score, which is marked on a scale of 100. The higher the score, the better work–life balance workers in a city have. We’ve covered the top 25 in the graphic above.
Europe Tops the Chart
Twenty of the 25 cities with the best work-life balance fall in Europe. The diverse range of cultures and lifestyles in these cities offers its residents a balance between work and personal life.
The top city on this list, with a work-life balance score of 70.5/100, is Copenhagen, Denmark. The city’s high standard of living, low unemployment rate, 52-week-long parental leave, and focus on sustainability and green spaces all contribute to the city’s top score. It also helps that the Danish lifestyle focuses on taking time for self-care and relaxation.
Healthy lifestyles along with generous vacation and parental leave policies also placed the European cities of Helsinki, Stockholm, and Oslo in the top five in this list. In fact, the average employee work week in these cities falls below 30 hours. The proportion of remote jobs in Helsinki, Finland is over 50%.
Many companies in Europe prioritize employee well-being, which has led to the emergence of a wellness culture. This culture includes practices such as remote work and mental health support.
Balancing Work and Life in Oceania
Although Europe dominates the top 25 list, some cities in Oceania also boast of healthy work-life balance scores.
Ranked 5th on the list of cities with the best work-life balance, workers in Auckland, New Zealand, have a 26.3-hour work week on average and a year’s worth of parental leave.
Meanwhile, the cities of Brisbane (53.3), Melbourne (53.1), and Sydney (51.4) in Australia follow an average work week of 32.4 hours to 38 hours. The sunny weather in these cities also positively influences their scores.
For Some, Safety is Key
UAE’s capital city is the only Asian city to make it to this top 25 list, and this is despite its high property prices and relatively low number of vacation days available to workers. On the flip side, the city is safe, sunny, and boasts a high quality of life.
Where Does This Data Come From?
Source: Forbes Advisor’s Work-Life Balance Index 2023
Data notes: This ranking the data from 128 cities to form the Work-Life Balance Score, which is marked on a scale of 100. The study analyzed various “Best Cities to Live In” indices, narrowing down those which had available data in the following key categories between January and February 2023. The following indices and metrics were used: World Happiness Index, Gender Inequality Index, Average working hours, minimum legal annual leave, property price to income ratio, proportion of remote working vacancies, maternity leave policies, parks and nature reserves per capita, unemployment rate, sunlight hours. Data was collected between January – Feb 2023. See the source for full details.


Public Opinion
Charted: How Democrats and Republicans View Government Agencies
Predictably, results diverge when both Democrats and Republicans are asked to rate key government agencies in the United States.

How Democrats and Republicans View Government Agencies
This was originally posted on our Voronoi app. Download the app for free on iOS or Android and discover incredible data-driven charts from a variety of trusted sources.
Forget the presidential race, the partisan divide in America can also be seen by how Democrats and Republicans feel about key government agencies.
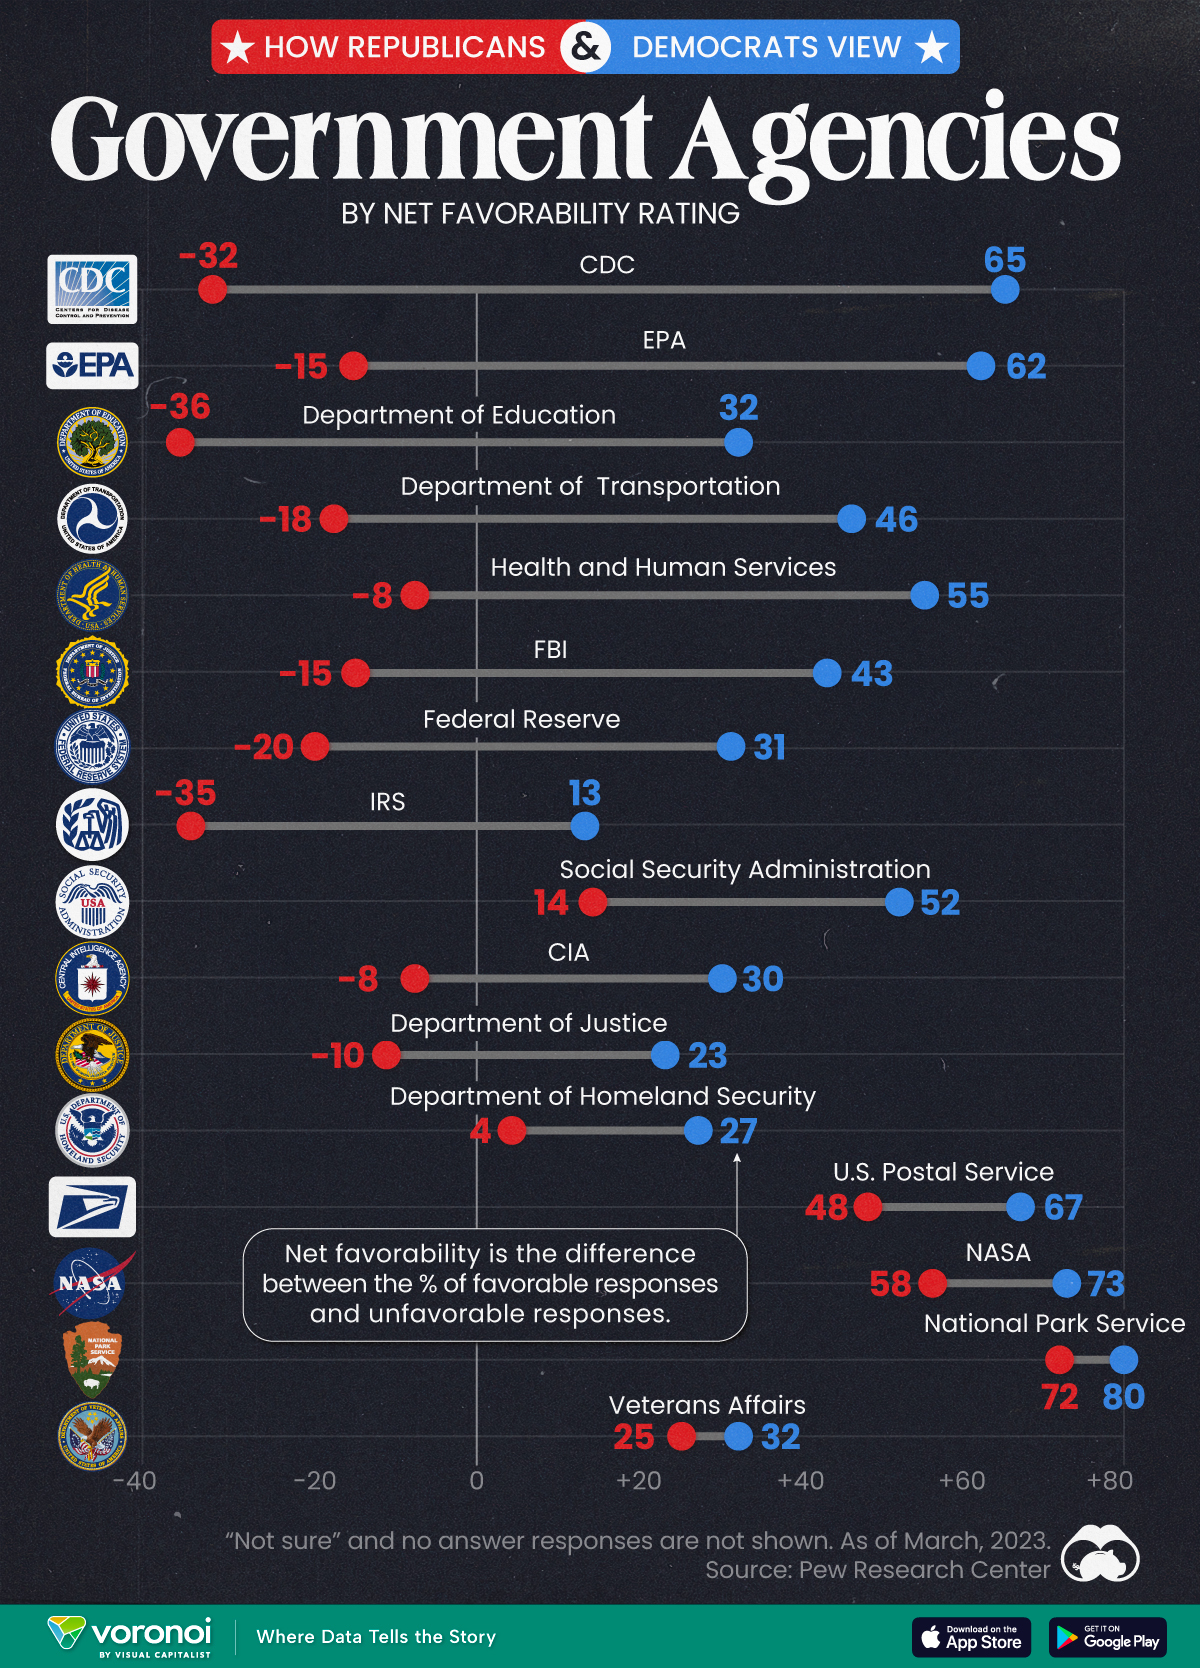
We visualize the net favorability ratings of 16 federal government agencies, based on respondent party affiliation.
To find this data, Pew Research Center surveyed more than 10,000 adults, between March 13-19, 2023. View their methodology page for more details about the survey, the questions asked, and the results obtained.
Republicans Don’t Like How the CDC Handled the Pandemic
The division in net favorability is deepest for three federal government agencies. While the CDC garnered a net favorability rating of 65 from Democrats, more Republicans rated the agency unfavorably, leading to a net favorability rating of -32.
Similarly, with the EPA and the Department of Education, the difference in net favorability between the two voting sides is as high as 70–80 points.
| Federal Agency | Republican Net Favorability Rating | Democrat Net Favorability Rating |
|---|---|---|
| 🔬 CDC | -32 | 65 |
| 🌿 EPA | -15 | 62 |
| 📚 Department of Education | -36 | 32 |
| 🚗 Department of Transportation | -18 | 46 |
| 💉 Health and Humans Services | -8 | 55 |
| 💰 Federal Reserve | -20 | 31 |
| 🕵️ FBI | -15 | 43 |
| 💼 IRS | -35 | 13 |
| 💼 Social Security Admin | 14 | 52 |
| 🕵️♂️ CIA | -8 | 30 |
| ⚖️ Justice Department | -10 | 23 |
| 🛡️ Homeland Security | 4 | 27 |
| 📮 USPS | 48 | 67 |
| 🚀 NASA | 58 | 73 |
| 🏞️ Park Service | 72 | 80 |
| 🎖️ Veterans Affairs | 25 | 32 |
Pew Research Center notes that Republicans didn’t always view the CDC quite so unfavorably, though a direct comparison is impossible.
Nevertheless, per the source, in March 2020, 84% of surveyed Republicans expressed positive views of the CDC’s performance. By October 2022, just 32% said the CDC had done an excellent or good job of handling the pandemic.
Meanwhile, there are a few agencies the two sides do agree on: the National Park Service, the Postal Service, and NASA.
And they both agree on Veterans Affairs as well: though neither share a particularly high opinion of the organization.
Finally, Democrats consistently rate all sixteen agencies on the survey more favorably than Republicans, showing consistency about how each side views the government in general.

-

 Maps7 days ago
Mapped: Southeast Asia’s GDP Per Capita, by Country
-

 Markets2 weeks ago
Visualizing Global Inflation Forecasts (2024-2026)
-

 United States2 weeks ago
Charted: What Southeast Asia Thinks About China & the U.S.
-

 United States2 weeks ago
The Evolution of U.S. Beer Logos
-

 Healthcare2 weeks ago
What Causes Preventable Child Deaths?
-

 Energy1 week ago
Who’s Building the Most Solar Energy?
-

 Markets1 week ago
Mapped: The Most Valuable Company in Each Southeast Asian Country
-

 Technology1 week ago
Mapped: The Number of AI Startups By Country