Markets
The Top 50 Largest Importers in the World
The Top 50 Largest Importers in the World
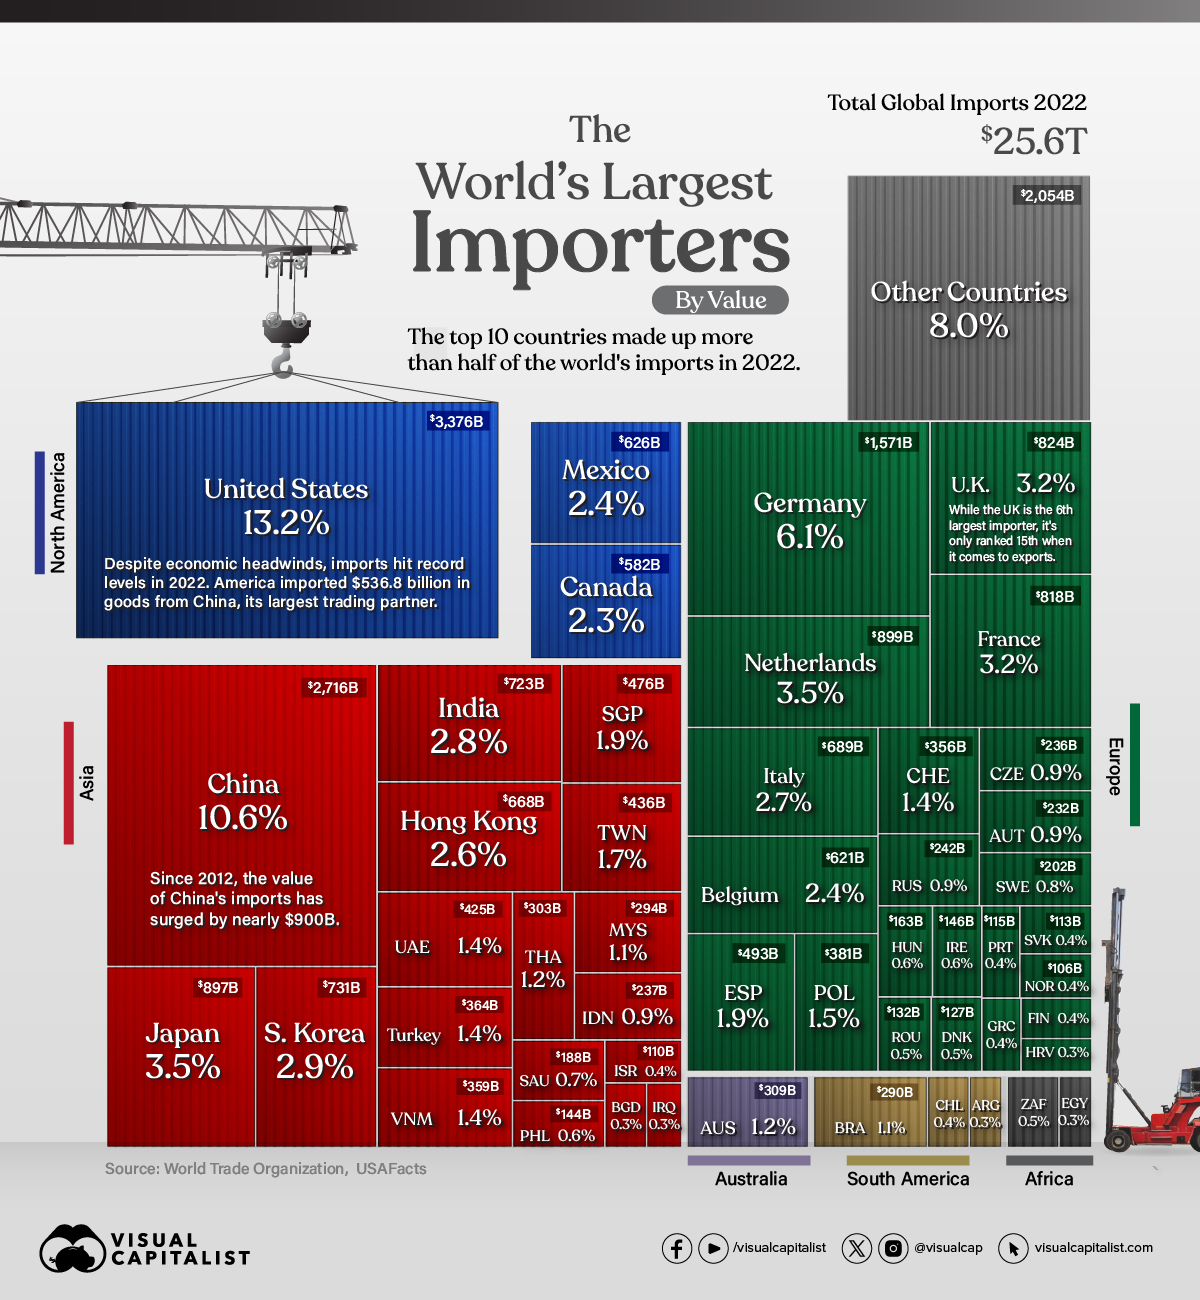
In 2022, global imports climbed to $25.6 trillion in value, or about the size of the U.S. GDP.
As an engine of growth, global trade broadens consumer choices and can lower the cost of goods. For businesses, it can improve the quality of inputs and strengthen competitiveness.
This graphic shows the 50 largest importers, with data from the World Trade Organization.
Which Countries Import the Most Goods?
With $3.4 trillion in imports in 2022, the U.S. is the largest importer globally.
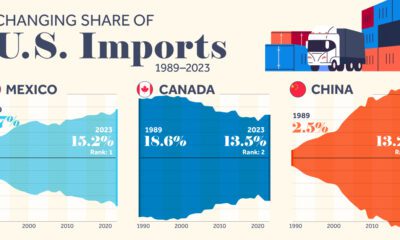
Even though higher inflation and market uncertainty loomed over the economy, U.S. imports increased 15% annually, with China as its top goods importing partner.
| Country | Value 2022 | Share | Annual % Change |
|---|---|---|---|
| 🇺🇸 U.S. | $3,376B | 13.2% | 15.0% |
| 🇨🇳 China | $2,716B | 10.6% | 1.0% |
| 🇩🇪 Germany | $1,571B | 6.1% | 11.0% |
| 🇳🇱 Netherlands | $899B | 3.5% | 19.0% |
| 🇯🇵 Japan | $897B | 3.5% | 17.0% |
| 🇬🇧 UK | $824B | 3.2% | 19.0% |
| 🇫🇷 France | $818B | 3.2% | 14.0% |
| 🇰🇷 South Korea | $731B | 2.9% | 19.0% |
| 🇮🇳 India | $723B | 2.8% | 26.0% |
| 🇮🇹 Italy | $689B | 2.7% | 22.0% |
| 🇭🇰 Hong Kong SAR | $668B | 2.6% | -6.0% |
| 🇲🇽 Mexico | $626B | 2.4% | 20.0% |
| 🇧🇪 Belgium | $621B | 2.4% | 18.0% |
| 🇨🇦 Canada | $582B | 2.3% | 15.0% |
| 🇪🇸 Spain | $493B | 1.9% | 18.0% |
| 🇸🇬 Singapore | $476B | 1.9% | 17.0% |
| 🇹🇼 Taiwan | $436B | 1.7% | 14.0% |
| 🇦🇪 UAE | $425B | 1.4% | 12.0% |
| 🇵🇱 Poland | $381B | 1.5% | 11.0% |
| 🇹🇷 Turkey | $364B | 1.4% | 34.0% |
| 🇻🇳 Viet Nam | $359B | 1.4% | 8.0% |
| 🇨🇭 Switzerland | $356B | 1.4% | 10.0% |
| 🇦🇺 Australia | $309B | 1.2% | 18.0% |
| 🇹🇭 Thailand | $303B | 1.2% | 14.0% |
| 🇲🇾 Malaysia | $294B | 1.1% | 24.0% |
| 🇧🇷 Brazil | $290B | 1.1% | 25.0% |
| 🇷🇺 Russia | $242B | 0.9% | -21.0% |
| 🇮🇩 Indonesia | $237B | 0.9% | 21.0% |
| 🇨🇿 Czech Republic | $236B | 0.9% | 11.0% |
| 🇦🇹 Austria | $232B | 0.9% | 6.0% |
| 🇸🇪 Sweden | $202B | 0.8% | 8.0% |
| 🇸🇦 Saudi Arabia | $188B | 0.7% | 23.0% |
| 🇭🇺 Hungary | $163B | 0.6% | 14.0% |
| 🇮🇪 Ireland | $146B | 0.6% | 21.0% |
| 🇵🇭 Philippines | $144B | 0.6% | 26.0% |
| 🇿🇦 South Africa | $136B | 0.5% | 19.0% |
| 🇷🇴 Romania | $132B | 0.5% | 14.0% |
| 🇩🇰 Denmark | $127B | 0.5% | 5.0% |
| 🇵🇹 Portugal | $115B | 0.4% | 17.0% |
| 🇸🇰 Slovak Republic | $113B | 0.4% | 9.0% |
| 🇮🇱 Israel | $110B | 0.4% | 16.0% |
| 🇳🇴 Norway | $106B | 0.4% | 8.0% |
| 🇨🇱 Chile | $104B | 0.4% | 13.0% |
| 🇬🇷 Greece | $98B | 0.4% | 27.0% |
| 🇫🇮 Finland | $97B | 0.4% | 13.0% |
| 🇧🇩 Bangladesh | $89B | 0.3% | 10.0% |
| 🇪🇬 Egypt | $86B | 0.3% | 27.0% |
| 🇦🇷 Argentina | $82B | 0.3% | 19.0% |
| 🇮🇶 Iraq | $78B | 0.3% | 18.0% |
| 🇭🇷 Croatia | $77B | 0.3% | 27.0% |
| Rest of World | $2,054B | 8.0% | |
| 🌎 World | $25,621B | 100.0% | 13.0% |
As the world’s second-largest economy, China’s imports hit $2.7 trillion in value, although growth slowed in 2022.
Taiwan, China’s top trading partner for imports, is a major provider of electronics products, including semiconductor chips. However, the China-Taiwan trade relationship remains complicated given geopolitical tensions sparking unexpected import bans.
A handful of European countries also fell in the top 10 importers, led by Germany and the Netherlands. Overall, the European Union is the largest importer of agricultural products, fuels and mining products, and automotive products globally.
Global Trade Fragmentation
In 2023, the World Trade Organization projects that import volumes will contract as much as 1.2% across North and South America, Asia, and Europe.
In part, this is being driven by slower demand in manufacturing economies.
Whether or not this weaker volume is also being impacted by trade fragmentation remains unclear. One indicator may be seen in the trade of intermediate goods, which are products like wood and steel that are used in the production of a final good.
In the first half of 2023, the share of intermediate goods in world trade dropped to 48.5%, down from its three-year average of 51%. On the one hand, this may suggest that supply chains are contracting. Yet it may also be due to the influence of higher commodity prices, which have a bigger impact on the cost of intermediate goods than on final goods.
Still, other factors have an impact on the flow of trade. These include subsidies, export bans, and legislative policy, such as the $52.7 billion U.S. CHIPS Act, that incentivizes local production of semiconductors.
Considering these factors, broader trends of global de-globalization remain to be seen.


Markets
Top 10 Countries Most in Debt to the IMF
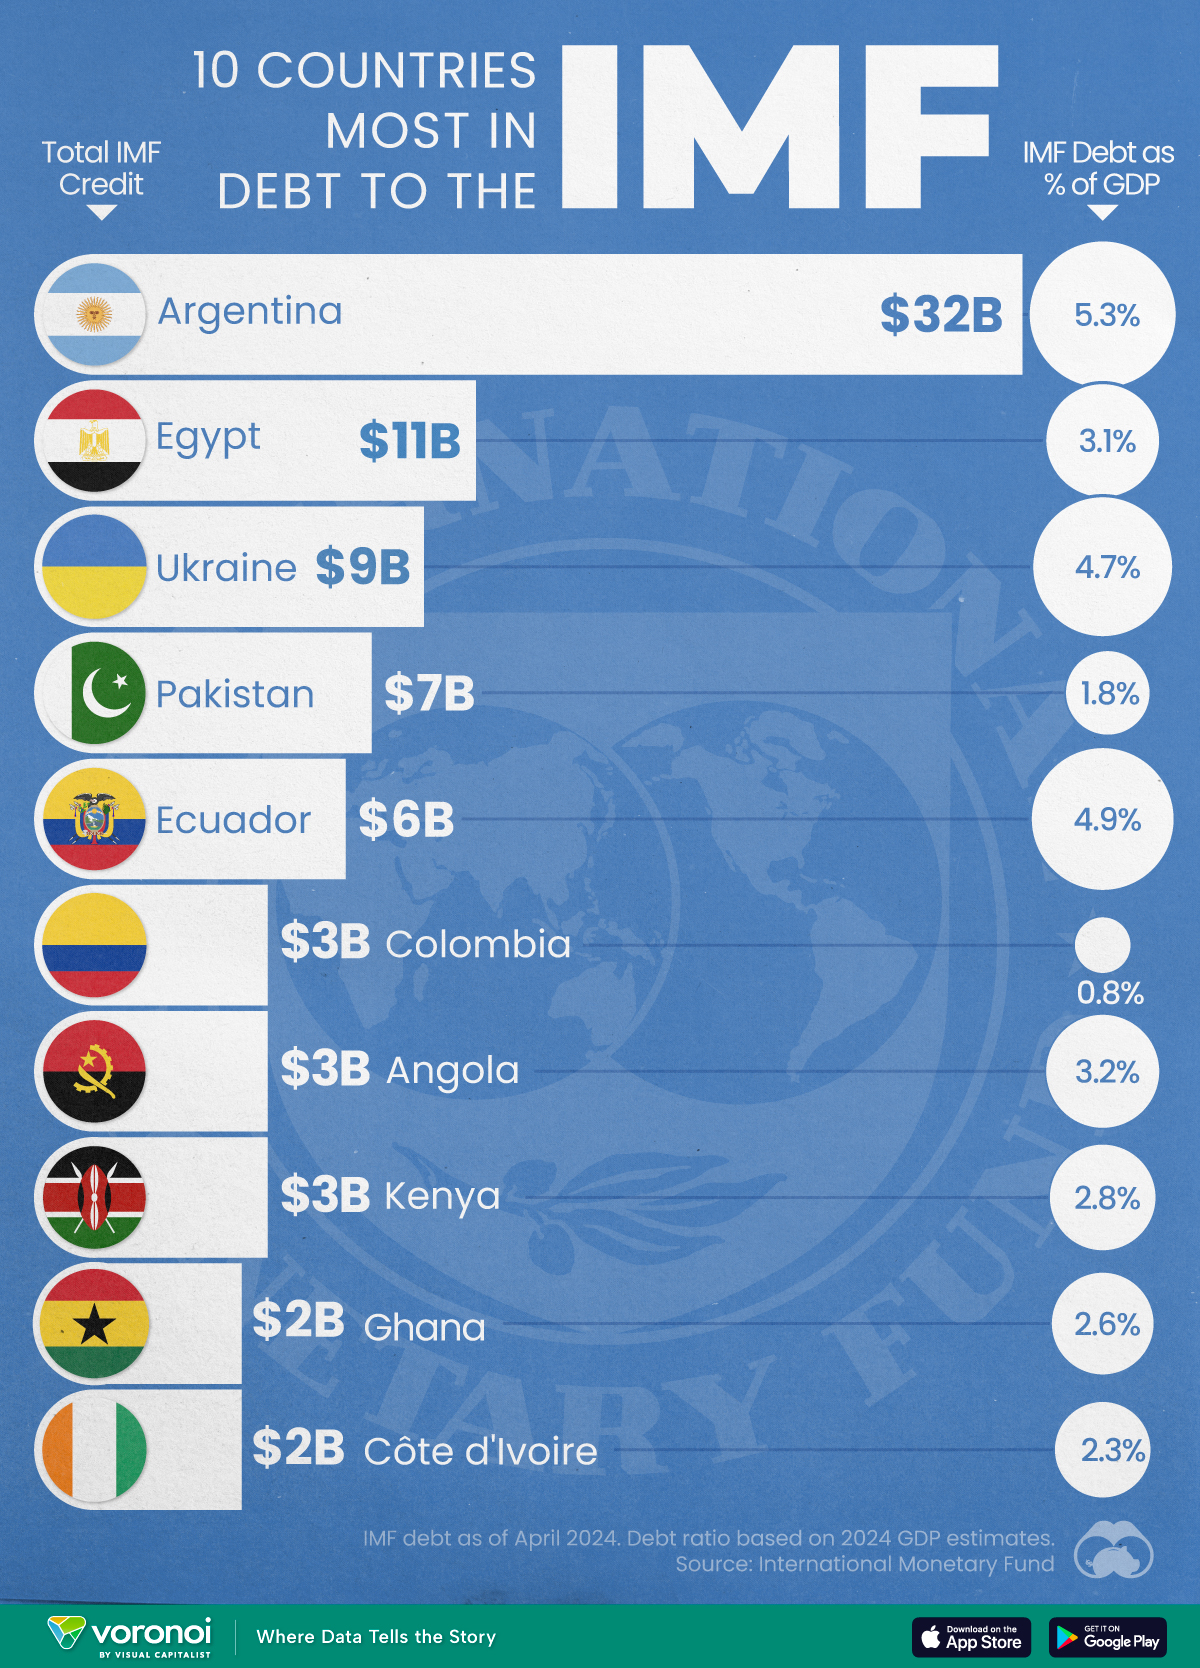
Argentina tops the ranking, with a debt equivalent to 5.3% of the country’s GDP.
Top 10 Countries Most in Debt to the IMF
This was originally posted on our Voronoi app. Download the app for free on iOS or Android and discover incredible data-driven charts from a variety of trusted sources.
Established in 1944, the International Monetary Fund (IMF) supports countries’ economic growth by providing financial aid and guidance on policies to enhance stability, productivity, and job opportunities.
Countries seek loans from the IMF to address economic crises, stabilize their currencies, implement structural reforms, and alleviate balance of payments difficulties.
In this graphic, we visualize the 10 countries most indebted to the fund.
Methodology
We compiled this ranking using the International Monetary Fund’s data on Total IMF Credit Outstanding. We selected the latest debt data for each country, accurate as of April 29, 2024.
Argentina Tops the Rank
Argentina’s debt to the IMF is equivalent to 5.3% of the country’s GDP. In total, the country owns more than $32 billion.
| Country | IMF Credit Outstanding ($B) | GDP ($B, 2024) | IMF Debt as % of GDP |
|---|---|---|---|
| 🇦🇷 Argentina | 32 | 604.3 | 5.3 |
| 🇪🇬 Egypt | 11 | 347.6 | 3.1 |
| 🇺🇦 Ukraine | 9 | 188.9 | 4.7 |
| 🇵🇰 Pakistan | 7 | 374.7 | 1.8 |
| 🇪🇨 Ecuador | 6 | 121.6 | 4.9 |
| 🇨🇴 Colombia | 3 | 386.1 | 0.8 |
| 🇦🇴 Angola | 3 | 92.1 | 3.2 |
| 🇰🇪 Kenya | 3 | 104.0 | 2.8 |
| 🇬🇭 Ghana | 2 | 75.2 | 2.6 |
| 🇨🇮 Ivory Coast | 2 | 86.9 | 2.3 |
A G20 member and major grain exporter, the country’s history of debt trouble dates back to the late 1890s when it defaulted after contracting debts to modernize the capital, Buenos Aires. It has already been bailed out over 20 times in the last six decades by the IMF.
Five of the 10 most indebted countries are in Africa, while three are in South America.
The only European country on our list, Ukraine has relied on international support amidst the conflict with Russia. It is estimated that Russia’s full-scale invasion of the country caused the loss of a third of the country’s economy. The country owes $9 billion to the IMF.
In total, almost 100 countries owe money to the IMF, and the grand total of all of these debts is $111 billion. The above countries (top 10) account for about 69% of these debts.

-

 Maps7 days ago
Mapped: Southeast Asia’s GDP Per Capita, by Country
-

 Markets2 weeks ago
Visualizing Global Inflation Forecasts (2024-2026)
-

 United States2 weeks ago
Charted: What Southeast Asia Thinks About China & the U.S.
-

 United States2 weeks ago
The Evolution of U.S. Beer Logos
-

 Healthcare1 week ago
What Causes Preventable Child Deaths?
-

 Energy1 week ago
Who’s Building the Most Solar Energy?
-

 Markets1 week ago
Mapped: The Most Valuable Company in Each Southeast Asian Country
-

 Technology1 week ago
Mapped: The Number of AI Startups By Country