Money
The World’s Richest Countries Across 3 Metrics
![]() See this visualization first on the Voronoi app.
See this visualization first on the Voronoi app.
The World’s Richest Countries Across 3 Metrics
This was originally posted on our Voronoi app. Download the app for free on iOS or Android and discover incredible data-driven charts from a variety of trusted sources.
How do you measure the economic success of a country?
By one classic measure, GDP per capita shows individual economic prosperity. But comparing countries simply by this metric doesn’t tell the whole story. To get a better idea of living standards, it helps to look at how far your money will go along with adjusting for labor productivity.
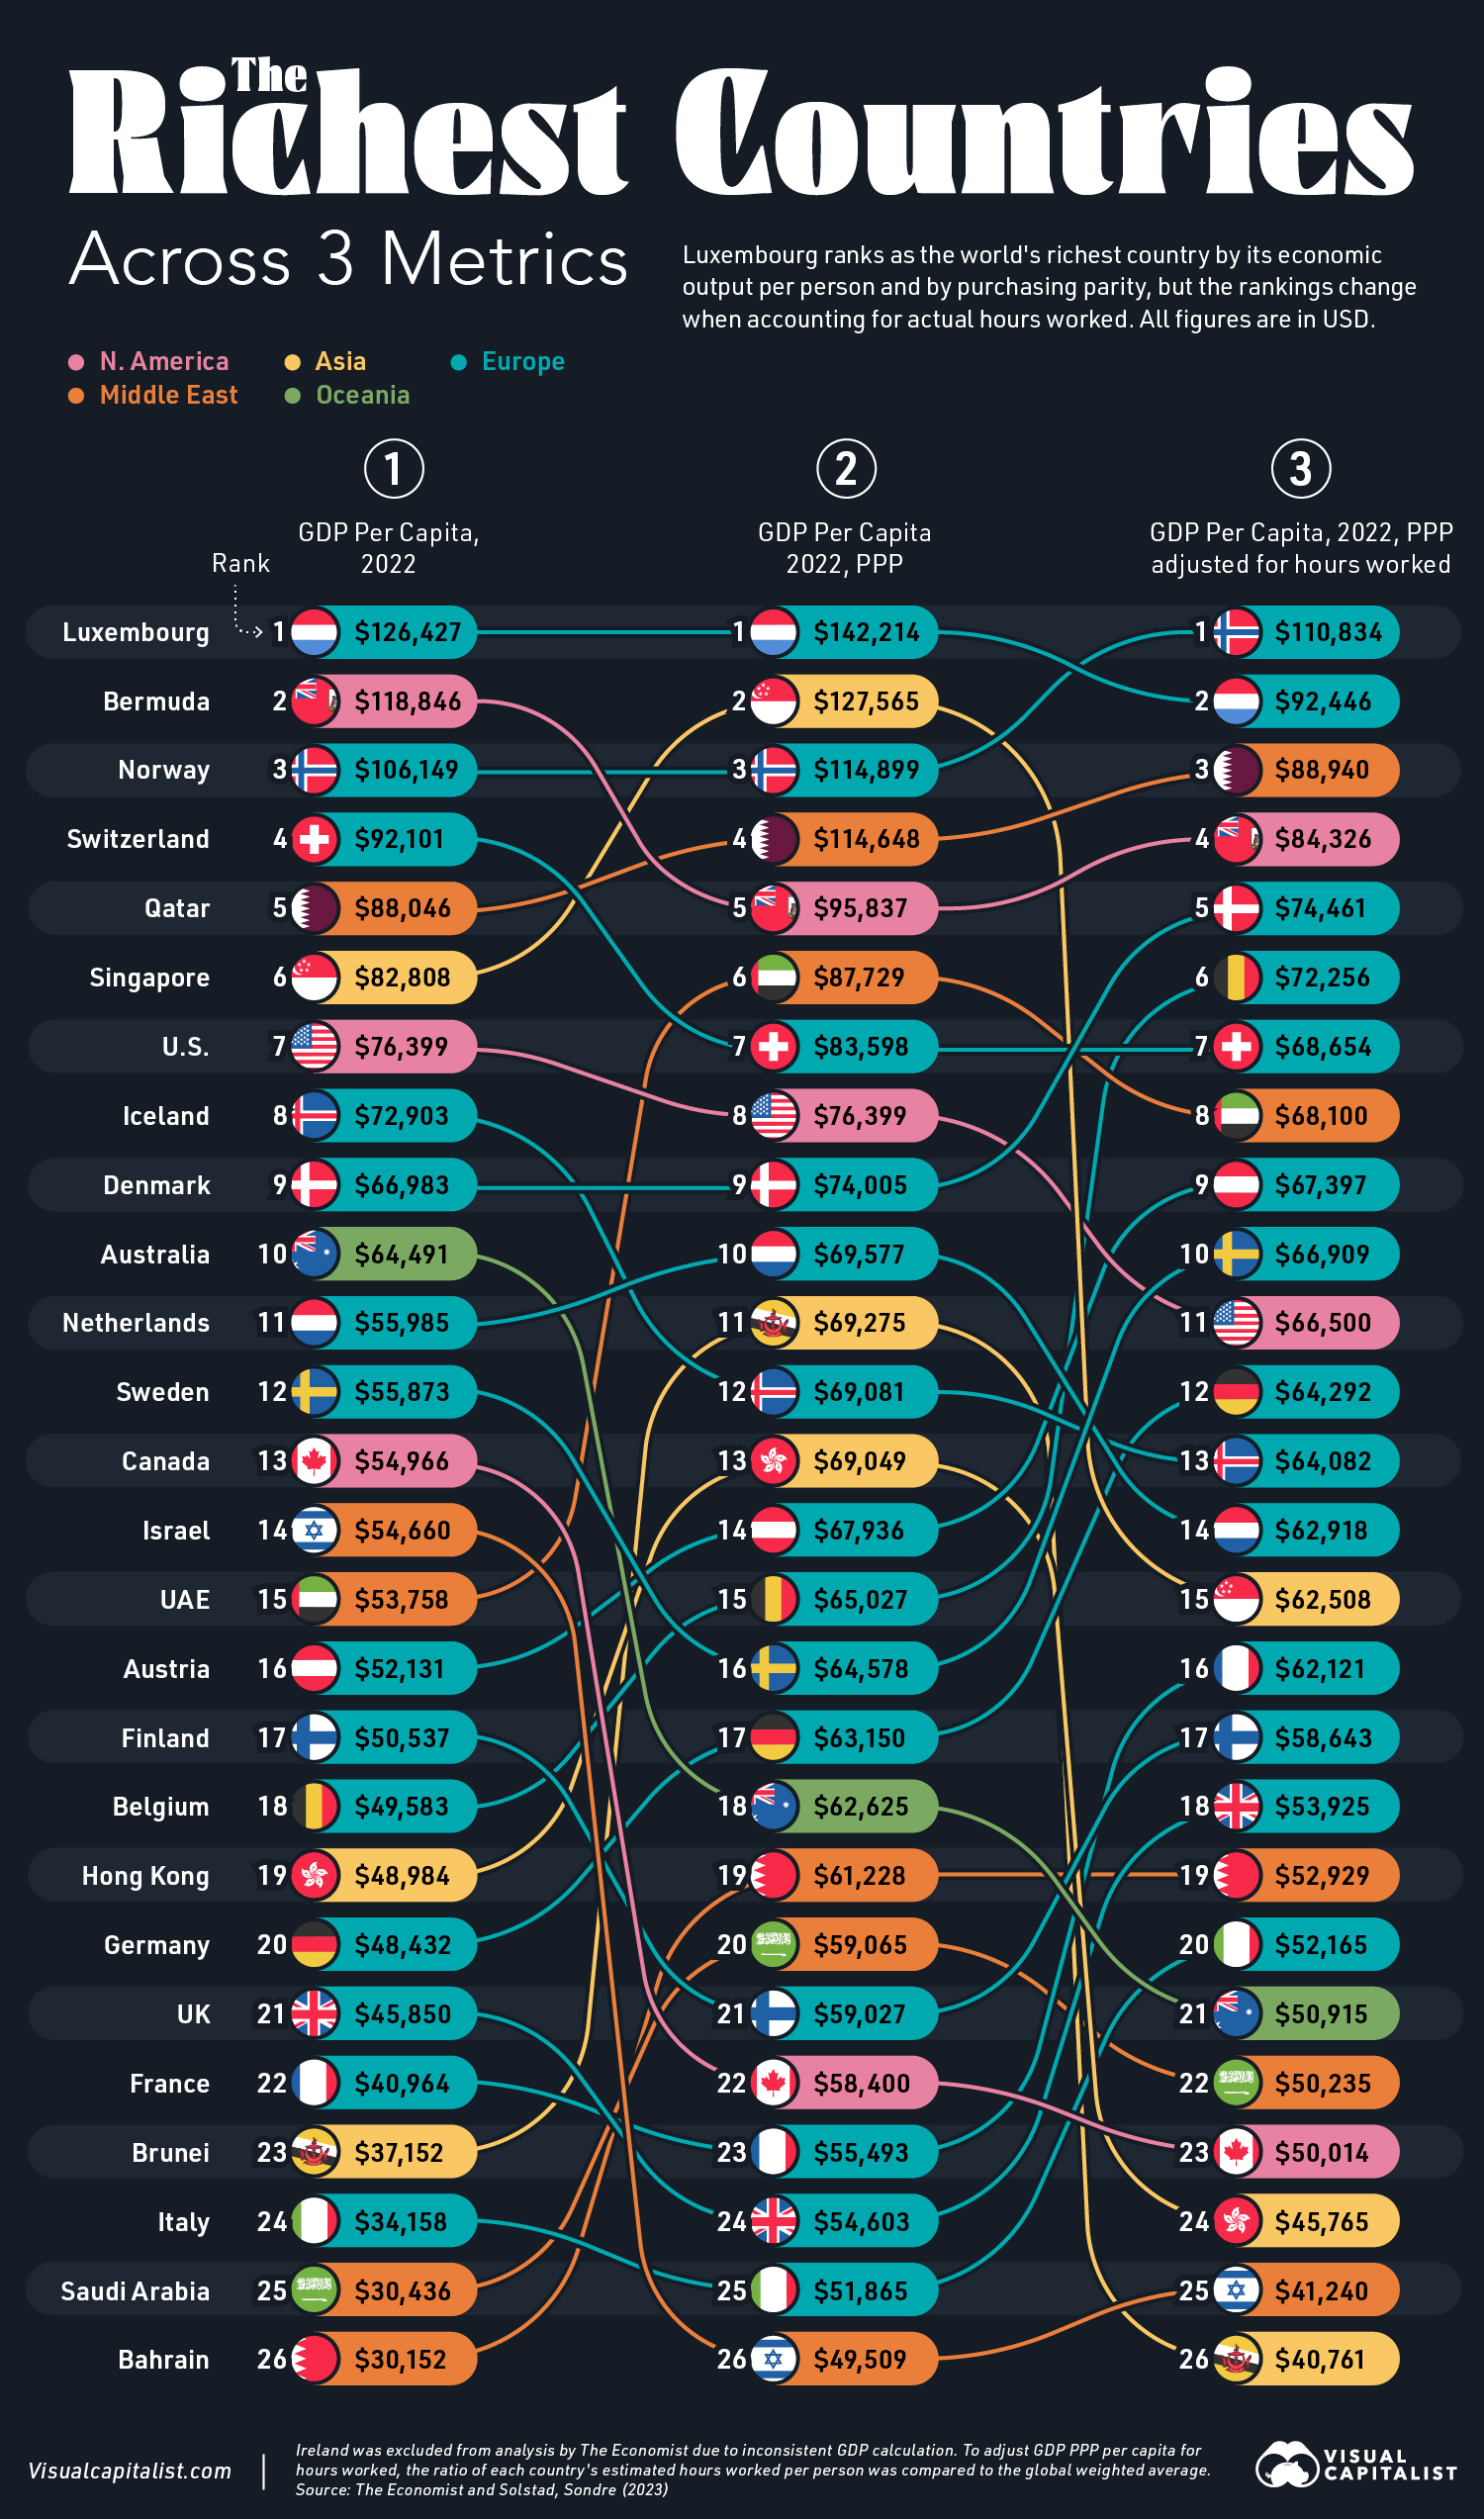
This graphic shows the world’s richest countries by three different measures, based on data from The Economist and Sondre Solstad. All figures are in U.S. dollars.
World’s Richest Countries, by GDP per Capita
As the table below shows, smaller countries fare much better—of the top 10 richest countries, eight of them have populations under 10 million people.
| Rank | Country | GDP per Capita 2022 |
|---|---|---|
| 1 | 🇱🇺 Luxembourg | $126,426 |
| 2 | 🇧🇲 Bermuda | $118,846 |
| 3 | 🇳🇴 Norway | $106,149 |
| 4 | 🇨🇭 Switzerland | $92,101 |
| 5 | 🇶🇦 Qatar | $88,046 |
| 6 | 🇸🇬 Singapore | $82,808 |
| 7 | 🇺🇸 United States | $76,399 |
| 8 | 🇮🇸 Iceland | $72,903 |
| 9 | 🇩🇰 Denmark | $66,983 |
| 10 | 🇦🇺 Australia | $64,491 |
| 11 | 🇳🇱 Netherlands | $55,985 |
| 12 | 🇸🇪 Sweden | $55,873 |
| 13 | 🇨🇦 Canada | $54,966 |
| 14 | 🇮🇱 Israel | $54,660 |
| 15 | 🇦🇪 UAE | $53,758 |
| 16 | 🇦🇹 Austria | $52,131 |
| 17 | 🇫🇮 Finland | $50,537 |
| 18 | 🇧🇪 Belgium | $49,583 |
| 19 | 🇭🇰 Hong Kong SAR | $48,984 |
| 20 | 🇩🇪 Germany | $48,432 |
| 21 | 🇬🇧 UK | $45,850 |
| 22 | 🇫🇷 France | $40,964 |
| 23 | 🇧🇳 Brunei Darussalam | $37,152 |
| 24 | 🇮🇹 Italy | $34,158 |
| 25 | 🇸🇦 Saudi Arabia | $30,436 |
| 26 | 🇧🇭 Bahrain | $30,152 |
Luxembourg, whose financial sector makes up 25% of its GDP, is the world’s richest country by GDP per capita.
With a population of just 660,000, the country is also considered a tax haven, incentivizing foreign investment due to its favorable tax policies. Due to the small nation’s considerable wealth, its citizens enjoy free education, healthcare, and transportation.
Bermuda, like Luxembourg, is known as a tax haven. Several multinationals shelter billions in the island nation—including Google, which moved $23 billion in a shell company in 2017 to lower foreign tax costs.
With a GDP per capita of $82,808, Singapore is the richest country in Asia thanks to its role as a global hub for finance, trade, and tourism.
A New Lens: Purchasing Power Parity (PPP)
Another way to compare countries adjusts GDP per capita based on the relative price of goods and services in order to account for differences in the cost of living and local currency strength.
This provides a clearer comparison of living standards across countries since the value of a dollar can buy more goods in different countries. Below, we show how countries perform differently based on this measure, known as GDP per capita adjusted by purchasing power parity (PPP):
| Rank | Country | GDP per Capita 2022, PPP |
|---|---|---|
| 1 | 🇱🇺 Luxembourg | $142,214 |
| 2 | 🇸🇬 Singapore | $127,565 |
| 3 | 🇳🇴 Norway | $114,899 |
| 4 | 🇶🇦 Qatar | $114,648 |
| 5 | 🇧🇲 Bermuda | $95,837 |
| 6 | 🇦🇪 UAE | $87,729 |
| 7 | 🇨🇭 Switzerland | $83,598 |
| 8 | 🇺🇸 United States | $76,399 |
| 9 | 🇩🇰 Denmark | $74,005 |
| 10 | 🇳🇱 Netherlands | $69,577 |
| 11 | 🇧🇳 Brunei Darussalam | $69,275 |
| 12 | 🇮🇸 Iceland | $69,081 |
| 13 | 🇭🇰 Hong Kong SAR | $69,049 |
| 14 | 🇦🇹 Austria | $67,936 |
| 15 | 🇧🇪 Belgium | $65,027 |
| 16 | 🇸🇪 Sweden | $64,578 |
| 17 | 🇩🇪 Germany | $63,150 |
| 18 | 🇦🇺 Australia | $62,625 |
| 19 | 🇧🇭 Bahrain | $61,228 |
| 20 | 🇸🇦 Saudi Arabia | $59,065 |
| 21 | 🇫🇮 Finland | $59,027 |
| 22 | 🇨🇦 Canada | $58,400 |
| 23 | 🇫🇷 France | $55,493 |
| 24 | 🇬🇧 UK | $54,603 |
| 25 | 🇮🇹 Italy | $51,865 |
| 26 | 🇮🇱 Israel | $49,509 |
As we can see, Singapore significantly jumps up the ranking, when adjusting for PPP.
Looking at the world’s richest countries this way shows that living standards are high in Singapore since their currency can go further than in other countries. Often, richer countries will have higher prices as a result of higher labor productivity, advanced technology, and other factors.
Similarly, the UAE rises into the top 10, outpacing both Switzerland and America. As one of the top oil-producing countries worldwide, it made $100 billion in oil revenues in 2022, equal to about $100,000 per citizen.
World’s Richest Countries, Adjusted for Hours Worked
How do the rankings change when accounting for productivity?
To analyze this, GDP per capita on a PPP basis is adjusted by the estimated hours worked per person. Economies that have high quality, productive workforces with strong standards of living tend to rank well using this measure.
| Rank | Country | GDP per Capita 2022, PPP adjusted for hours worked |
|---|---|---|
| 1 | 🇳🇴 Norway | $110,834 |
| 2 | 🇱🇺 Luxembourg | $92,446 |
| 3 | 🇶🇦 Qatar | $88,940 |
| 4 | 🇧🇲 Bermuda | $84,326 |
| 5 | 🇩🇰 Denmark | $74,461 |
| 6 | 🇧🇪 Belgium | $72,256 |
| 7 | 🇨🇭 Switzerland | $68,654 |
| 8 | 🇦🇪 UAE | $68,100 |
| 9 | 🇦🇹 Austria | $67,397 |
| 10 | 🇸🇪 Sweden | $66,909 |
| 11 | 🇺🇸 United States | $66,500 |
| 12 | 🇩🇪 Germany | $64,292 |
| 13 | 🇮🇸 Iceland | $64,082 |
| 14 | 🇳🇱 Netherlands | $62,918 |
| 15 | 🇸🇬 Singapore | $62,508 |
| 16 | 🇫🇷 France | $62,121 |
| 17 | 🇫🇮 Finland | $58,643 |
| 18 | 🇬🇧 UK | $53,925 |
| 19 | 🇧🇭 Bahrain | $52,929 |
| 20 | 🇮🇹 Italy | $52,165 |
| 21 | 🇦🇺 Australia | $50,915 |
| 22 | 🇸🇦 Saudi Arabia | $50,235 |
| 23 | 🇨🇦 Canada | $50,014 |
| 24 | 🇭🇰 Hong Kong SAR | $45,765 |
| 25 | 🇮🇱 Israel | $41,240 |
| 26 | 🇧🇳 Brunei Darussalam | $40,761 |
In this case, Norway has the best ranking globally. This strong showing is likely influenced by working fewer hours compared to the American population due to greater holiday allowances, among other factors.
Meanwhile, the U.S. is in 11th place when adjusting for hours worked, with mainly Western European nations ahead in the ranking. Similarly, countries including the Netherlands, Singapore, Hong Kong, and Brunei drop when adjusting for working hours.
Importantly, the world’s richest countries can’t be understood by a single measure. It’s only by looking at a range of metrics that we can see how countries vary in the rankings depending on the measure and criteria chosen.


Markets
Top 10 Countries Most in Debt to the IMF
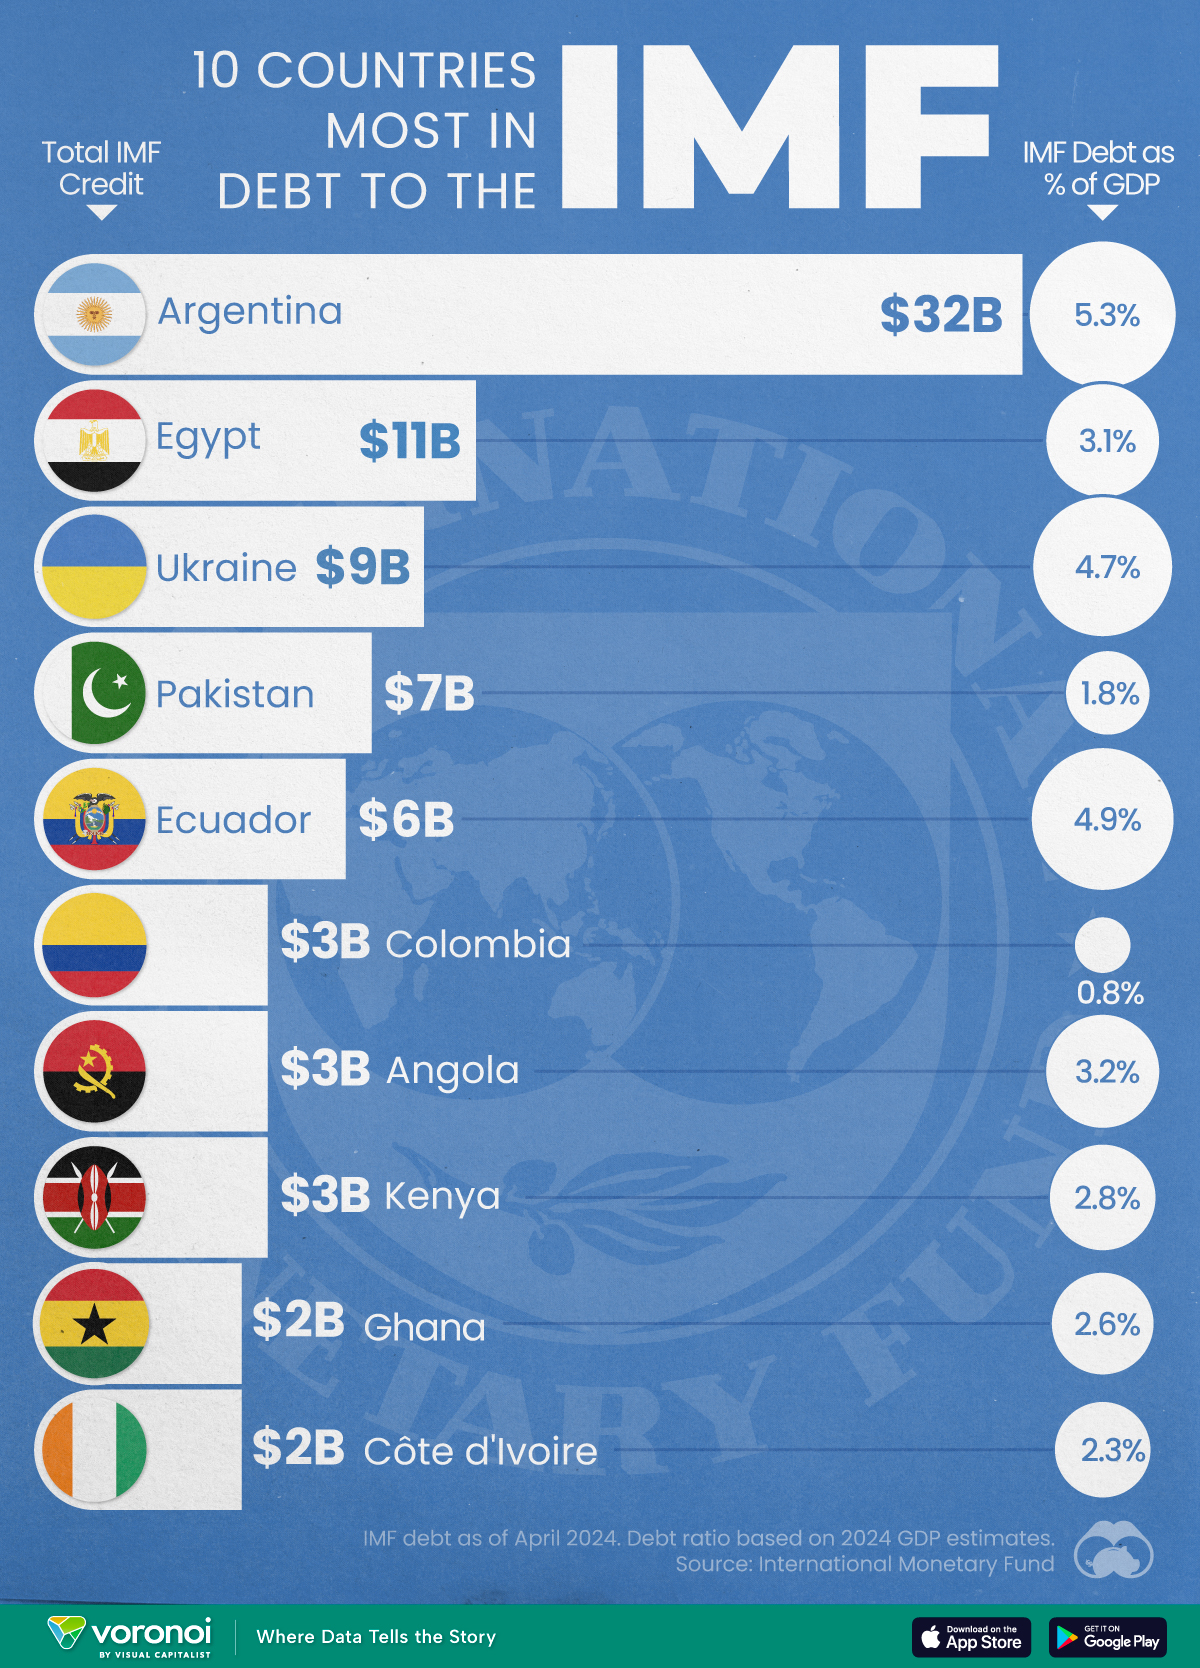
Argentina tops the ranking, with a debt equivalent to 5.3% of the country’s GDP.
Top 10 Countries Most in Debt to the IMF
This was originally posted on our Voronoi app. Download the app for free on iOS or Android and discover incredible data-driven charts from a variety of trusted sources.
Established in 1944, the International Monetary Fund (IMF) supports countries’ economic growth by providing financial aid and guidance on policies to enhance stability, productivity, and job opportunities.
Countries seek loans from the IMF to address economic crises, stabilize their currencies, implement structural reforms, and alleviate balance of payments difficulties.
In this graphic, we visualize the 10 countries most indebted to the fund.
Methodology
We compiled this ranking using the International Monetary Fund’s data on Total IMF Credit Outstanding. We selected the latest debt data for each country, accurate as of April 29, 2024.
Argentina Tops the Rank
Argentina’s debt to the IMF is equivalent to 5.3% of the country’s GDP. In total, the country owns more than $32 billion.
| Country | IMF Credit Outstanding ($B) | GDP ($B, 2024) | IMF Debt as % of GDP |
|---|---|---|---|
| 🇦🇷 Argentina | 32 | 604.3 | 5.3 |
| 🇪🇬 Egypt | 11 | 347.6 | 3.1 |
| 🇺🇦 Ukraine | 9 | 188.9 | 4.7 |
| 🇵🇰 Pakistan | 7 | 374.7 | 1.8 |
| 🇪🇨 Ecuador | 6 | 121.6 | 4.9 |
| 🇨🇴 Colombia | 3 | 386.1 | 0.8 |
| 🇦🇴 Angola | 3 | 92.1 | 3.2 |
| 🇰🇪 Kenya | 3 | 104.0 | 2.8 |
| 🇬🇭 Ghana | 2 | 75.2 | 2.6 |
| 🇨🇮 Ivory Coast | 2 | 86.9 | 2.3 |
A G20 member and major grain exporter, the country’s history of debt trouble dates back to the late 1890s when it defaulted after contracting debts to modernize the capital, Buenos Aires. It has already been bailed out over 20 times in the last six decades by the IMF.
Five of the 10 most indebted countries are in Africa, while three are in South America.
The only European country on our list, Ukraine has relied on international support amidst the conflict with Russia. It is estimated that Russia’s full-scale invasion of the country caused the loss of a third of the country’s economy. The country owes $9 billion to the IMF.
In total, almost 100 countries owe money to the IMF, and the grand total of all of these debts is $111 billion. The above countries (top 10) account for about 69% of these debts.

-

 Maps7 days ago
Mapped: Southeast Asia’s GDP Per Capita, by Country
-

 Markets2 weeks ago
Visualizing Global Inflation Forecasts (2024-2026)
-

 Misc2 weeks ago
Charted: What Southeast Asia Thinks About China & the U.S.
-

 Misc2 weeks ago
The Evolution of U.S. Beer Logos
-

 Healthcare1 week ago
What Causes Preventable Child Deaths?
-

 Energy1 week ago
Who’s Building the Most Solar Energy?
-

 Markets1 week ago
Mapped: The Most Valuable Company in Each Southeast Asian Country
-

 Technology1 week ago
Mapped: The Number of AI Startups By Country