Misc
A Visual Guide to Human Emotion
A Visual Guide to Human Emotion
Despite vast differences in culture around the world, humanity’s DNA is 99.9% similar.
There are few attributes more central and universal to the human experience than our emotions. Of course, the broad spectrum of emotions we’re capable of experiencing can be difficult to articulate. That’s where this brilliant visualization by the Junto Institute comes in.
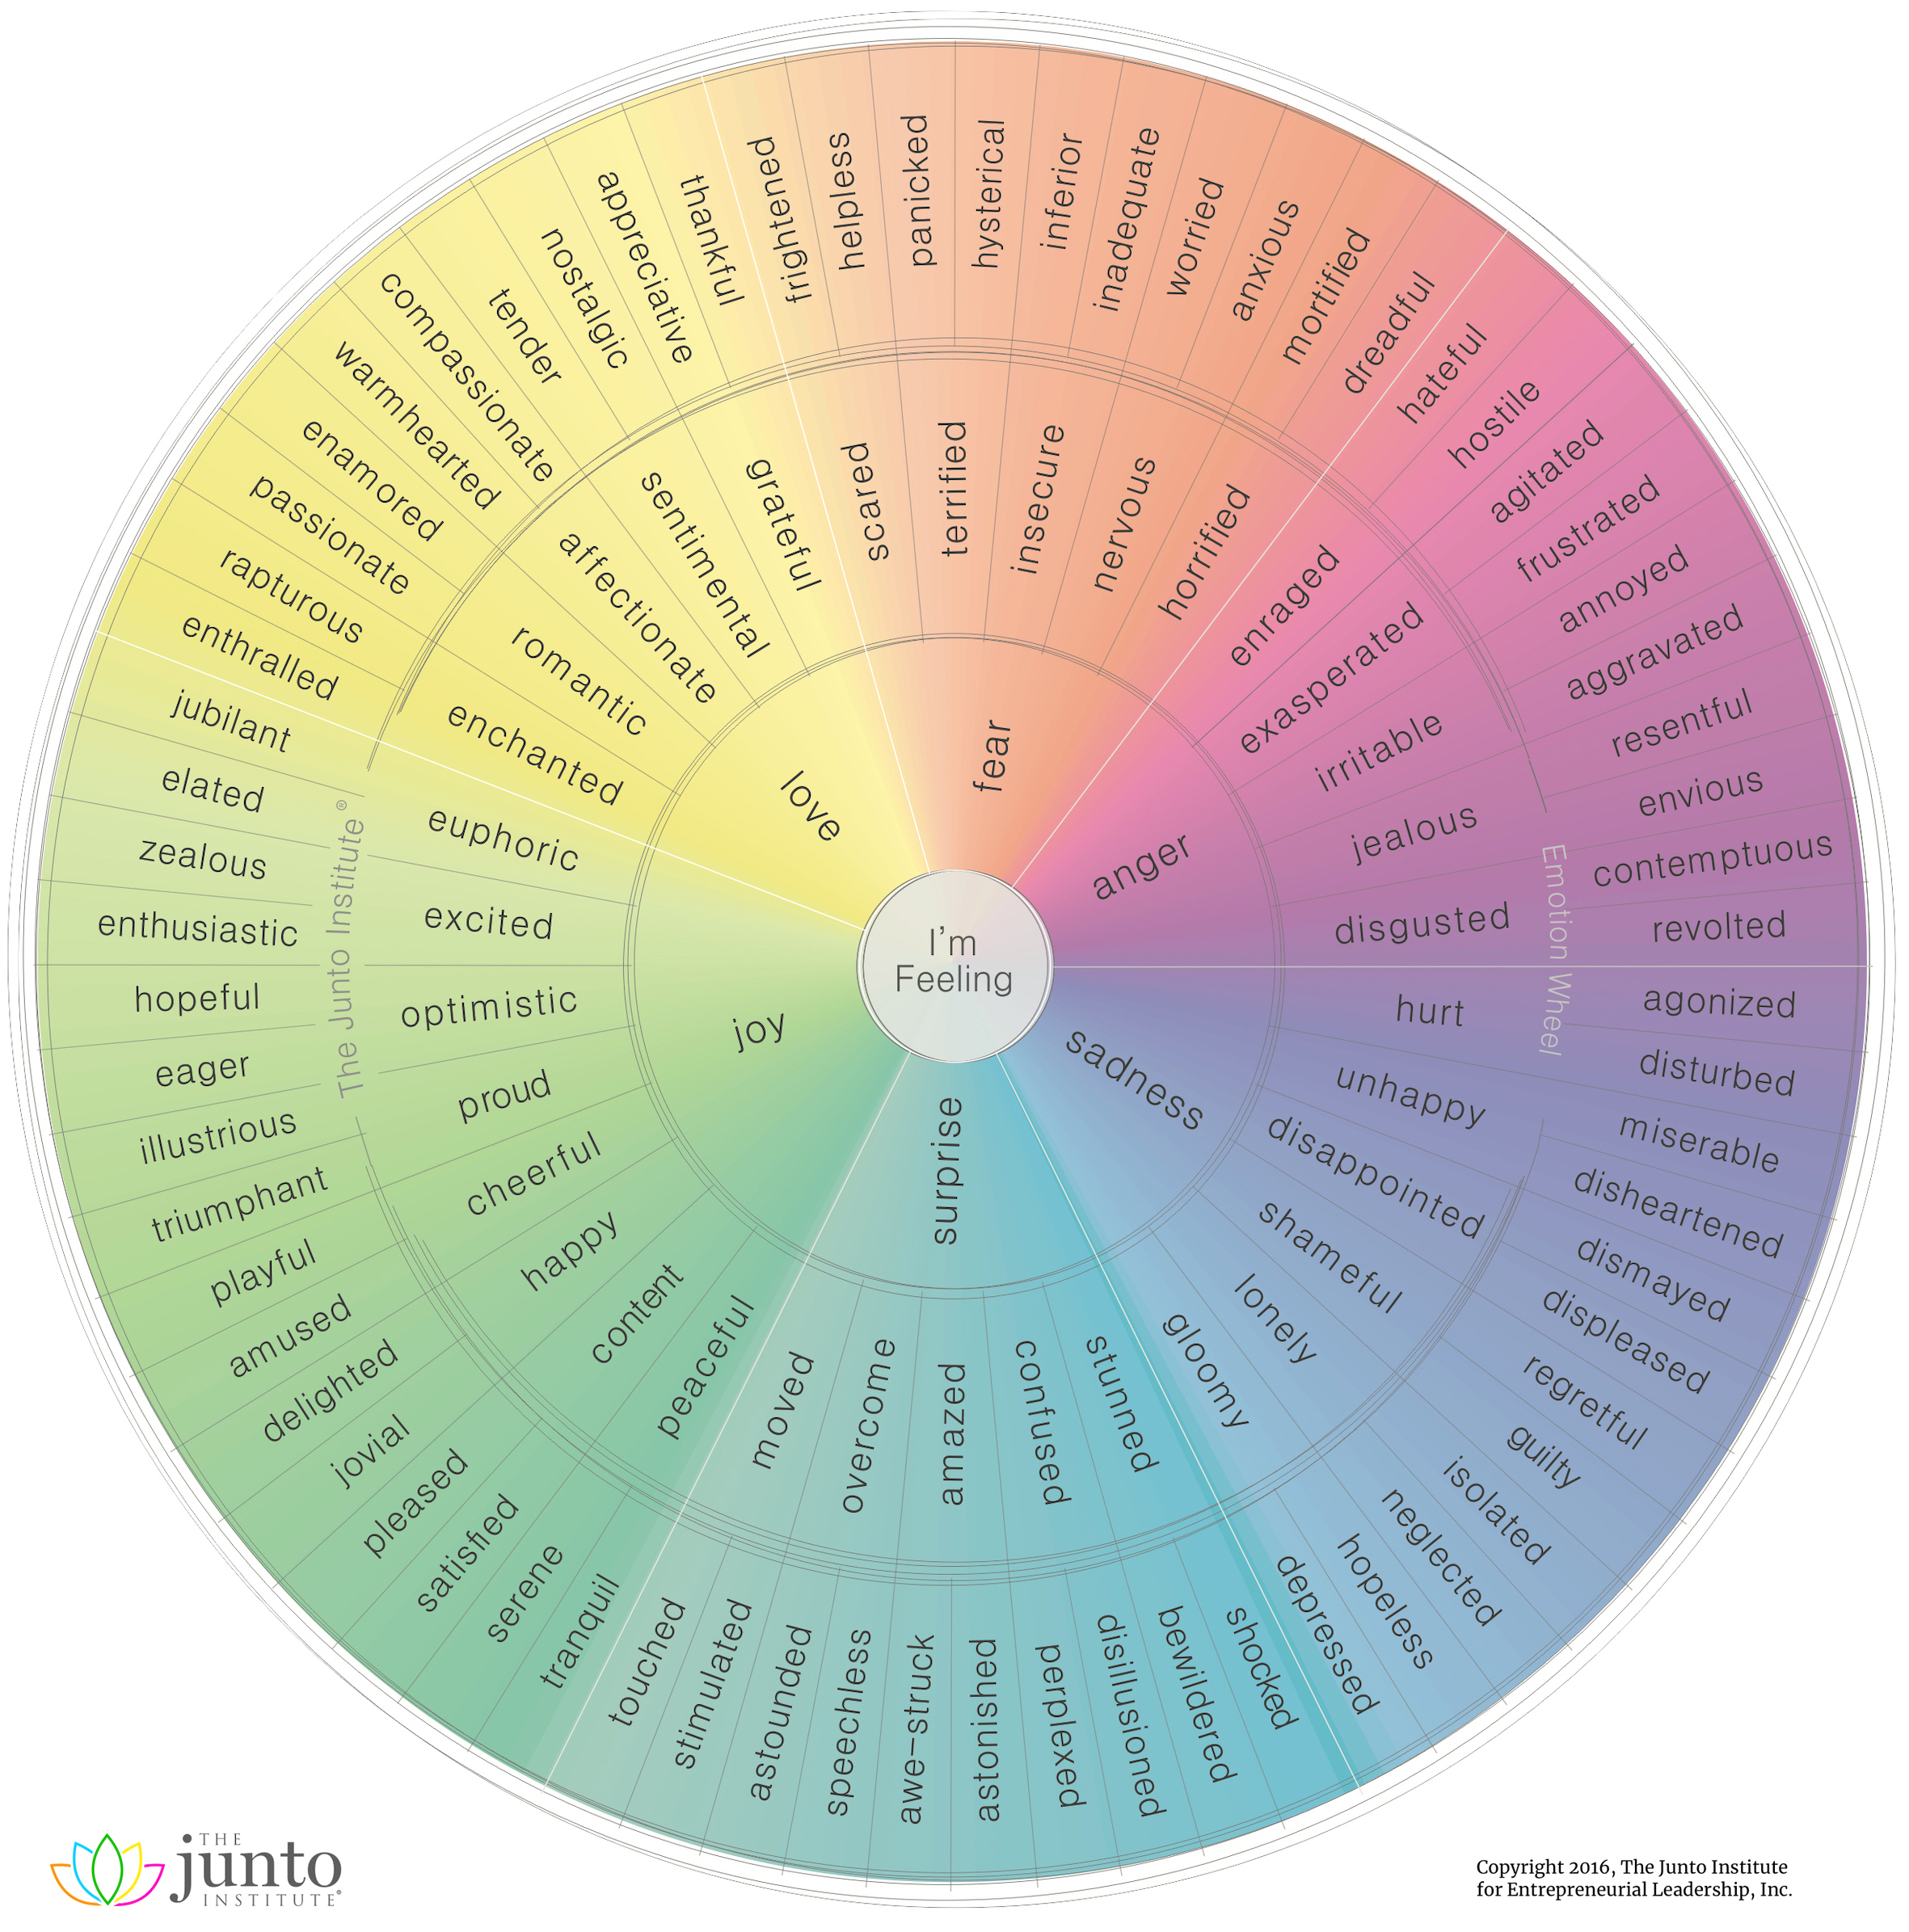
This circular visualization is the latest in an ongoing attempt to neatly categorize the full range of emotions in a logical way.
A Taxonomy of Human Emotion
Our understanding has come a long way since William James proposed four basic emotions – fear, grief, love, and rage—though these core emotions still form much of the foundation for current frameworks.
The wheel visualization above identifies six root emotions:
- Fear
- Anger
- Sadness
- Surprise
- Joy
- Love
From these six emotions, more nuanced descriptions emerge, such as jealousy as a subset of anger, and awe-struck as a subset of surprise. In total, there are 102 second- and third-order emotions listed on this emotion wheel.
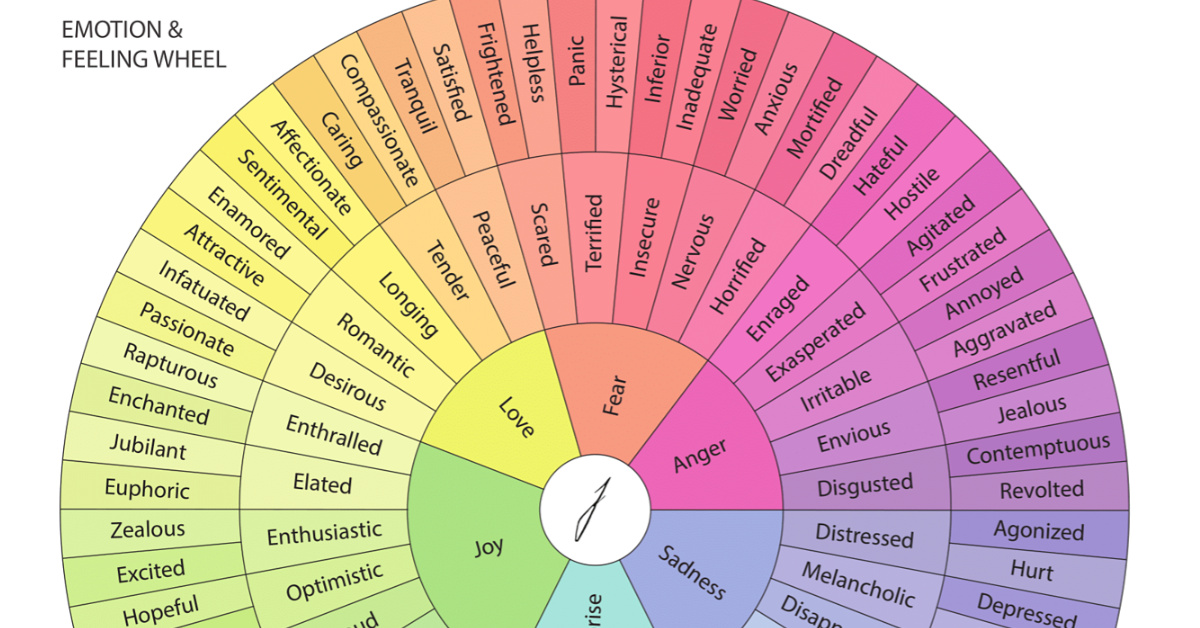
Reinventing the Feeling Wheel
The concept of mapping the range of human emotions on a wheel picked up traction in the 1980s, and has evolved ever since.
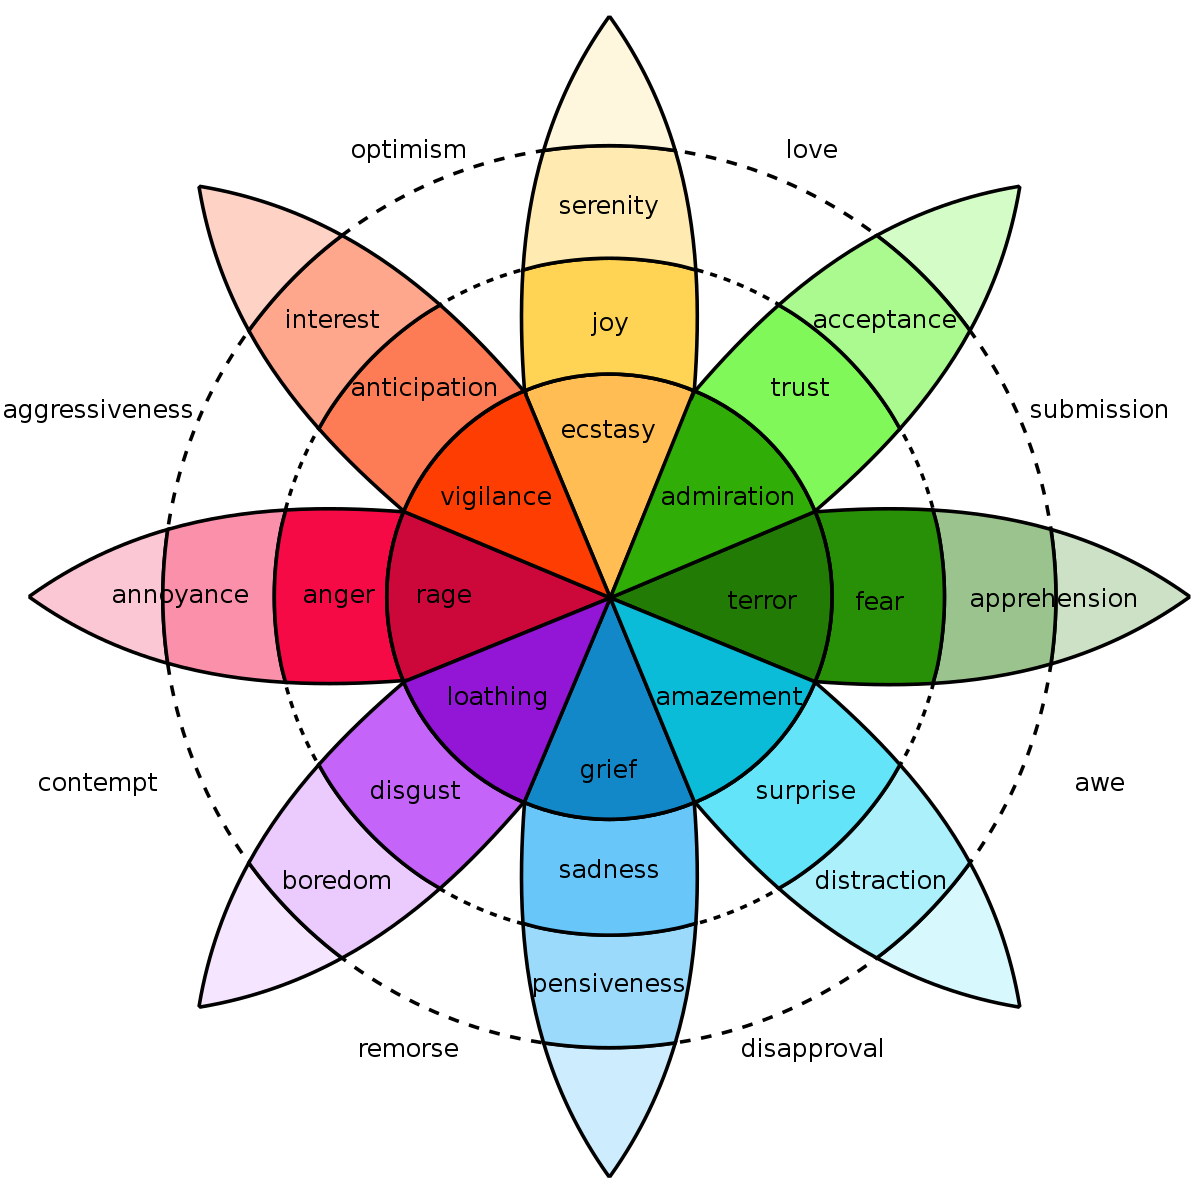
One of these original concepts was developed by American psychologist Robert Plutchik, who mapped eight primary emotions—anger, fear, sadness, disgust, surprise, anticipation, trust, and joy. These “high survival value” emotions were believed to be the most useful in keeping our ancient ancestors alive.
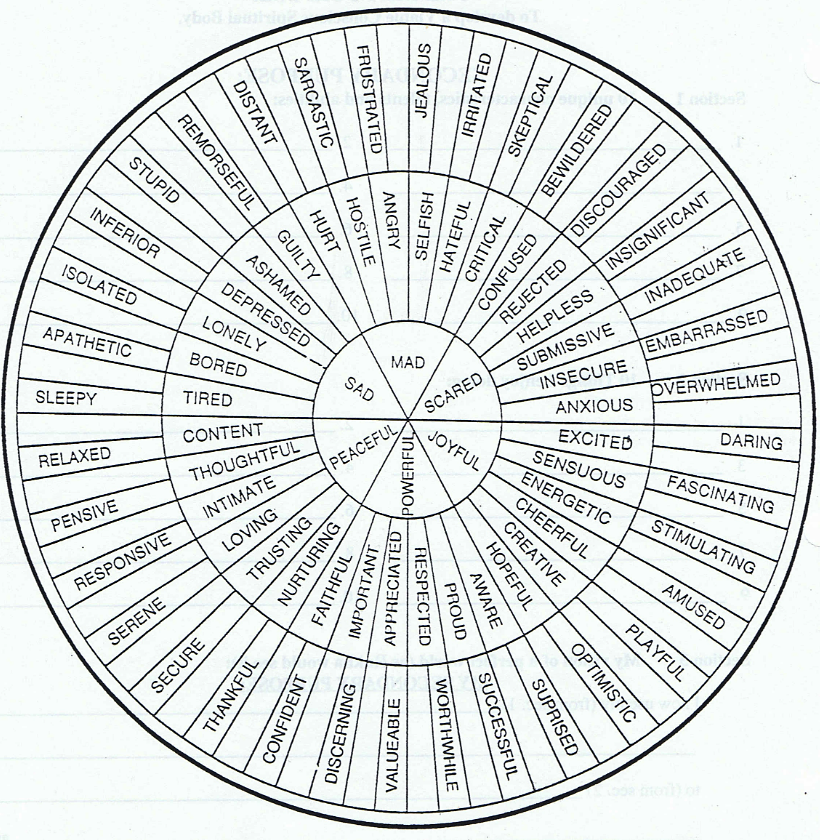
Another seminal graphic concept was developed by author Dr. Gloria Willcox. This version of the emotions wheel has spawned dozens of similar designs, as people continue to try to improve on the concept.
Further Exploration
The more we research human emotion, the more nuanced our understanding becomes in terms of how we react to the world around us.
Researchers at UC Berkeley used 2,185 short video clips to elicit emotions from study participants. Study participants rated the videos using 27 dimensions of self-reported emotional experience, and the results were mapped in an incredible interactive visualization. It is interesting to note that some video clips garnered a wide array of responses, while other clips elicit a near unanimous emotional response.
Here are some example videos and the distribution of responses:

The data visualization clusters these types of videos together, giving us a unique perspective on how people respond to certain types of stimuli.
Much like emotion itself, our desire to understand and classify the world around us is powerful and uniquely human.
Public Opinion
Charted: How Democrats and Republicans View Government Agencies
Predictably, results diverge when both Democrats and Republicans are asked to rate key government agencies in the United States.

How Democrats and Republicans View Government Agencies
This was originally posted on our Voronoi app. Download the app for free on iOS or Android and discover incredible data-driven charts from a variety of trusted sources.
Forget the presidential race, the partisan divide in America can also be seen by how Democrats and Republicans feel about key government agencies.
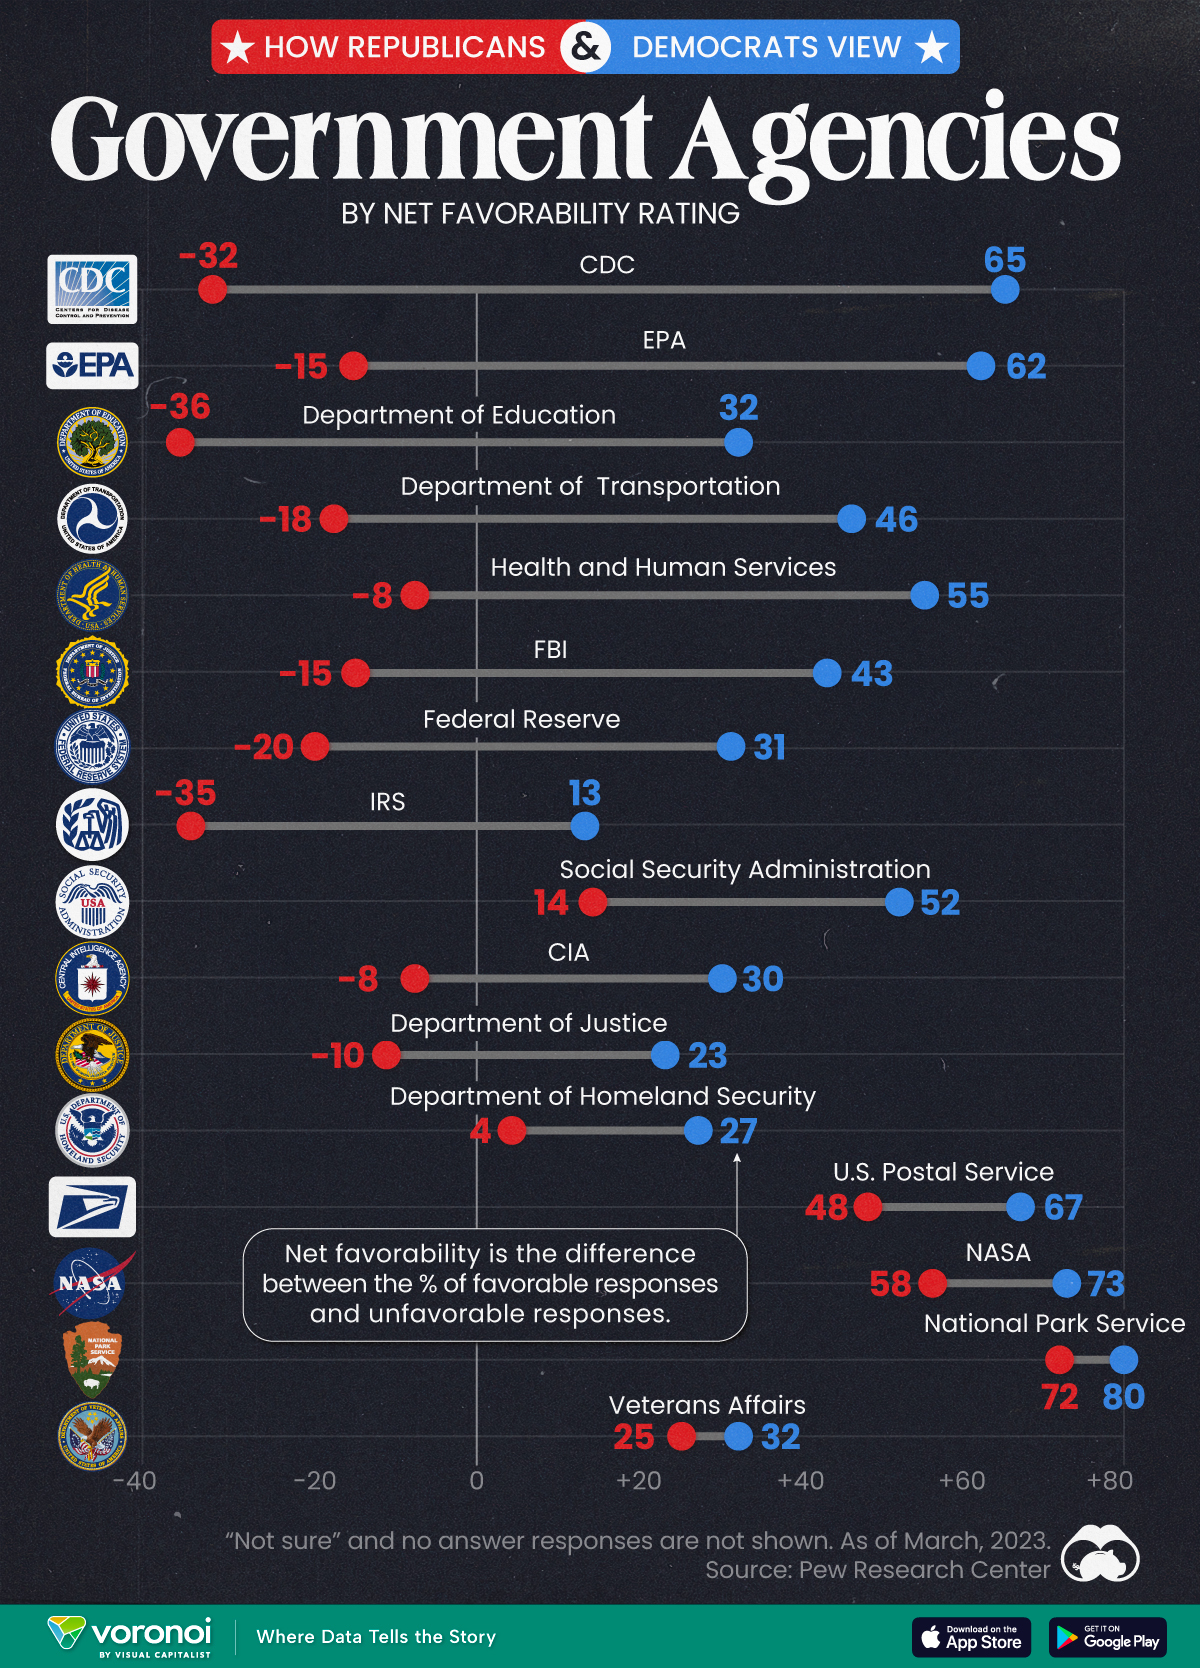
We visualize the net favorability ratings of 16 federal government agencies, based on respondent party affiliation.
To find this data, Pew Research Center surveyed more than 10,000 adults, between March 13-19, 2023. View their methodology page for more details about the survey, the questions asked, and the results obtained.
Republicans Don’t Like How the CDC Handled the Pandemic
The division in net favorability is deepest for three federal government agencies. While the CDC garnered a net favorability rating of 65 from Democrats, more Republicans rated the agency unfavorably, leading to a net favorability rating of -32.
Similarly, with the EPA and the Department of Education, the difference in net favorability between the two voting sides is as high as 70–80 points.
| Federal Agency | Republican Net Favorability Rating | Democrat Net Favorability Rating |
|---|---|---|
| 🔬 CDC | -32 | 65 |
| 🌿 EPA | -15 | 62 |
| 📚 Department of Education | -36 | 32 |
| 🚗 Department of Transportation | -18 | 46 |
| 💉 Health and Humans Services | -8 | 55 |
| 💰 Federal Reserve | -20 | 31 |
| 🕵️ FBI | -15 | 43 |
| 💼 IRS | -35 | 13 |
| 💼 Social Security Admin | 14 | 52 |
| 🕵️♂️ CIA | -8 | 30 |
| ⚖️ Justice Department | -10 | 23 |
| 🛡️ Homeland Security | 4 | 27 |
| 📮 USPS | 48 | 67 |
| 🚀 NASA | 58 | 73 |
| 🏞️ Park Service | 72 | 80 |
| 🎖️ Veterans Affairs | 25 | 32 |
Pew Research Center notes that Republicans didn’t always view the CDC quite so unfavorably, though a direct comparison is impossible.
Nevertheless, per the source, in March 2020, 84% of surveyed Republicans expressed positive views of the CDC’s performance. By October 2022, just 32% said the CDC had done an excellent or good job of handling the pandemic.
Meanwhile, there are a few agencies the two sides do agree on: the National Park Service, the Postal Service, and NASA.
And they both agree on Veterans Affairs as well: though neither share a particularly high opinion of the organization.
Finally, Democrats consistently rate all sixteen agencies on the survey more favorably than Republicans, showing consistency about how each side views the government in general.

-

 Maps7 days ago
Mapped: Southeast Asia’s GDP Per Capita, by Country
-

 Markets2 weeks ago
Visualizing Global Inflation Forecasts (2024-2026)
-

 United States2 weeks ago
Charted: What Southeast Asia Thinks About China & the U.S.
-

 United States2 weeks ago
The Evolution of U.S. Beer Logos
-

 Healthcare1 week ago
What Causes Preventable Child Deaths?
-

 Energy1 week ago
Who’s Building the Most Solar Energy?
-

 Markets1 week ago
Mapped: The Most Valuable Company in Each Southeast Asian Country
-

 Technology1 week ago
Mapped: The Number of AI Startups By Country