Markets
Visualizing Who Holds U.S. Debt Internationally
Visualizing Who Holds U.S. Debt Internationally
We recommend viewing the full-size version of today’s infographic by clicking here.
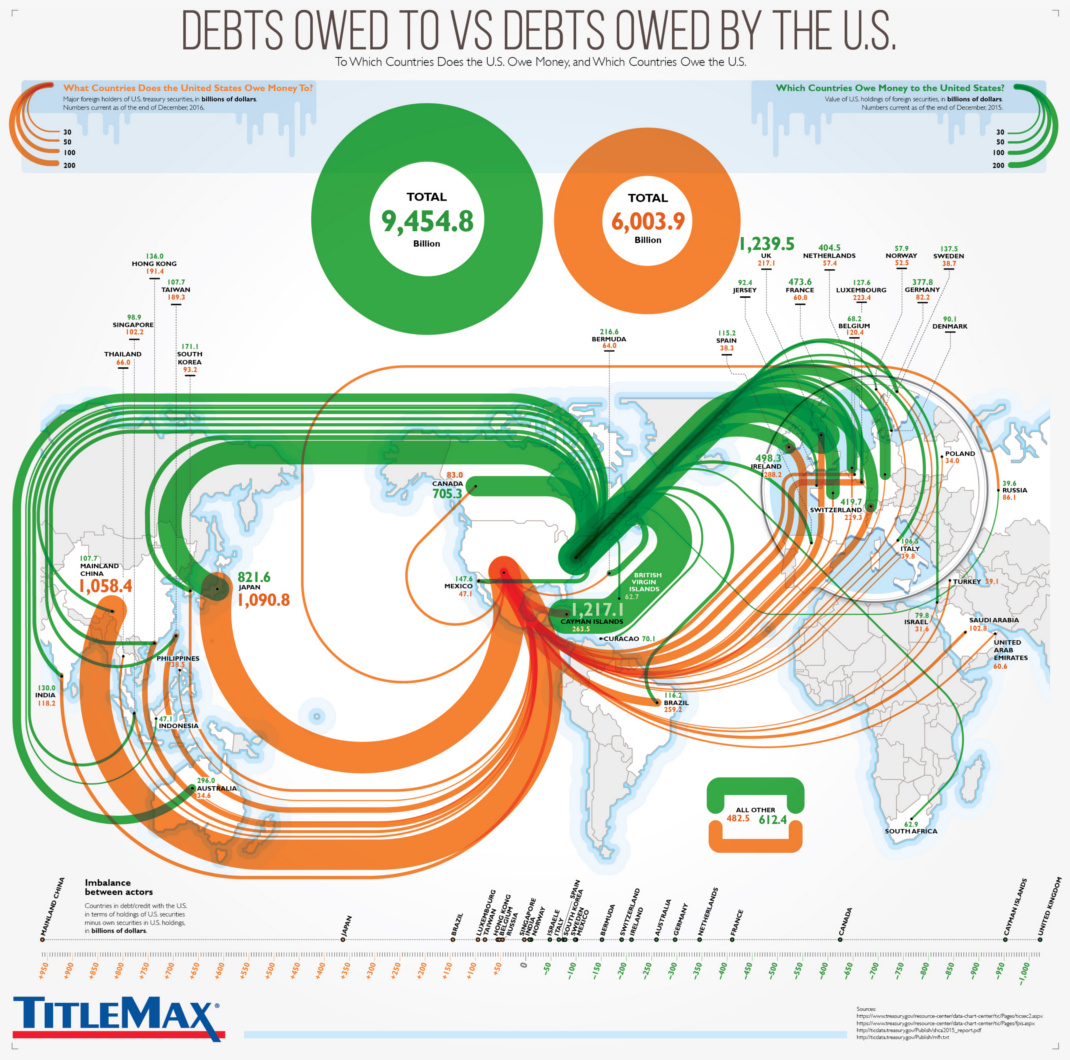
Everyone knows that the U.S. Federal Government has roughly $20 trillion of debt. A question we often get, however, is who exactly owns all these treasuries? And if it’s held abroad by countries like China, what portion do they hold?
Today’s infographic comes from TitleMax, and it looks at who owns U.S. debt internationally, as well as the debt from other countries that is held by the U.S.
Who Holds U.S. Debt?
Federal government debt in the United States can be broadly placed in two categories: “Debt held by the public” and “Intragovernmental debt”. The former category includes securities held by individual investors, corporations, local and state governments, the Federal Reserve, and foreign governments.
Meanwhile, intragovernmental debt includes securities held in accounts administered by other federal authorities. This category, for example, would include treasuries owed to the Social Security Trust Fund.
Here’s the tallies of these two categories as of December 2016:
| Federal U.S. Debt (Billions) | |
|---|---|
| Debt held by the public | $14,202.1 |
| Intragovernmental debt | $5,395.7 |
| Total debt | $19,597.8 |
Debt Held By the Public
“Debt held by the public” is the most interesting of these, and it can be further broken down:
| Entity | U.S. Debt Held (Billions) |
|---|---|
| Foreign/International | $6,154.9 |
| Federal Reserve* | $2,490.6 |
| Mutual Funds | $1,524.8 |
| State and Local Gov'ts (incl. pensions) | $899.4 |
| Banks | $620.3 |
| Private pension funds | $549.1 |
| Insurance Companies | $344.8 |
| U.S. Savings Bonds | $165.8 |
| Other | $1,449.1 |
*Note: Data for Fed is for marketable securities only. All data in this table from September 2016.
About 43% of all debt held by the public is actually owned by foreign governments, corporations, and individuals.
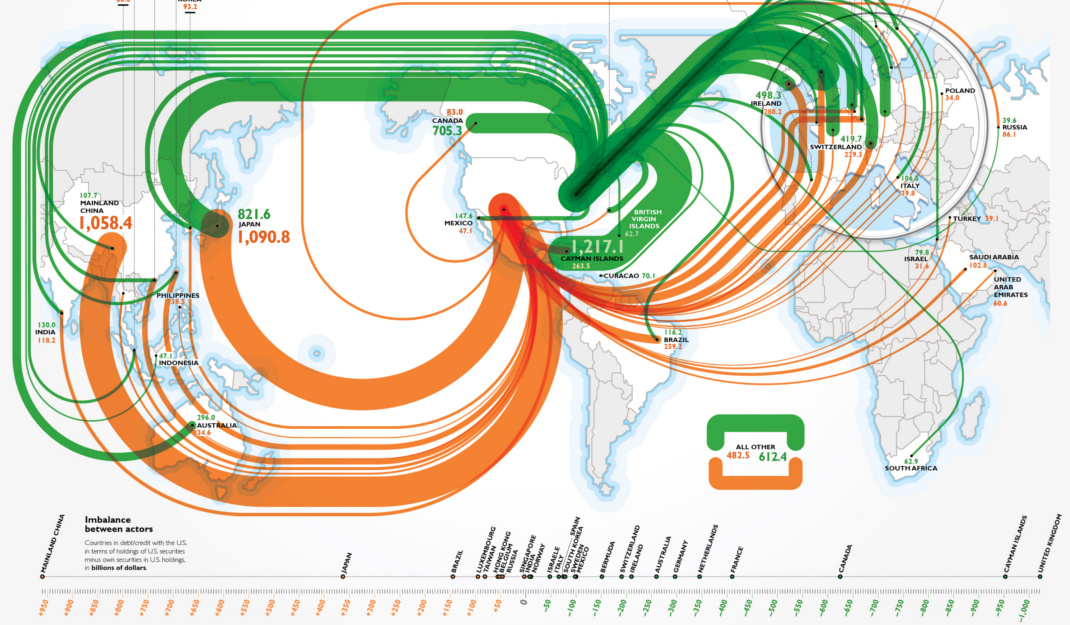
U.S. Debt Held Internationally
Here’s how that breaks down by country:
| Country | U.S. Debt Held (Billions) |
|---|---|
| Japan | $1,090.8 |
| China | $1,058.4 |
| Ireland | $288.2 |
| Cayman Islands | $263.5 |
| Brazil | $259.2 |
| Switzerland | $229.9 |
| Luxembourg | $223.4 |
| United Kingdom | $217.1 |
| Hong Kong | $191.4 |
| Taiwan | $189.3 |
| India | $118.2 |
| Saudi Arabia | $102.8 |
| Others | $1,771.7 |
Note: This data is from December 2016


Markets
Mapped: Europe’s GDP Per Capita, by Country
Which European economies are richest on a GDP per capita basis? This map shows the results for 44 countries across the continent.


Mapped: Europe’s GDP Per Capita, by Country (2024)
This was originally posted on our Voronoi app. Download the app for free on iOS or Android and discover incredible data-driven charts from a variety of trusted sources.
Europe is home to some of the largest and most sophisticated economies in the world. But how do countries in the region compare with each other on a per capita productivity basis?
In this map, we show Europe’s GDP per capita levels across 44 nations in current U.S. dollars. Data for this visualization and article is sourced from the International Monetary Fund (IMF) via their DataMapper tool, updated April 2024.
Europe’s Richest and Poorest Nations, By GDP Per Capita
Luxembourg, Ireland, and Switzerland, lead the list of Europe’s richest nations by GDP per capita, all above $100,000.
| Rank | Country | GDP Per Capita (2024) |
|---|---|---|
| 1 | 🇱🇺 Luxembourg | $131,380 |
| 2 | 🇮🇪 Ireland | $106,060 |
| 3 | 🇨🇭 Switzerland | $105,670 |
| 4 | 🇳🇴 Norway | $94,660 |
| 5 | 🇮🇸 Iceland | $84,590 |
| 6 | 🇩🇰 Denmark | $68,900 |
| 7 | 🇳🇱 Netherlands | $63,750 |
| 8 | 🇸🇲 San Marino | $59,410 |
| 9 | 🇦🇹 Austria | $59,230 |
| 10 | 🇸🇪 Sweden | $58,530 |
| 11 | 🇧🇪 Belgium | $55,540 |
| 12 | 🇫🇮 Finland | $55,130 |
| 13 | 🇩🇪 Germany | $54,290 |
| 14 | 🇬🇧 UK | $51,070 |
| 15 | 🇫🇷 France | $47,360 |
| 16 | 🇦🇩 Andorra | $44,900 |
| 17 | 🇲🇹 Malta | $41,740 |
| 18 | 🇮🇹 Italy | $39,580 |
| 19 | 🇨🇾 Cyprus | $37,150 |
| 20 | 🇪🇸 Spain | $34,050 |
| 21 | 🇸🇮 Slovenia | $34,030 |
| 22 | 🇪🇪 Estonia | $31,850 |
| 23 | 🇨🇿 Czech Republic | $29,800 |
| 24 | 🇵🇹 Portugal | $28,970 |
| 25 | 🇱🇹 Lithuania | $28,410 |
| 26 | 🇸🇰 Slovakia | $25,930 |
| 27 | 🇱🇻 Latvia | $24,190 |
| 28 | 🇬🇷 Greece | $23,970 |
| 29 | 🇭🇺 Hungary | $23,320 |
| 30 | 🇵🇱 Poland | $23,010 |
| 31 | 🇭🇷 Croatia | $22,970 |
| 32 | 🇷🇴 Romania | $19,530 |
| 33 | 🇧🇬 Bulgaria | $16,940 |
| 34 | 🇷🇺 Russia | $14,390 |
| 35 | 🇹🇷 Türkiye | $12,760 |
| 36 | 🇲🇪 Montenegro | $12,650 |
| 37 | 🇷🇸 Serbia | $12,380 |
| 38 | 🇦🇱 Albania | $8,920 |
| 39 | 🇧🇦 Bosnia & Herzegovina | $8,420 |
| 40 | 🇲🇰 North Macedonia | $7,690 |
| 41 | 🇧🇾 Belarus | $7,560 |
| 42 | 🇲🇩 Moldova | $7,490 |
| 43 | 🇽🇰 Kosovo | $6,390 |
| 44 | 🇺🇦 Ukraine | $5,660 |
| N/A | 🇪🇺 EU Average | $44,200 |
Note: Figures are rounded.
Three Nordic countries (Norway, Iceland, Denmark) also place highly, between $70,000-90,000. Other Nordic peers, Sweden and Finland rank just outside the top 10, between $55,000-60,000.
Meanwhile, Europe’s biggest economies in absolute terms, Germany, UK, and France, rank closer to the middle of the top 20, with GDP per capitas around $50,000.
Finally, at the end of the scale, Eastern Europe as a whole tends to have much lower per capita GDPs. In that group, Ukraine ranks last, at $5,660.
A Closer Look at Ukraine
For a broader comparison, Ukraine’s per capita GDP is similar to Iran ($5,310), El Salvador ($5,540), and Guatemala ($5,680).
According to experts, Ukraine’s economy has historically underperformed to expectations. After the fall of the Berlin Wall, the economy contracted for five straight years. Its transition to a Western, liberalized economic structure was overshadowed by widespread corruption, a limited taxpool, and few revenue sources.
Politically, its transformation from authoritarian regime to civil democracy has proved difficult, especially when it comes to institution building.
Finally, after the 2022 invasion of the country, Ukraine’s GDP contracted by 30% in a single year—the largest loss since independence. Large scale emigration—to the tune of six million refugees—is also playing a role.
Despite these challenges, the country’s economic growth has somewhat stabilized while fighting continues.

-

 Markets6 days ago
Visualized: Interest Rate Forecasts for Advanced Economies
-

 Economy2 weeks ago
Economic Growth Forecasts for G7 and BRICS Countries in 2024
-

 Wealth2 weeks ago
Charted: Which City Has the Most Billionaires in 2024?
-

 Technology2 weeks ago
All of the Grants Given by the U.S. CHIPS Act
-

 Green2 weeks ago
The Carbon Footprint of Major Travel Methods
-

 Misc1 week ago
Visualizing the Most Common Pets in the U.S.
-

 Culture1 week ago
The World’s Top Media Franchises by All-Time Revenue
-

 voronoi1 week ago
Best Visualizations of April on the Voronoi App