
Imagine a ship carrying commodities from Australia to China, and another carrying the same, but in the opposite direction. Both routes are equal in distance. Yet that first journey, from Australia to China, costs 33% more, on average, than the return trip.
This isn’t because of tariffs, subsidies, or some other government policy. It’s simple supply and demand—not of goods, but of ships needed to transport those goods, according to this National Bureau of Economic Research working paper. Ship supply depends on ever-shifting trade flows, which are themselves shaped by natural resources and geography. Trade policy, however, is based on economic models that fail to account for how this complex interplay influences shipping costs and, therefore, growth.
Why is it more expensive to ship to China along the same route than the reverse? Because China feverishly imports commodities and exports relatively little of its own. Thus many more vessels unload on its docks than are needed to ship Chinese cargo elsewhere. The goods China does export (more than it imports) are manufactured items, which are shipped in container vessels, not the dry bulk ships used by commodities.
In ports Down Under, things are the reverse: Australia produces far more commodities like wheat, wool, iron ore, gold, and coal than its own people can consume, and buys few such items from other countries. This means fewer vessels deliver cargo to Australian docks than are needed to carry its raw materials to ports beyond.
That dynamic explains the different cost calculus for ships. Say a captain agrees to deliver an Australian exporter’s iron ore to China. He knows that, once he arrives in Shanghai, he’ll struggle to find a Chinese exporter looking to hire his ship. To find his next load of cargo, he’ll likely have to head to Indonesia or another nearby resource-rich country, costing him extra in fuel and labor. Meanwhile, the captain who scores a shipment of, say, fertilizer from China to Brisbane knows that once he’s unloaded, he’ll have no trouble lining up an Australian exporter in need of his services.
That uncertainty—the risk of having to swallow extra costs between shipments—is why the first captain will charge the Australian iron ore exporter around $10,000 a day, not counting fuel, while the luckier second captain bills the Chinese exporter around $7,500 daily, according to the NBER authors. In other words, Chinese importers are subsidizing Chinese exporters, says Myrto Kalouptsidi, a Harvard economist who co-authored the paper with Theodore Papageorgiou, of McGill University, and Princeton’s Giulia Brancaccio.
The global norm
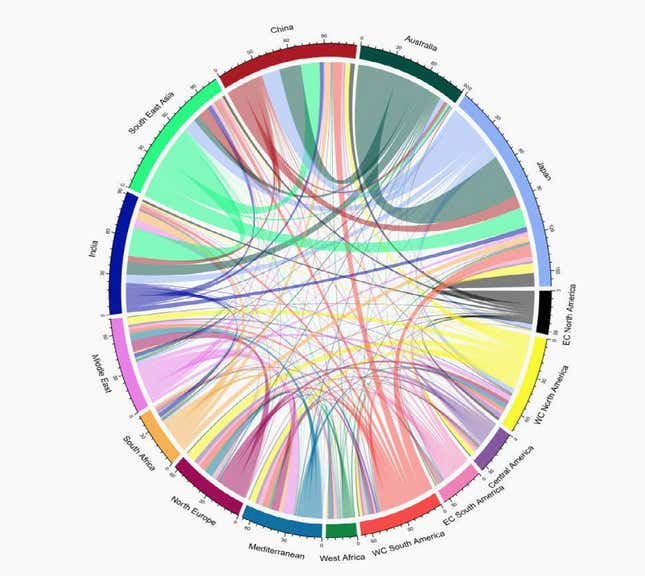
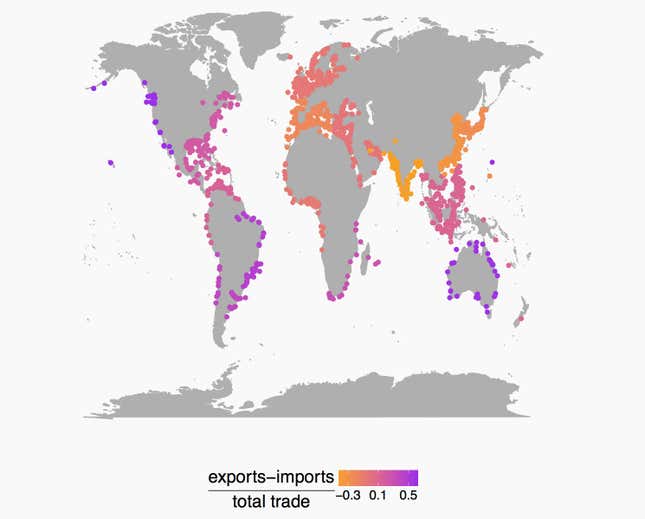
While China and Australia are extreme examples, these dynamics are largely the global norm. Looking at satellite data since 2012, Kalouptsidi and her colleagues determined that most countries are either net importers of commodities—like China and India—or net exporters, such as Australia, Brazil, the US, and Canada. So great are these trade asymmetries that, at any given time, around 45% of dry-bulk ships are cruising the seas carrying no cargo whatsoever. And just as in the China-Australia example, the way a country lucked out (or didn’t) in its draw of nature’s bounty makes export costs vary too.
But that’s only one dimension of the trade network that drives transport prices. Another is that “who your neighbors are matters,” as Papageorgiou and Kalouptsidi put it.
“Both the trade imbalance of your neighbors—whether they are net exporters or net importers—and the kinds of goods they produce determine how many ships become available, and this in turn affects your costs to export,” says Kalouptsidi. “For instance, China’s neighbors benefit from its high import demand, as this leads to many ships in the region that end their trip there, [leaving them] available to pick up another cargo.”
A dangerous flaw
Standard economic models that economists and policymakers commonly use to analyze trade policy assume that shipping costs are fixed and depend only on the distance between the two countries. They fail to capture the constantly shifting influence that these trade imbalances exert on export costs. Analysis of trade policy overlooks how external shocks, domestic policies, or changing trade patterns might affect trade costs, boosting or crimping net exports—and, by extension, growth.
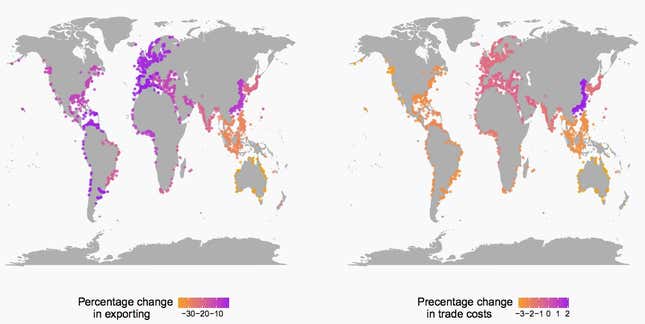
Consider what might happen if China’s economy slowed, dragging down its commodity demand.
The economists ran this scenario through their model (this is a simulation, and not strictly predictive). A slump would of course hit exporters in Australia, Brazil, the US, Canada, Southeast Asia and other economies from which China buys a lot of commodities—a finding that conventional trade models would pick up on, too.
In addition, however, the paper’s authors found that slowing Chinese imports would push the supply of empty ships elsewhere, sending a slew of secondary effects rippling across the planet. No longer able to count on Chinese demand, ships that used to be happy pinballing around Asia in search of customers head to the Americas instead. As a result, Chinese exporters would face higher shipping costs, further denting their country’s growth.
That shift would hurt China’s commodity-exporting neighbors, too. Meanwhile, the new abundance of ships near the Americas would lower shipping costs, somewhat offsetting the impact of declining Chinese commodity demand.
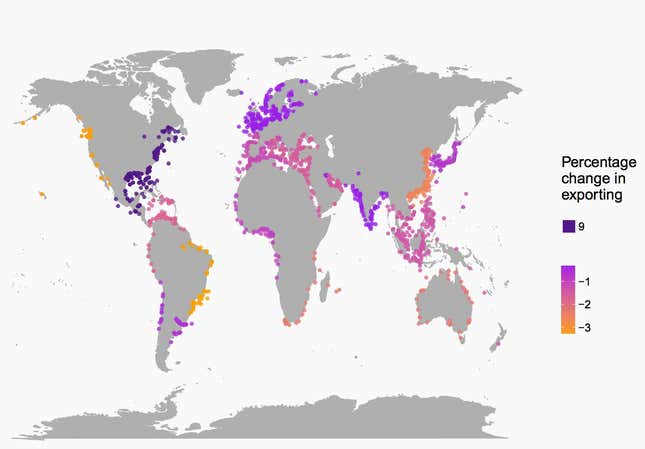
Consider yet another scenario. What if melting Arctic sea ice leads to the opening up of the Northwest Passage between the Atlantic and the Pacific? More outside options available to ships would increase their bargaining power. As trade costs rose, exporting would decline everywhere, with one big exception: Northeast America’s new proximity to China and the rest of Asia would make it suddenly more attractive to ships. However, America’s west coast exporters would face rising costs as some of the ships that otherwise would have hung around waiting for cargo there would flock nearer to the Northwest Passage instead.
These findings buck the “world is flat” intuition that increased globalization drives the world toward equilibrium.
Part of the reason that 45% of dry bulk ships are chugging along without cargo—making export more expensive than, in theory, they should be—is that ships and exporters often aren’t communicating very efficiently (a problem that anyone who opts for Lyft or Uber over curbside cab-hailing might understand). What would happen if ships and exporters communicated so efficiently that no more ships than necessary would leave net-exporting countries empty or arrive at net-importing countries without loads?
In this perfect world, in which ships and exporters can find each other with telepathic ease, global trade would indeed increase, by a world average of 23%, according to the economists’ simulation. What also happens, though, is that ships gravitate toward countries that are sure bets for finding cargo—basically those that are already the biggest commodity exporters, like Brazil, Australia, and the northeastern ports of North America. Exporters in those areas benefit far more than everyone else.
In other words, as efficiency increases global trade, it also makes it more lopsided. “This speaks to how imbalances can dampen or amplify your comparative advantage,” says Kalouptsidi.
“The counterintuitive thing is that if you push things toward more efficiency, you end up with more inequality.”