Markets
35 Chinese Cities With Economies as Big as Countries
35 Chinese Cities With Economies As Big as Countries
The Chart of the Week is a weekly Visual Capitalist feature on Fridays.
Gaining perspective on China’s monstrous economy isn’t always the easiest thing to do.
With 1.4 billion people and the third-largest geographical area, the country is a vast place to begin with. Add in explosive economic growth, a market-oriented but Communist government, a longstanding and complex cultural history, and self-inflicted demographic challenges – and understanding China can be even more of a puzzle.
City by City
To truly grasp the emergence of China, one approach is to look at the impressive economic footprint made by the country’s cities.
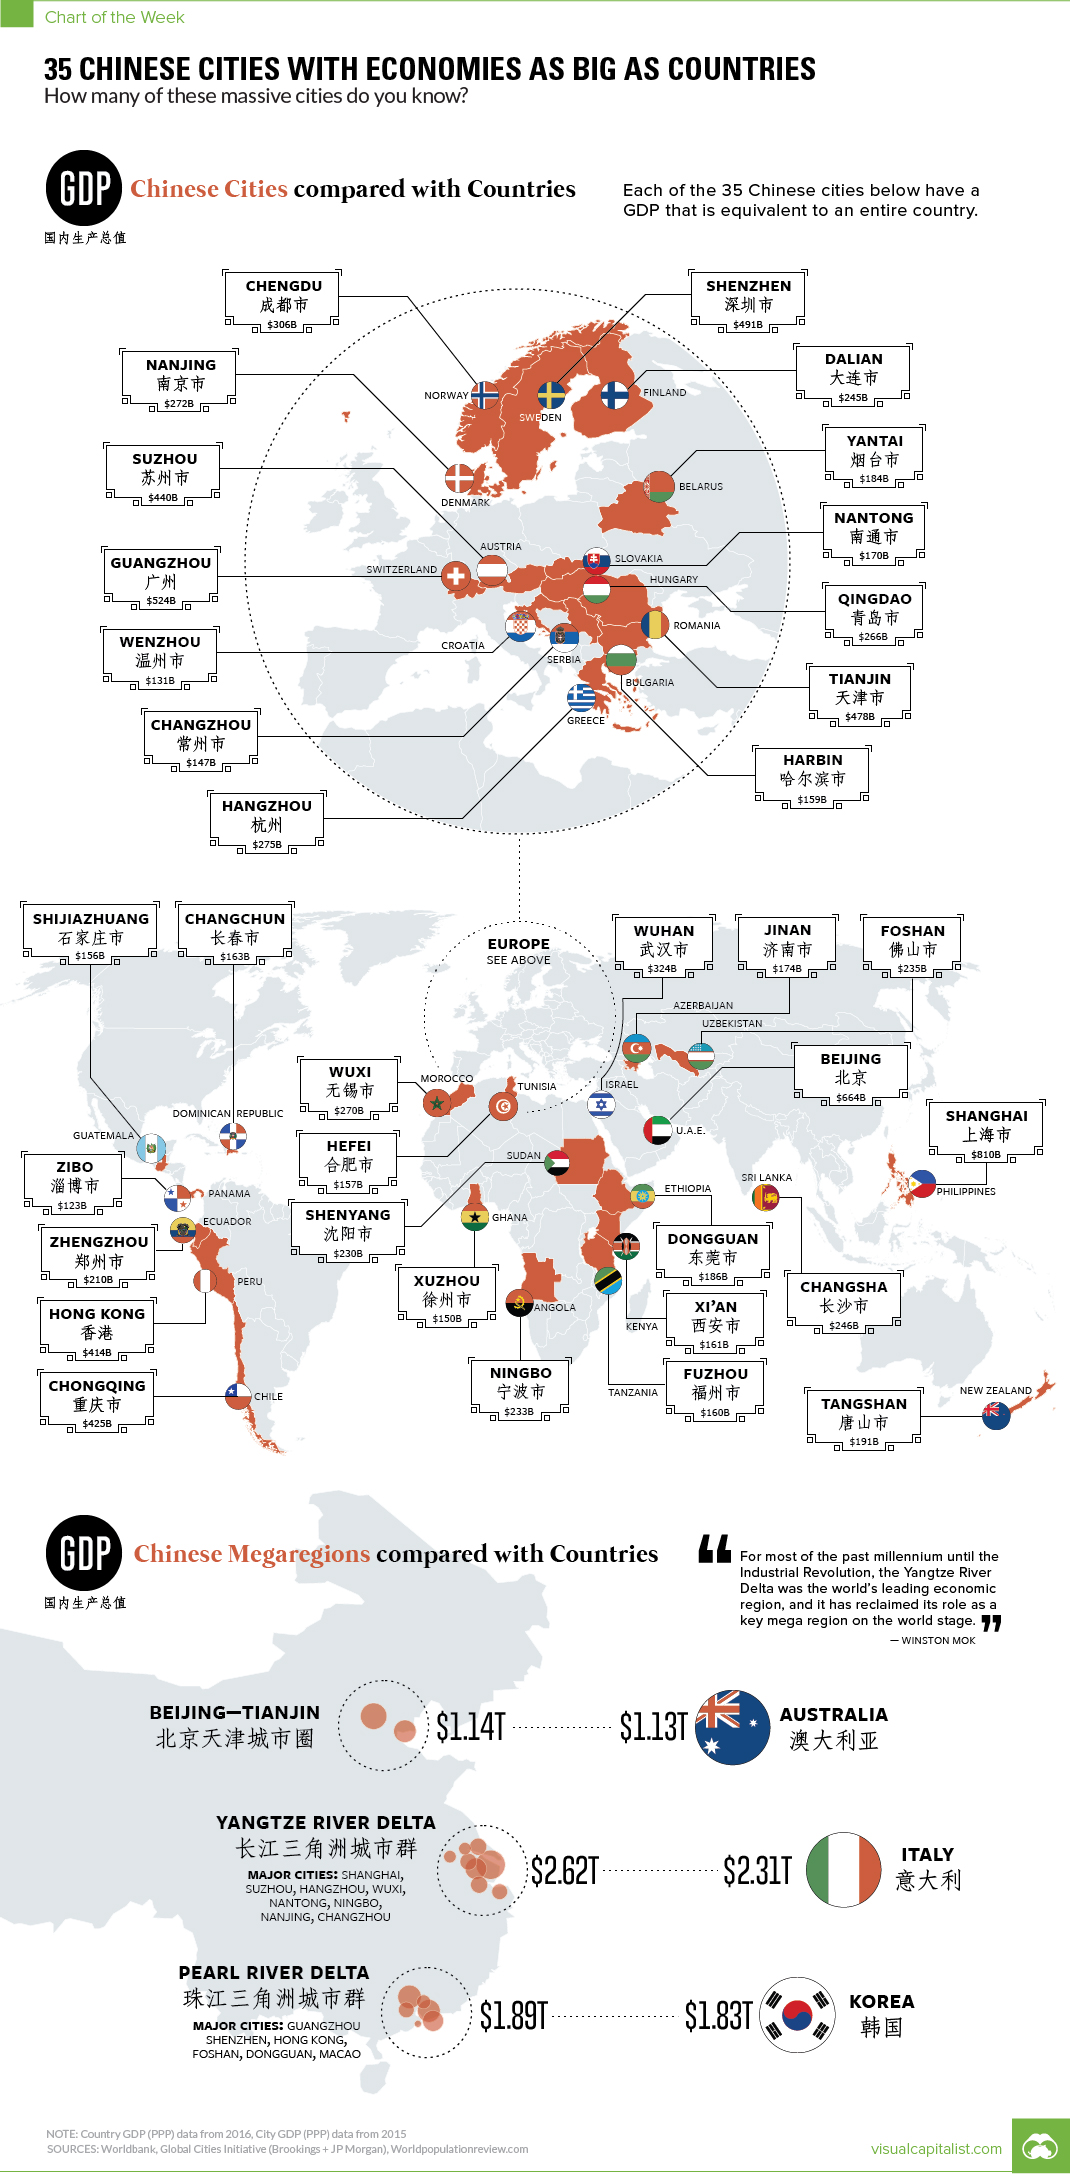
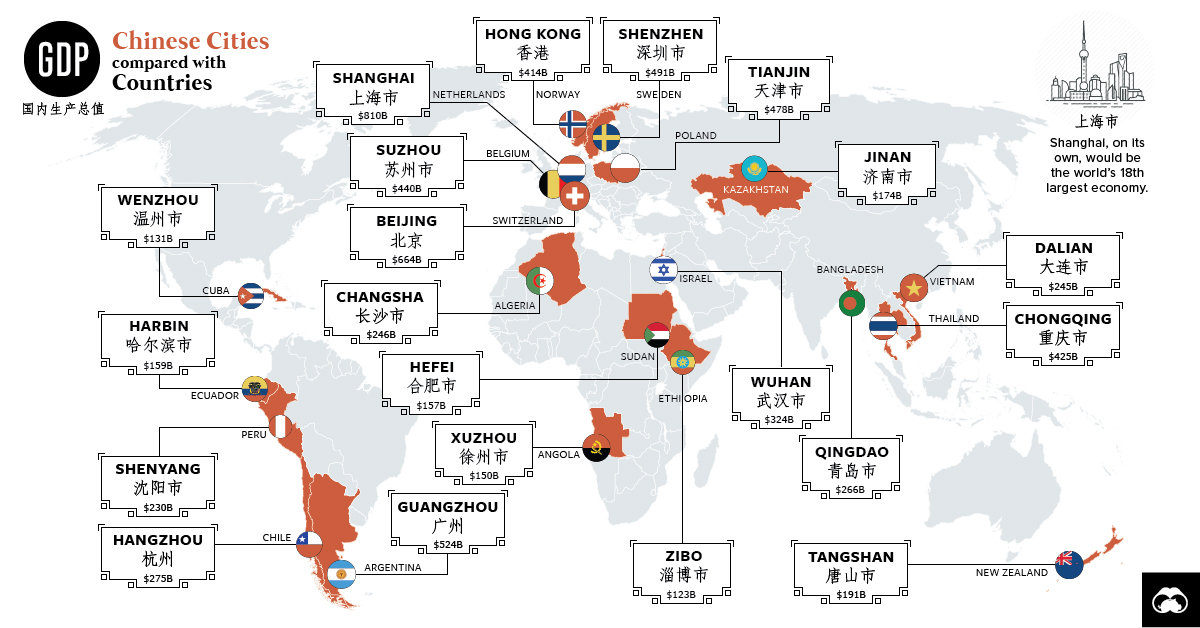
Of course, cities like Shanghai, Beijing, and Hong Kong are the metro economic powerhouses that most people are familiar with. But have you heard of cities like Shijiazhuang, Wuxi, Changsha, Suzhou, Ningbo, Foshan, or Yantai?
There are literally dozens of Chinese cities that most people in Western countries have never heard of – yet they each hold millions of people and have an economic output comparable to nations.
Here’s a list of 35 of them, the size of their local economy, and a comparably sized national economy:
| Rank | Chinese City | City GDP (2015, PPP, in billions) | Comparable Country |
|---|---|---|---|
| #1 | Shanghai | $810 | Philippines |
| #2 | Beijing | $664 | U.A.E. |
| #3 | Guangzhou | $524 | Switzerland |
| #4 | Shenzhen | $491 | Sweden |
| #5 | Tianjin | $478 | Romania |
| #6 | Suzhou | $440 | Austria |
| #7 | Chongqing | $425 | Chile |
| #8 | Hong Kong | $414 | Peru |
| #9 | Wuhan | $324 | Israel |
| #10 | Chengdu | $306 | Norway |
| #11 | Hangzhou | $275 | Greece |
| #12 | Nanjing | $272 | Denmark |
| #13 | Wuxi | $270 | Morocco |
| #14 | Qingdao | $266 | Hungary |
| #15 | Changsha | $246 | Sri Lanka |
| #16 | Dalian | $245 | Finland |
| #17 | Foshan | $235 | Uzbekistan |
| #18 | Ningbo | $233 | Angola |
| #19 | Shenyang | $230 | Sudan |
| #20 | Zhengzhou | $210 | Ecuador |
| #21 | Tangshan | $191 | New Zealand |
| #22 | Dongguan | $186 | Ethiopia |
| #23 | Yantai | $184 | Belarus |
| #24 | Jinan | $174 | Azerbaijan |
| #25 | Nantong | $170 | Slovakia |
| #26 | Changchun | $163 | Dominican Republic |
| #27 | Xi'an | $161 | Kenya |
| #28 | Fuzhou | $160 | Tanzania |
| #29 | Harbin | $159 | Bulgaria |
| #30 | Hefei | $157 | Tunisia |
| #31 | Shijiazhuang | $156 | Guatemala |
| #32 | Xuzhou | $150 | Ghana |
| #33 | Changzhou | $147 | Serbia |
| #34 | Wenzhou | $131 | Croatia |
| #35 | Zibo | $123 | Panama |
Megaregions
It’s also important to remember that these cities don’t exist in isolation, and are instead cogs in the wheels of larger megaregions. Such areas would be comparable to the Northeast U.S., in which New York City, Philadelphia, Boston, Baltimore, and Washington, D.C. are all hours apart and remain largely integrated as a regional economy.
In China, there are three main megaregions worth noting:
Yangtze River Delta
With a combined GDP of $2.17 trillion, which is comparable to Italy, the Yangtze River Delta contains cities like Shanghai, Suzhou, Hangzhou, Wuxi, Ningbo, and Changzhou.
Pearl River Delta
With a combined GDP of $1.89 trillion, which is comparable to South Korea, the Pearl River Delta has cities like Hong Kong, Guangzhou, Shenzhen, Foshan, Dongguan, and Macao.
Beijing-Tianjin
With a combined GDP of $1.14 trillion, which is comparable to Australia, this megaregion holds the two largest cities in northern China, Beijing and Tianjin. The two cities are a 30-minute bullet train ride apart.
Note: After publication, it was pointed out that GDP figures for the Chinese cities seemed to be adjusted for PPP and that our source (Brookings Institution) incorrectly had labeled them as nominal in the tables of this document. We have since updated the infographic so that everything is based on PPP, and added four new cities as well.


Markets
U.S. Debt Interest Payments Reach $1 Trillion
U.S. debt interest payments have surged past the $1 trillion dollar mark, amid high interest rates and an ever-expanding debt burden.


U.S. Debt Interest Payments Reach $1 Trillion
This was originally posted on our Voronoi app. Download the app for free on iOS or Android and discover incredible data-driven charts from a variety of trusted sources.
The cost of paying for America’s national debt crossed the $1 trillion dollar mark in 2023, driven by high interest rates and a record $34 trillion mountain of debt.
Over the last decade, U.S. debt interest payments have more than doubled amid vast government spending during the pandemic crisis. As debt payments continue to soar, the Congressional Budget Office (CBO) reported that debt servicing costs surpassed defense spending for the first time ever this year.
This graphic shows the sharp rise in U.S. debt payments, based on data from the Federal Reserve.
A $1 Trillion Interest Bill, and Growing
Below, we show how U.S. debt interest payments have risen at a faster pace than at another time in modern history:
| Date | Interest Payments | U.S. National Debt |
|---|---|---|
| 2023 | $1.0T | $34.0T |
| 2022 | $830B | $31.4T |
| 2021 | $612B | $29.6T |
| 2020 | $518B | $27.7T |
| 2019 | $564B | $23.2T |
| 2018 | $571B | $22.0T |
| 2017 | $493B | $20.5T |
| 2016 | $460B | $20.0T |
| 2015 | $435B | $18.9T |
| 2014 | $442B | $18.1T |
| 2013 | $425B | $17.2T |
| 2012 | $417B | $16.4T |
| 2011 | $433B | $15.2T |
| 2010 | $400B | $14.0T |
| 2009 | $354B | $12.3T |
| 2008 | $380B | $10.7T |
| 2007 | $414B | $9.2T |
| 2006 | $387B | $8.7T |
| 2005 | $355B | $8.2T |
| 2004 | $318B | $7.6T |
| 2003 | $294B | $7.0T |
| 2002 | $298B | $6.4T |
| 2001 | $318B | $5.9T |
| 2000 | $353B | $5.7T |
| 1999 | $353B | $5.8T |
| 1998 | $360B | $5.6T |
| 1997 | $368B | $5.5T |
| 1996 | $362B | $5.3T |
| 1995 | $357B | $5.0T |
| 1994 | $334B | $4.8T |
| 1993 | $311B | $4.5T |
| 1992 | $306B | $4.2T |
| 1991 | $308B | $3.8T |
| 1990 | $298B | $3.4T |
| 1989 | $275B | $3.0T |
| 1988 | $254B | $2.7T |
| 1987 | $240B | $2.4T |
| 1986 | $225B | $2.2T |
| 1985 | $219B | $1.9T |
| 1984 | $205B | $1.7T |
| 1983 | $176B | $1.4T |
| 1982 | $157B | $1.2T |
| 1981 | $142B | $1.0T |
| 1980 | $113B | $930.2B |
| 1979 | $96B | $845.1B |
| 1978 | $84B | $789.2B |
| 1977 | $69B | $718.9B |
| 1976 | $61B | $653.5B |
| 1975 | $55B | $576.6B |
| 1974 | $50B | $492.7B |
| 1973 | $45B | $469.1B |
| 1972 | $39B | $448.5B |
| 1971 | $36B | $424.1B |
| 1970 | $35B | $389.2B |
| 1969 | $30B | $368.2B |
| 1968 | $25B | $358.0B |
| 1967 | $23B | $344.7B |
| 1966 | $21B | $329.3B |
Interest payments represent seasonally adjusted annual rate at the end of Q4.
At current rates, the U.S. national debt is growing by a remarkable $1 trillion about every 100 days, equal to roughly $3.6 trillion per year.
As the national debt has ballooned, debt payments even exceeded Medicaid outlays in 2023—one of the government’s largest expenditures. On average, the U.S. spent more than $2 billion per day on interest costs last year. Going further, the U.S. government is projected to spend a historic $12.4 trillion on interest payments over the next decade, averaging about $37,100 per American.
Exacerbating matters is that the U.S. is running a steep deficit, which stood at $1.1 trillion for the first six months of fiscal 2024. This has accelerated due to the 43% increase in debt servicing costs along with a $31 billion dollar increase in defense spending from a year earlier. Additionally, a $30 billion increase in funding for the Federal Deposit Insurance Corporation in light of the regional banking crisis last year was a major contributor to the deficit increase.
Overall, the CBO forecasts that roughly 75% of the federal deficit’s increase will be due to interest costs by 2034.

-

 Maps2 weeks ago
Mapped: Average Wages Across Europe
-

 Money1 week ago
Which States Have the Highest Minimum Wage in America?
-

 Real Estate1 week ago
Ranked: The Most Valuable Housing Markets in America
-

 Markets1 week ago
Charted: Big Four Market Share by S&P 500 Audits
-

 AI1 week ago
The Stock Performance of U.S. Chipmakers So Far in 2024
-

 Automotive2 weeks ago
Almost Every EV Stock is Down After Q1 2024
-

 Money2 weeks ago
Where Does One U.S. Tax Dollar Go?
-

 Green2 weeks ago
Ranked: Top Countries by Total Forest Loss Since 2001