China
Mapped: The Countries With the Most Military Spending
Mapped: The Countries With the Most Military Spending
Whether it’s fight or flight, there’s a natural tendency of humans to want to protect themselves.
In this day and age, this base instinct takes the form of a nation’s expenditures on armies and armaments, towards an end goal of global security and peacekeeping.
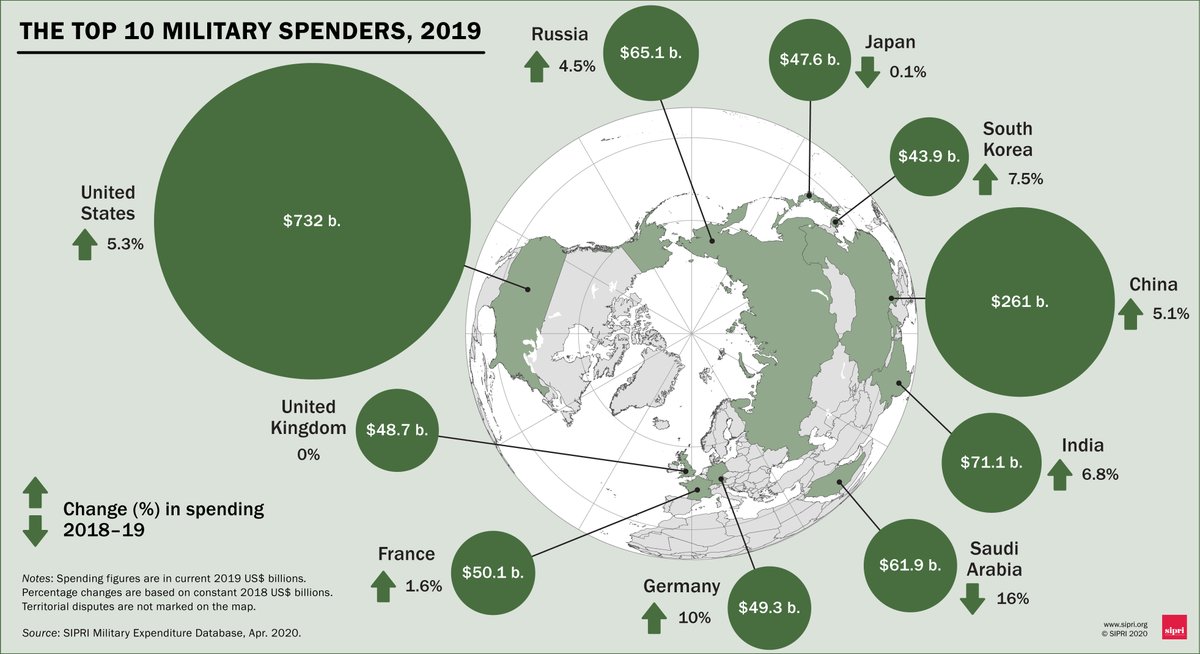
This graphic from the Stockholm International Peace Research Institute (SIPRI) delves into the top military spenders as of 2019.
Top 10 Biggest Military Spenders
Let’s first take a look at the overall growth trends. The world’s military spending grew by 3.6% year-over-year (YoY)—currently the highest rate this decade—to surpass $1.9 trillion in 2019.
While just 10 countries are responsible for nearly 75% of this amount, the U.S. alone made up the lion’s share with 38% of the global total. In fact, its YoY rise in spending alone of $49.2 billion rivals Germany’s entire spending for the same year.
Naturally, many questions rise about where this money goes, including the inevitable surplus of military equipment, from night vision goggles to armored vehicles, that trickles down to law enforcement around the nation.
Here’s how world’s top 10 military spenders compare against each other:
| Country | Military Spending ('19) | YoY % change | Military Spending as % of GDP ('19) |
|---|---|---|---|
| U.S. 🇺🇸 | $731.8B | +5.3% | 3.4% |
| China 🇨🇳 | $261.1B | +5.1% | 1.9% |
| India 🇮🇳 | $71.1B | +6.8% | 2.4% |
| Russia 🇷🇺 | $65.1B | +4.5% | 3.9% |
| Saudi Arabia 🇸🇦 | $61.2B | -16.0% | 8.0% |
| France 🇫🇷 | $50.1B | +1.6% | 1.9% |
| Germany 🇩🇪 | $49.3B | +10.0% | 1.3% |
| UK 🇬🇧 | $48.7B | 0.0% | 1.7% |
| Japan 🇯🇵 | $47.6B | -0.1% | 0.9% |
| South Korea 🇰🇷 | $43.9B | +7.5% | 2.7% |
| Global Total | $1.92T | +3.6% | 2.2% |
China and India, currently embroiled in a border dispute, have upped the ante for military spending in Asia. India is also involved in clashes with its neighbor Pakistan for territorial claim over Kashmir—one of the most contested borders in the world.
India’s tensions and rivalry with both Pakistan and China are among the major drivers for its increased military spending.
—Siemon T. Wezeman, SIPRI Senior Researcher
Germany leads among the top spenders in terms of highest YoY military spending increases. According to SIPRI, this is a preemptive measure in the face of perceived growing Russian threats.
These concerns may not be unfounded, considering that Russia comes in fourth for defense expenditures on the global stage—and budgets more towards military spending than any country in Europe, at 3.9% of its total GDP.
Military Spending as a Share of GDP
Looking more closely at the numbers, it’s clear that some nations place a higher value on defense than others. A country’s military expenses as a share of GDP is the most straightforward expression of this.
How do the biggest spenders change when this measure is taken into consideration?
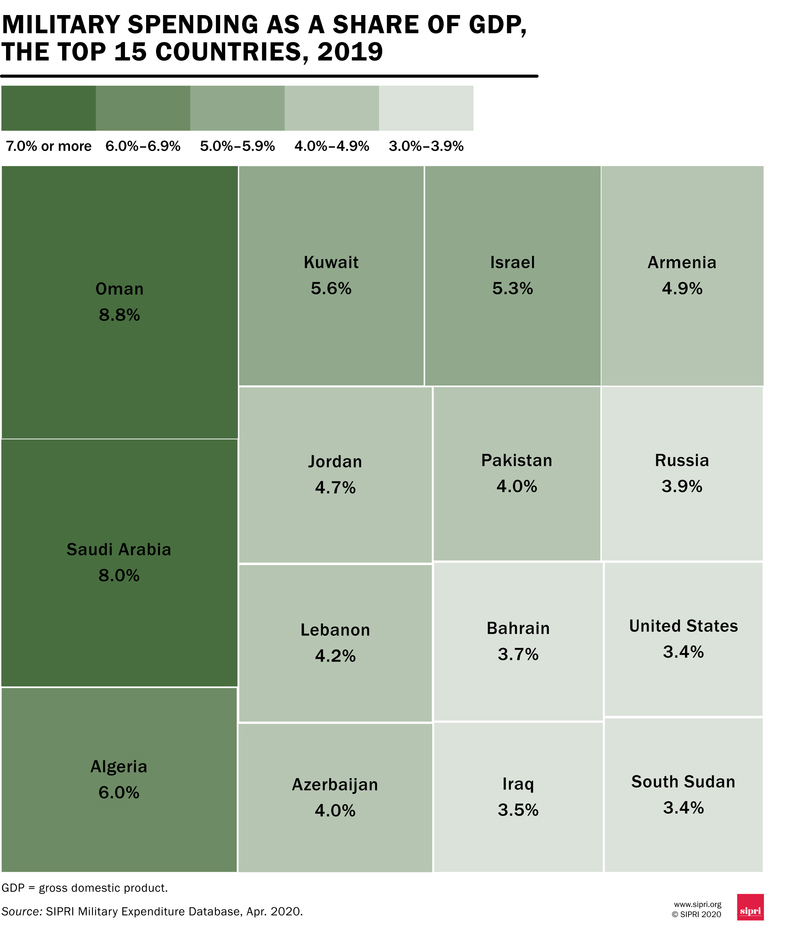
Eight of the 15 countries with the highest military spending as a percentage of GDP are concentrated in the Middle East, with an average allocation of 4.5% of a nation’s GDP.
It’s worth noting that data is missing for various countries in the Middle East, such as Yemen, which has been mired in a civil war since 2011. While SIPRI estimates that combined military spending in the region fell by 7.5% in 2019, these significant data gaps mean that such estimates may not in fact line up with the reality.
Explore the full data set of all available countries below.
| Country | 2019 Spending, US$B | 2019 Share of GDP |
|---|---|---|
| U.S. | $731.75 | 3.4% |
| China | $261.08 | 1.9% |
| India | $71.13 | 2.4% |
| Russia | $65.10 | 3.9% |
| Saudi Arabia | $61.87 | 8.0% |
| France | $50.12 | 1.9% |
| Germany | $49.28 | 1.3% |
| UK | $48.65 | 1.7% |
| Japan | $47.61 | 0.9% |
| South Korea | $43.89 | 2.7% |
| Italy | $26.79 | 1.4% |
| Australia | $25.91 | 1.9% |
| Canada | $22.20 | 1.3% |
| Israel | $20.47 | 5.3% |
| Turkey | $20.45 | 2.7% |
| Spain | $17.18 | 1.2% |
| Iran | $12.62 | 2.3% |
| Netherlands | $12.06 | 1.3% |
| Poland | $11.90 | 2.0% |
| Singapore | $11.21 | 3.2% |
| Taiwan | $10.42 | 1.7% |
| Algeria | $10.30 | 6.0% |
| Pakistan | $10.26 | 4.0% |
| Colombia | $10.08 | 3.2% |
| Kuwait | $7.71 | 5.6% |
| Indonesia | $7.67 | 0.7% |
| Iraq | $7.60 | 3.5% |
| Thailand | $7.32 | 1.3% |
| Norway | $7.00 | 1.7% |
| Oman | $6.73 | 8.8% |
| Mexico | $6.54 | 0.5% |
| Sweden | $5.92 | 1.1% |
| Greece | $5.47 | 2.6% |
| Ukraine | $5.23 | 3.4% |
| Switzerland | $5.18 | 0.7% |
| Romania | $4.95 | 2.0% |
| Belgium | $4.82 | 0.9% |
| Denmark | $4.56 | 1.3% |
| Portugal | $4.51 | 1.9% |
| Bangladesh | $4.36 | 1.3% |
| Finland | $3.97 | 1.5% |
| Malaysia | $3.77 | 1.0% |
| Egypt | $3.74 | 1.2% |
| Morocco | $3.72 | 3.1% |
| Philippines | $3.47 | 1.0% |
| South Africa | $3.47 | 1.0% |
| Austria | $3.24 | 0.7% |
| Argentina | $3.14 | 0.7% |
| New Zealand | $2.93 | 1.5% |
| Czechia | $2.91 | 1.2% |
| Brazil | $2.73 | 1.5% |
| Peru | $2.73 | 1.2% |
| Lebanon | $2.52 | 4.2% |
| Bulgaria | $2.13 | 3.2% |
| Jordan | $2.03 | 4.7% |
| Hungary | $1.90 | 1.2% |
| Slovakia | $1.87 | 1.8% |
| Nigeria | $1.86 | 0.5% |
| Azerbaijan | $1.85 | 4.0% |
| Ecuador | $1.77 | 2.3% |
| Kazakhstan | $1.77 | 1.1% |
| Sri Lanka | $1.67 | 1.9% |
| Angola | $1.47 | 1.6% |
| Bahrain | $1.41 | 3.7% |
| Uruguay | $1.22 | 2.0% |
| Kenya | $1.15 | 1.2% |
| Chile | $1.15 | 1.8% |
| Serbia | $1.14 | 2.2% |
| Ireland | $1.11 | 0.3% |
| Lithuania | $1.08 | 2.0% |
| Croatia | $1.01 | 1.7% |
| Tunisia | $1.00 | 2.6% |
| Tanzania | $0.80 | 1.3% |
| Belarus | $0.78 | 1.2% |
| Sudan | $0.72 | 1.6% |
| Latvia | $0.71 | 2.0% |
| Armenia | $0.67 | 4.9% |
| Estonia | $0.66 | 2.1% |
| Uganda | $0.65 | 2.1% |
| Dominican Republic | $0.62 | 0.7% |
| Cambodia | $0.60 | 2.3% |
| Bolivia | $0.60 | 1.4% |
| Slovenia | $0.57 | 1.1% |
| Zimbabwe | $0.55 | 0.7% |
| Ethiopia | $0.55 | 0.6% |
| Côte d’Ivoire | $0.54 | 1.1% |
| Botswana | $0.52 | 2.8% |
| Mali | $0.47 | 2.7% |
| Luxembourg | $0.43 | 0.6% |
| Nepal | $0.43 | 1.6% |
| Cameroon | $0.42 | 1.1% |
| Paraguay | $0.42 | 1.0% |
| Brunei | $0.42 | 3.3% |
| Namibia | $0.41 | 3.0% |
| Honduras | $0.40 | 1.6% |
| Cyprus | $0.40 | 1.6% |
| Burkina Faso | $0.36 | 2.4% |
| DRC | $0.35 | 0.7% |
| Senegal | $0.35 | 1.5% |
| Guatemala | $0.34 | 0.4% |
| El Salvador | $0.32 | 1.2% |
| Georgia | $0.32 | 2.0% |
| Republic of Congo | $0.30 | 2.7% |
| Zambia | $0.29 | 1.2% |
| Gabon | $0.27 | 1.6% |
| Jamaica | $0.27 | 1.6% |
| Chad | $0.24 | 2.2% |
| Ghana | $0.23 | 0.4% |
| Afghanistan | $0.23 | 1.2% |
| Albania | $0.20 | 1.3% |
| Guinea | $0.20 | 2.0% |
| Bosnia-Herzegovina | $0.18 | 0.9% |
| Niger | $0.17 | 1.8% |
| Togo | $0.17 | 3.1% |
| Trinidad & Tobago | $0.17 | 0.7% |
| Mauritiana | $0.16 | 2.8% |
| North Macedonia | $0.15 | 1.2% |
| Mozambique | $0.14 | 0.9% |
| Krygyzstan | $0.12 | 1.5% |
| Guyana | $0.12 | 1.7% |
| Rwanda | $0.12 | 1.2% |
| Mongolia | $0.10 | 0.7% |
| Montenegro | $0.09 | 1.6% |
| eSwatini | $0.09 | 1.8% |
| South Sudan | $0.09 | 3.4% |
| Malta | $0.80 | 0.6% |
| Fiji | $0.08 | 1.6% |
| Nicaragua | $0.08 | 0.7% |
| Papua New Guinea | $0.08 | 0.4% |
| Madagascar | $0.08 | 0.6% |
| Benin | $0.07 | 0.7% |
| Malawi | $0.07 | 0.9% |
| Kosovo | $0.07 | 0.8% |
| Burundi | $0.06 | 1.8% |
| Lesotho | $0.04 | 1.5% |
| Moldova | $0.04 | 0.4% |
| Timor-Leste | $0.03 | 1.0% |
| Central African Republic | $0.03 | 1.5% |
| Sierra Leone | $0.03 | 0.7% |
| Seychelles | $0.02 | 1.3% |
| Belize | $0.02 | 1.2% |
| Mauritius | $0.02 | 0.2% |
| Liberia | $0.02 | 0.5% |
| Gambia | $0.01 | 0.8% |
| Cape Verde | $0.01 | 0.5% |
| Haiti | $0 | 0.0% |
| Costa Rica | $0 | 0.0% |
| Iceland | $0 | 0.0% |
| Panama | $0 | 0.0% |


Markets
China’s Real Estate Crisis, Shown in Two Charts
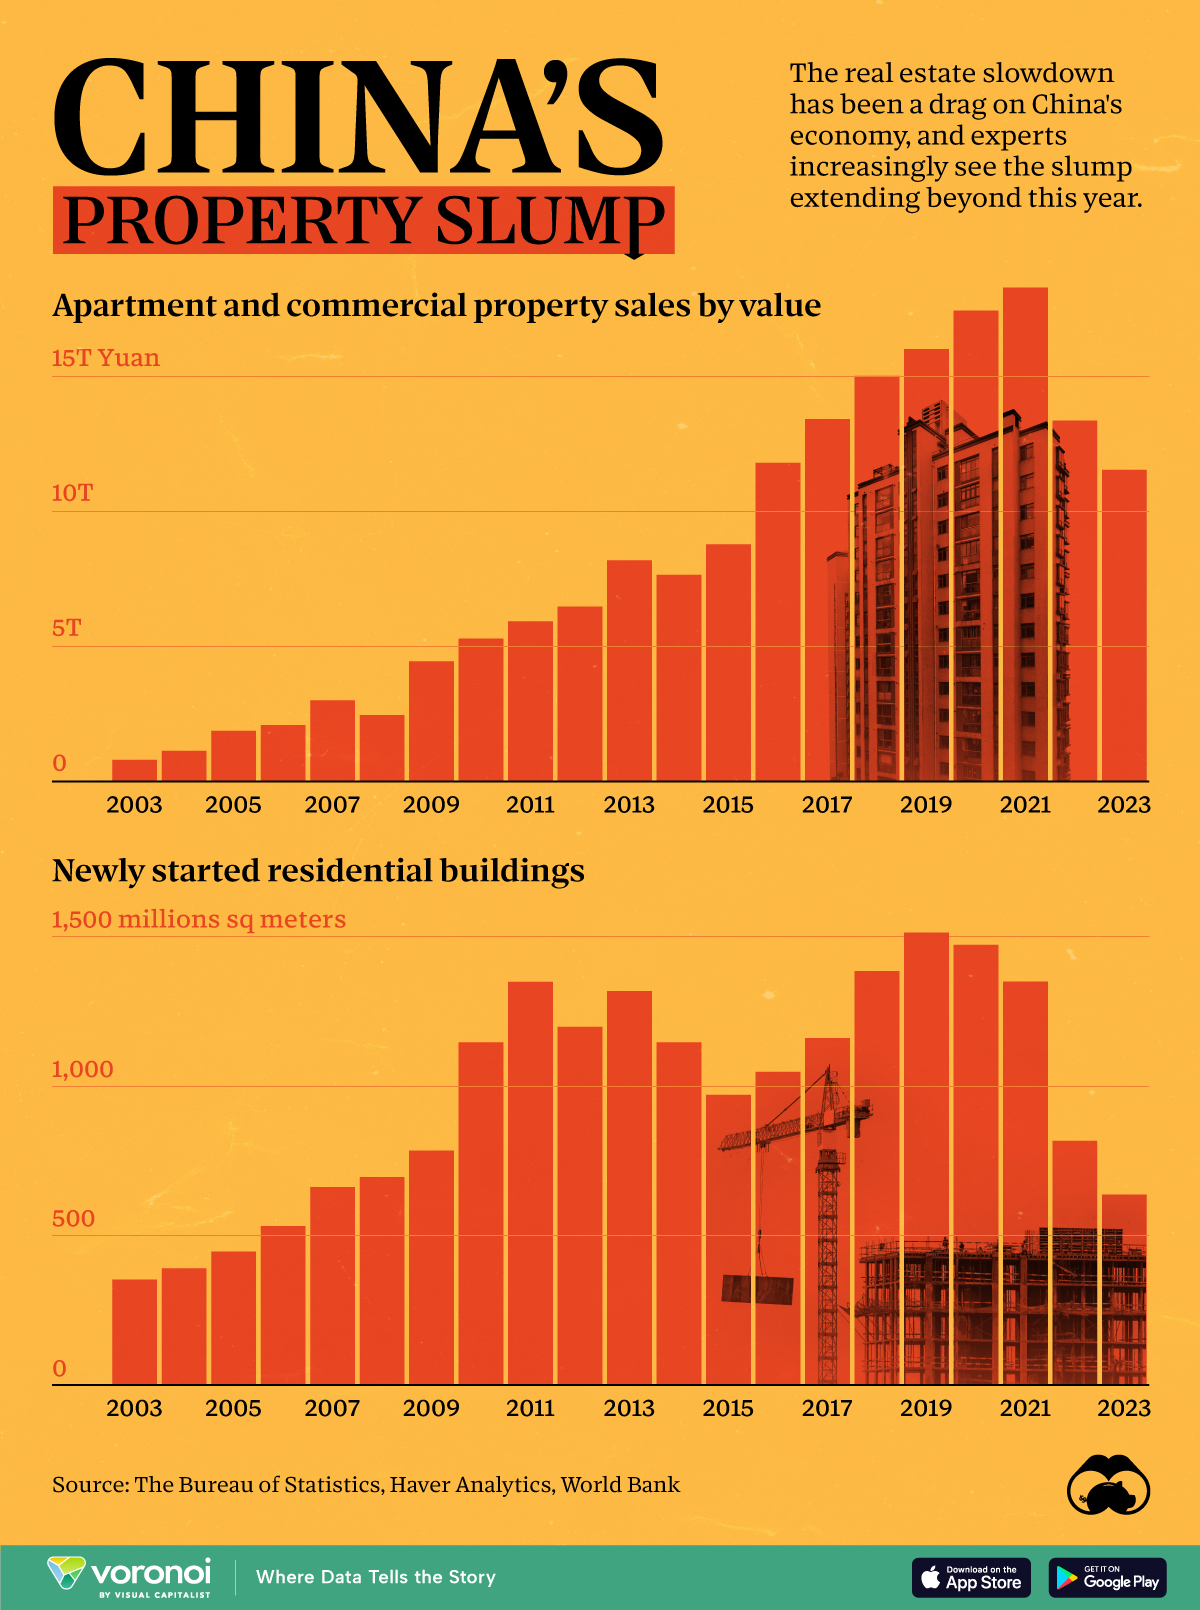
These charts show China’s real estate boom in the 21st century and the subsequent slowdown since 2022.
Visualizing China’s Real Estate Boom and Crisis
This was originally posted on our Voronoi app. Download the app for free on iOS or Android and discover incredible data-driven charts from a variety of trusted sources.
Evergrande—once China’s largest real estate developer—was forced to liquidate on January 28th. It was yet another strike against the country’s now fledgling real estate market, adding to a growing list of China’s economic worries.
In the charts above we show two annual metrics related to China’s real estate crisis from 2003 to 2023. The first looks at apartment and commercial property sales using Burreau of Statistics data from Bloomberg, and the second examines new housing starts using data from the World Bank.
Things to Know About China’s Property Slump
Property sales by value in China climbed pretty steadily from less than ¥1 trillion RMB in 2003 to over ¥15 trillion in 2021, but have since dropped to under ¥12 trillion in 2023.
This was the case across both residential and commercial sales. In China’s residential market specifically, new home sales dropped 6% in 2023, with secondhand home prices declining in major cities.
And on the development side, new residential developments have fallen 58% from 1,515 million m² in 2019 to 637 million m² in 2023.
| Year | New Residential Building Developments (million sq meters) |
|---|---|
| 2023 | 637.4 |
| 2022 | 817.3 |
| 2021 | 1,350.2 |
| 2020 | 1,473.4 |
| 2019 | 1,514.5 |
| 2018 | 1,385.4 |
| 2017 | 1,160.9 |
| 2016 | 1,047.8 |
| 2015 | 970.8 |
| 2014 | 1,146.4 |
| 2013 | 1,318.5 |
| 2012 | 1,199.1 |
| 2011 | 1,349.4 |
| 2010 | 1,147.2 |
| 2009 | 784.9 |
| 2008 | 695.4 |
| 2007 | 662.3 |
| 2006 | 531.8 |
| 2005 | 446.5 |
| 2004 | 390.0 |
| 2003 | 352.4 |
| 2002 | 276.5 |
Here are a few more things to know about the ongoing real estate crisis in China:
- Developer Defaults: Real estate firms faced $125 billion in bond defaults between 2020 and 2023.
- Economic Impact: The property sector’s slump has dragged down China’s economy, leading to layoffs and financial instability.
- Getting Creative: Municipalities, many of which rely on land sales as a key source of income, have been introducing “old-for-new” support measures meant to stimulate new home purchases.
Experts predict a prolonged downturn, with many people souring on Chinese investments, but exactly how things will develop after Evergrande’s collapse is unclear.

-

 Energy1 week ago
The World’s Biggest Nuclear Energy Producers
-

 Money2 weeks ago
Which States Have the Highest Minimum Wage in America?
-

 Technology2 weeks ago
Ranked: Semiconductor Companies by Industry Revenue Share
-

 Markets2 weeks ago
Ranked: The World’s Top Flight Routes, by Revenue
-

 Countries2 weeks ago
Population Projections: The World’s 6 Largest Countries in 2075
-

 Markets2 weeks ago
The Top 10 States by Real GDP Growth in 2023
-

 Demographics2 weeks ago
The Smallest Gender Wage Gaps in OECD Countries
-

 United States2 weeks ago
Where U.S. Inflation Hit the Hardest in March 2024