Demographics
The Population of China in Perspective


The Population of China in Perspective
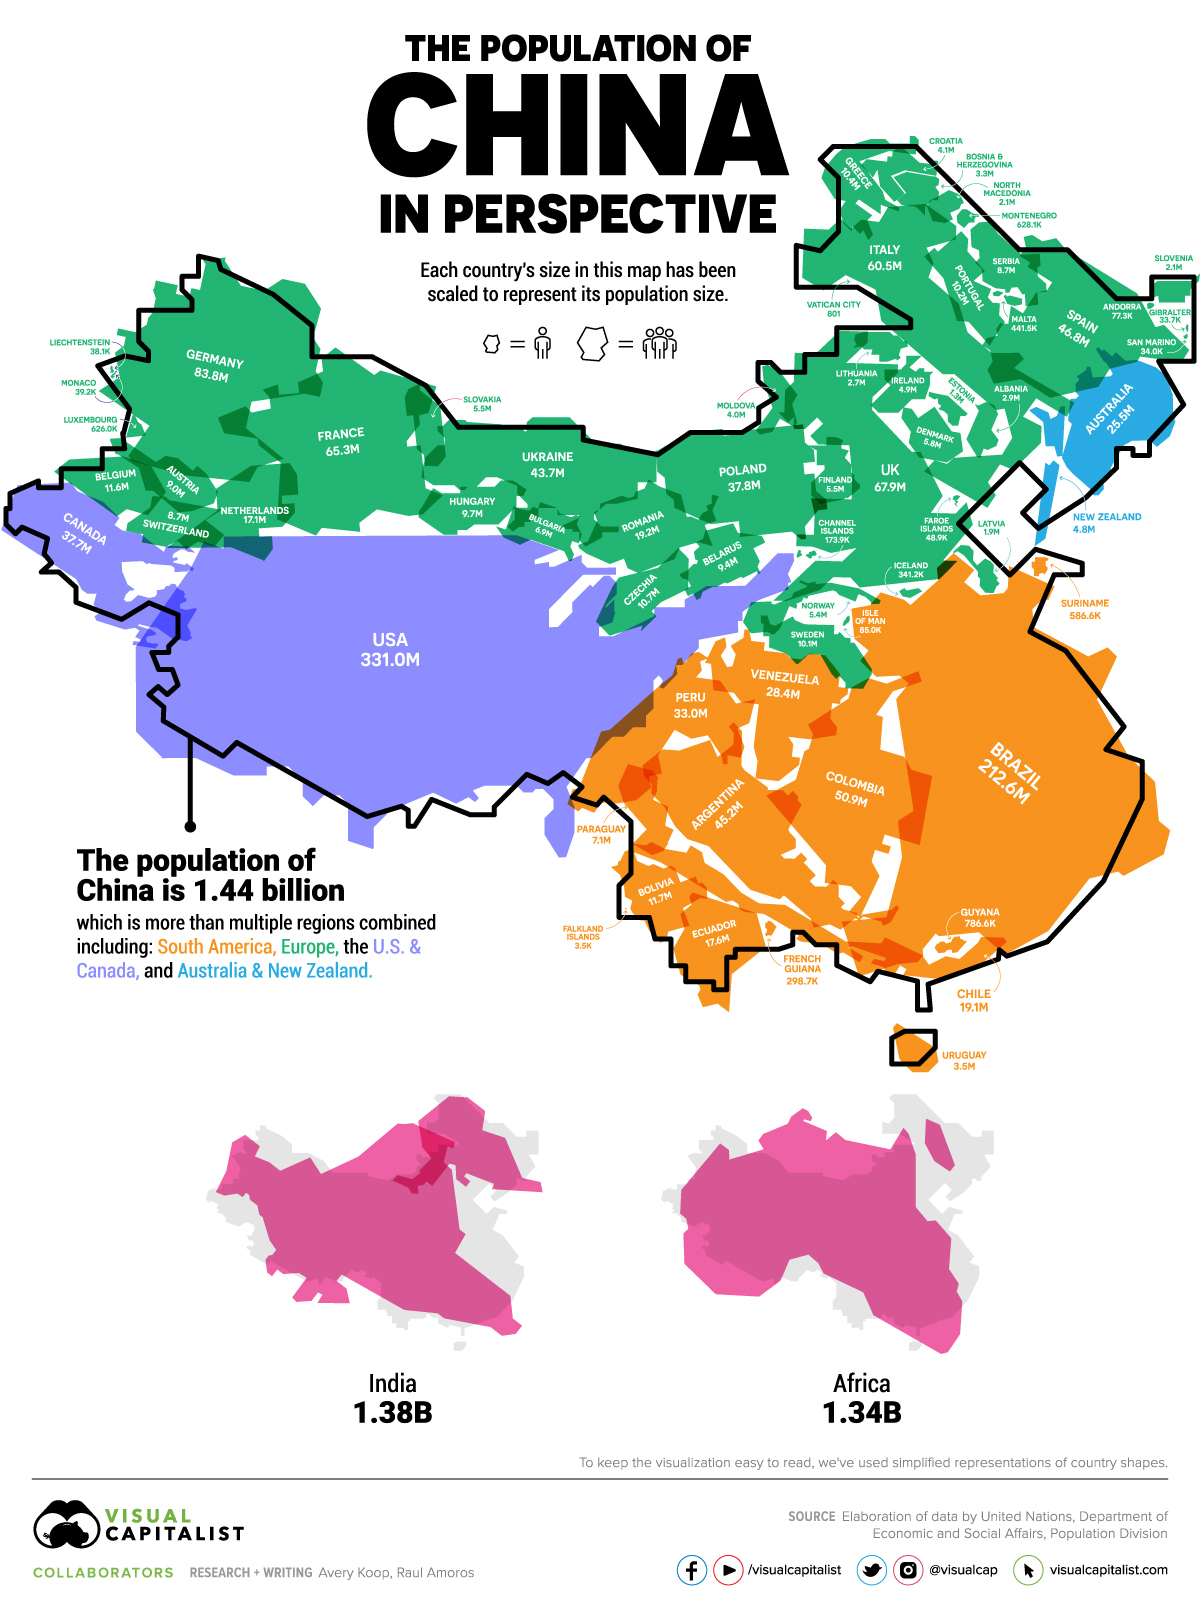
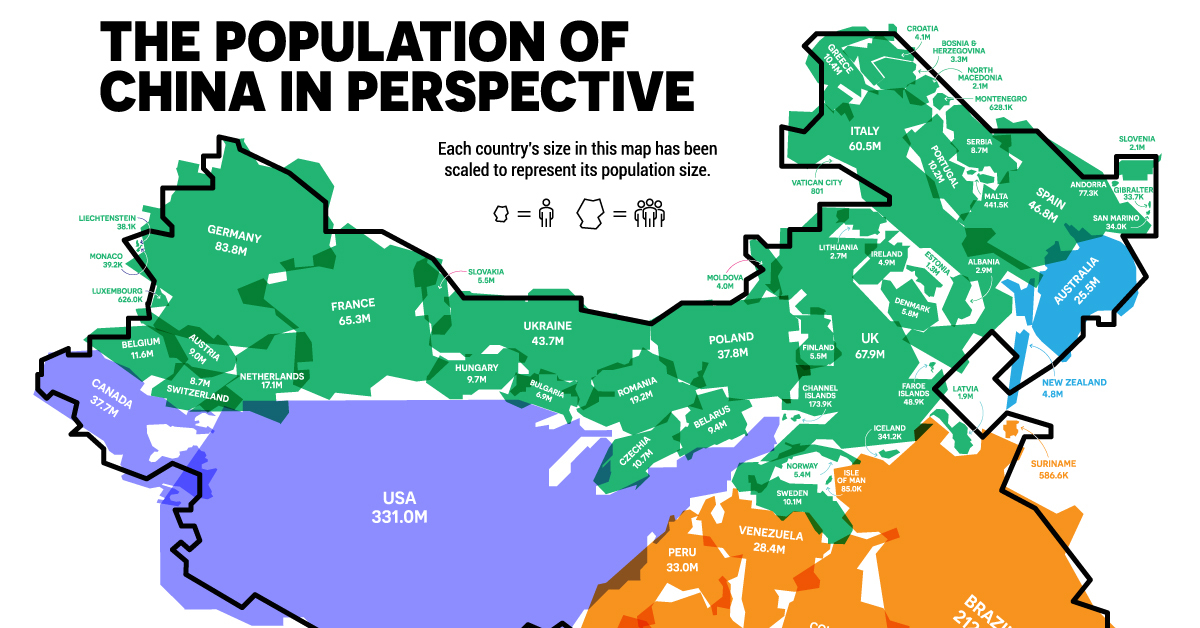
China is the world’s most populous country with an astounding 1.44 billion citizens. Altogether, the size of the population of China is larger than nearly four regions combined: South America, Europe (excluding Russia), the U.S. & Canada, and Australia & New Zealand.
Using data from the United Nations, this unconventional map reveals the comparative size of China’s population next to a multitude of other countries.
Note: To keep the visualization easy to read, we’ve simplified the shapes representing countries. For example, although we’ve included Alaska and Hawaii in U.S. population totals, the U.S. is represented by the contiguous states map only.
A Historical Perspective
Looking at history, the population of China has more than doubled since the 1950s. The country was the first in the world to hit one billion people in 1980.
However, in 1979, in an attempt to control the burgeoning population, the infamous one-child policy was introduced, putting controls on how many children Chinese citizens could have.
While the government eventually recognized the negative implications of this policy, it appeared to be too little, too late. The two-child policy was introduced in 2016, but it has not yet reversed the current slowdown in population growth.
| Year | China's Population (Millions) | Annual Rate of Growth (%) | Median Age | Fertility Rate |
|---|---|---|---|---|
| 1955 | 612.2 | 2.00% | 22.2 | 6.11 |
| 1960 | 660.4 | 1.53% | 21.3 | 5.48 |
| 1965 | 724.2 | 1.86% | 19.8 | 6.15 |
| 1970 | 827.6 | 2.70% | 19.3 | 6.30 |
| 1975 | 926.2 | 2.28% | 20.3 | 4.85 |
| 1980 | 1,000.1 | 1.55% | 21.9 | 3.01 |
| 1985 | 1,075.6 | 1.47% | 23.5 | 2.52 |
| 1990 | 1,176.9 | 1.82% | 24.9 | 2.73 |
| 1995 | 1,240.9 | 1.07% | 27.4 | 1.83 |
| 2000 | 1,290.6 | 0.79% | 30.0 | 1.62 |
| 2005 | 1,330.8 | 0.62% | 32.6 | 1.61 |
| 2010 | 1,368.8 | 0.57% | 35.0 | 1.62 |
| 2015 | 1,406.8 | 0.55% | 36.7 | 1.64 |
| 2016 | 1,414.0 | 0.51% | 37.0 | 1.65 |
| 2017 | 1,421.0 | 0.49% | 37.0 | 1.65 |
| 2018 | 1,427.6 | 0.47% | 37.0 | 1.65 |
| 2019 | 1,433.8 | 0.43% | 37.0 | 1.65 |
| 2020 | 1,439.3 | 0.39% | 38.4 | 1.69 |
The fertility rate has been consistently falling from over 6 births per woman in 1955 to 1.69 in 2020. Today, the median age in China is 38 years old, rising from 22 in 1955. Longer life spans and fewer births form a demographic trend that has many social and economic implications.
Overall, China’s young population is becoming scarcer, meaning that the domestic labor market will eventually begin shrinking. Additionally, the larger share of elderly citizens will require publicly-funded resources, resulting in a heavier societal and financial burden.
Strength in Numbers
Despite these trends, however, China’s current population remains massive, constituting almost 20% of the world’s total population. Right now 71% of the Chinese population is between the ages of 15 and 65 years old, meaning that the labor supply is still immense.
Here are the populations of 65 countries from various regions of the world—and added together, you’ll see they still fall short of the population of China:
| Country | Population | Region |
|---|---|---|
| 🇺🇸 U.S. | 331,002,651 | North America |
| 🇨🇦 Canada | 37,742,154 | North America |
| 🇧🇷 Brazil | 212,559,417 | South America |
| 🇨🇴 Colombia | 50,882,891 | South America |
| 🇦🇷 Argentina | 45,195,774 | South America |
| 🇵🇪 Peru | 32,971,854 | South America |
| 🇻🇪 Venezuela | 28,435,940 | South America |
| 🇨🇱 Chile | 19,116,201 | South America |
| 🇪🇨 Ecuador | 17,643,054 | South America |
| 🇧🇴 Bolivia | 11,673,021 | South America |
| 🇵🇾 Paraguay | 7,132,538 | South America |
| 🇺🇾 Uruguay | 3,473,730 | South America |
| 🇬🇾 Guyana | 786,552 | South America |
| 🇸🇷 Suriname | 586,632 | South America |
| 🇬🇫 French Guyana | 298,682 | South America |
| 🇫🇰 Falkland Islands | 3,480 | South America |
| 🇦🇺 Australia | 25,499,884 | Oceania |
| 🇳🇿 New Zealand | 4,822,233 | Oceania |
| 🇩🇪 Germany | 83,783,942 | Europe |
| 🇫🇷 France | 65,273,511 | Europe |
| 🇳🇱 Netherlands | 17,134,872 | Europe |
| 🇧🇪 Belgium | 11,589,623 | Europe |
| 🇦🇹 Austria | 9,006,398 | Europe |
| 🇨🇭 Switzerland | 8,654,622 | Europe |
| 🇱🇺 Luxembourg | 625,978 | Europe |
| 🇲🇨 Monaco | 39,242 | Europe |
| 🇱🇮 Liechtenstein | 38,128 | Europe |
| 🇮🇹 Italy | 60,461,826 | Europe |
| 🇪🇸 Spain | 46,754,778 | Europe |
| 🇬🇷 Greece | 10,423,054 | Europe |
| 🇵🇹 Portugal | 10,196,709 | Europe |
| 🇷🇸 Serbia | 8,737,371 | Europe |
| 🇭🇷 Croatia | 4,105,267 | Europe |
| 🇧🇦 Bosnia and Herzegovina | 3,280,819 | Europe |
| 🇦🇱 Albania | 2,877,797 | Europe |
| 🇲🇰 North Macedonia | 2,083,374 | Europe |
| 🇸🇮 Slovenia | 2,078,938 | Europe |
| 🇲🇪 Montenegro | 628,066 | Europe |
| 🇲🇹 Malta | 441,543 | Europe |
| 🇦🇩 Andorra | 77,265 | Europe |
| 🇸🇲 San Marino | 33,931 | Europe |
| 🇬🇮 Gibraltar | 33,691 | Europe |
| 🇻🇦 Vatican City | 801 | Europe |
| 🇬🇧 United Kingdom | 67,886,011 | Europe |
| 🇸🇪 Sweden | 10,099,265 | Europe |
| 🇩🇰 Denmark | 5,792,202 | Europe |
| 🇫🇮 Finland | 5,540,720 | Europe |
| 🇳🇴 Norway | 5,421,241 | Europe |
| 🇮🇪 Ireland | 4,937,786 | Europe |
| 🇱🇹 Lithuania | 2,722,289 | Europe |
| 🇱🇻 Latvia | 1,886,198 | Europe |
| 🇪🇪 Estonia | 1,326,535 | Europe |
| 🇮🇸 Iceland | 341,243 | Europe |
| Channel Islands | 173,863 | Europe |
| 🇮🇲 Isle of Man | 85,033 | Europe |
| 🇫🇴 Faroe Islands | 48,863 | Europe |
| 🇺🇦 Ukraine | 43,733,762 | Europe |
| 🇵🇱 Poland | 37,846,611 | Europe |
| 🇷🇴 Romania | 19,237,691 | Europe |
| 🇨🇿 Czechia | 10,708,981 | Europe |
| 🇭🇺 Hungary | 9,660,351 | Europe |
| 🇧🇾 Belarus | 9,449,323 | Europe |
| 🇧🇬 Bulgaria | 6,948,445 | Europe |
| 🇸🇰 Slovakia | 5,459,642 | Europe |
| 🇲🇩 Moldova | 4,033,963 | Europe |
| Total | 1,431,528,252 |
To break it down even further, here’s a look at the population of each of the regions listed above:
- Australia and New Zealand: 30.3 million
- Europe (excluding Russia): 601.7 million
- South America: 430.8 million
- The U.S. and Canada: 368.7 million
Combined their population is 1.432 billion compared to China’s 1.439 billion.
Overall, the population of China has few comparables. India is one exception, with a population of 1.38 billion. As a continent, Africa comes in close as well at 1.34 billion people. Here’s a breakdown of Africa’s population for further comparison.
| Country | Population | Region |
|---|---|---|
| 🇳🇬 Nigeria | 206,139,589 | Africa |
| 🇬🇭 Ghana | 31,072,940 | Africa |
| 🇨🇮 Côte d'Ivoire | 26,378,274 | Africa |
| 🇳🇪 Niger | 24,206,644 | Africa |
| 🇧🇫 Burkina Faso | 20,903,273 | Africa |
| 🇲🇱 Mali | 20,250,833 | Africa |
| 🇸🇳 Senegal | 16,743,927 | Africa |
| 🇬🇳 Guinea | 13,132,795 | Africa |
| 🇧🇯 Benin | 12,123,200 | Africa |
| 🇹🇬 Togo | 8,278,724 | Africa |
| 🇸🇱 Sierra Leone | 7,976,983 | Africa |
| 🇱🇷 Liberia | 5,057,681 | Africa |
| 🇲🇷 Mauritania | 4,649,658 | Africa |
| 🇬🇲 Gambia | 2,416,668 | Africa |
| 🇬🇼 Guinea-Bissau | 1,968,001 | Africa |
| 🇨🇻 Cabo Verde | 555,987 | Africa |
| 🇸🇭 Saint Helena | 6,077 | Africa |
| 🇿🇦 South Africa | 59,308,690 | Africa |
| 🇳🇦 Namibia | 2,540,905 | Africa |
| 🇧🇼 Botswana | 2,351,627 | Africa |
| 🇱🇸 Lesotho | 2,142,249 | Africa |
| 🇸🇿 Eswatini | 1,160,164 | Africa |
| 🇪🇬 Egypt | 102,334,404 | Africa |
| 🇩🇿 Algeria | 43,851,044 | Africa |
| 🇸🇩 Sudan | 43,849,260 | Africa |
| 🇲🇦 Morocco | 36,910,560 | Africa |
| 🇹🇳 Tunisia | 11,818,619 | Africa |
| 🇱🇾 Libya | 6,871,292 | Africa |
| 🇪🇭 Western Sahara | 597,339 | Africa |
| 🇨🇩 Democratic Republic of the Congo | 89,561,403 | Africa |
| 🇦🇴 Angola | 32,866,272 | Africa |
| 🇨🇲 Cameroon | 26,545,863 | Africa |
| 🇹🇩 Chad | 16,425,864 | Africa |
| 🇨🇬 Congo | 5,518,087 | Africa |
| 🇨🇫 Central African Republic | 4,829,767 | Africa |
| 🇬🇦 Gabon | 2,225,734 | Africa |
| 🇬🇶 Equatorial Guinea | 1,402,985 | Africa |
| 🇸🇹 Sao Tome and Principe | 219,159 | Africa |
| 🇪🇹 Ethiopia | 114,963,588 | Africa |
| 🇹🇿 Tanzania | 59,734,218 | Africa |
| 🇰🇪 Kenya | 53,771,296 | Africa |
| 🇺🇬 Uganda | 45,741,007 | Africa |
| 🇲🇿 Mozambique | 31,255,435 | Africa |
| 🇲🇬 Madagascar | 27,691,018 | Africa |
| 🇲🇼 Malawi | 19,129,952 | Africa |
| 🇿🇲 Zambia | 18,383,955 | Africa |
| 🇸🇴 Somalia | 15,893,222 | Africa |
| 🇿🇼 Zimbabwe | 14,862,924 | Africa |
| 🇷🇼 Rwanda | 12,952,218 | Africa |
| 🇧🇮 Burundi | 11,890,784 | Africa |
| 🇸🇸 South Sudan | 11,193,725 | Africa |
| 🇪🇷 Eritrea | 3,546,421 | Africa |
| 🇲🇺 Mauritius | 1,271,768 | Africa |
| 🇩🇯 Djibouti | 988,000 | Africa |
| 🇷🇪 Réunion | 895,312 | Africa |
| 🇰🇲 Comoros | 869,601 | Africa |
| 🇾🇹 Mayotte | 272,815 | Africa |
| 🇸🇨 Seychelles | 98,347 | Africa |
| Total | 1,340,598,147 |
Future Outlook on the Population of China
Whether or not China’s population growth is slowing appears to be less relevant when looking at its sheer size. While India is expected to match the country’s population by 2026, China will remain one of the world’s largest economic powerhouses regardless.
It is estimated, however, that the population of China will drop below one billion people by the year 2100—bumping the nation to third place in the ranking of the world’s most populous countries. At the same time, it’s possible that China’s economic dominance may be challenged by these same demographic tailwinds as time moves forward.


Demographics
The Countries That Have Become Sadder Since 2010
Tracking Gallup survey data for more than a decade reveals some countries are witnessing big happiness declines, reflecting their shifting socio-economic conditions.


The Countries That Have Become Sadder Since 2010
This was originally posted on our Voronoi app. Download the app for free on iOS or Android and discover incredible data-driven charts from a variety of trusted sources.
Can happiness be quantified?
Some approaches that try to answer this question make a distinction between two differing components of happiness: a daily experience part, and a more general life evaluation (which includes how people think about their life as a whole).
The World Happiness Report—first launched in 2012—has been making a serious go at quantifying happiness, by examining Gallup poll data that asks respondents in nearly every country to evaluate their life on a 0–10 scale. From this they extrapolate a single “happiness score” out of 10 to compare how happy (or unhappy) countries are.
More than a decade later, the 2024 World Happiness Report continues the mission. Its latest findings also include how some countries have become sadder in the intervening years.
Which Countries Have Become Unhappier Since 2010?
Afghanistan is the unhappiest country in the world right now, and is also 60% unhappier than over a decade ago, indicating how much life has worsened since 2010.
In 2021, the Taliban officially returned to power in Afghanistan, after nearly two decades of American occupation in the country. The Islamic fundamentalist group has made life harder, especially for women, who are restricted from pursuing higher education, travel, and work.
On a broader scale, the Afghan economy has suffered post-Taliban takeover, with various consequent effects: mass unemployment, a drop in income, malnutrition, and a crumbling healthcare system.
| Rank | Country | Happiness Score Loss (2010–24) | 2024 Happiness Score (out of 10) |
|---|---|---|---|
| 1 | 🇦🇫 Afghanistan | -2.6 | 1.7 |
| 2 | 🇱🇧 Lebanon | -2.3 | 2.7 |
| 3 | 🇯🇴 Jordan | -1.5 | 4.2 |
| 4 | 🇻🇪 Venezuela | -1.3 | 5.6 |
| 5 | 🇲🇼 Malawi | -1.2 | 3.4 |
| 6 | 🇿🇲 Zambia | -1.2 | 3.5 |
| 7 | 🇧🇼 Botswana | -1.2 | 3.4 |
| 8 | 🇾🇪 Yemen | -1.0 | 3.6 |
| 9 | 🇪🇬 Egypt | -1.0 | 4.0 |
| 10 | 🇮🇳 India | -0.9 | 4.1 |
| 11 | 🇧🇩 Bangladesh | -0.9 | 3.9 |
| 12 | 🇨🇩 DRC | -0.7 | 3.3 |
| 13 | 🇹🇳 Tunisia | -0.7 | 4.4 |
| 14 | 🇨🇦 Canada | -0.6 | 6.9 |
| 15 | 🇺🇸 U.S. | -0.6 | 6.7 |
| 16 | 🇨🇴 Colombia | -0.5 | 5.7 |
| 17 | 🇵🇦 Panama | -0.5 | 6.4 |
| 18 | 🇵🇰 Pakistan | -0.5 | 4.7 |
| 19 | 🇿🇼 Zimbabwe | -0.5 | 3.3 |
| 20 | 🇮🇪 Ireland | -0.5 | 6.8 |
| N/A | 🌍 World | +0.1 | 5.5 |
Nine countries in total saw their happiness score drop by a full point or more, on the 0–10 scale.
Noticeably, many of them have seen years of social and economic upheaval. Lebanon, for example, has been grappling with decades of corruption, and a severe liquidity crisis since 2019 that has resulted in a banking system collapse, sending poverty levels skyrocketing.
In Jordan, unprecedented population growth—from refugees leaving Iraq and Syria—has aggravated unemployment rates. A somewhat abrupt change in the line of succession has also raised concerns about political stability in the country.

-

 Markets1 week ago
U.S. Debt Interest Payments Reach $1 Trillion
-

 Business2 weeks ago
Charted: Big Four Market Share by S&P 500 Audits
-

 Real Estate2 weeks ago
Ranked: The Most Valuable Housing Markets in America
-

 Money2 weeks ago
Which States Have the Highest Minimum Wage in America?
-

 AI2 weeks ago
Ranked: Semiconductor Companies by Industry Revenue Share
-

 Markets2 weeks ago
Ranked: The World’s Top Flight Routes, by Revenue
-

 Demographics2 weeks ago
Population Projections: The World’s 6 Largest Countries in 2075
-

 Markets2 weeks ago
The Top 10 States by Real GDP Growth in 2023