Misc
Mapped: Countries by Alcohol Consumption Per Capita

var divElement = document.getElementById(‘viz1710540551170’); var vizElement = divElement.getElementsByTagName(‘object’)[0]; vizElement.style.width=’1200px’;vizElement.style.height=’2094px’; var scriptElement = document.createElement(‘script’); scriptElement.src = ‘https://public.tableau.com/javascripts/api/viz_v1.js’; vizElement.parentNode.insertBefore(scriptElement, vizElement);
Mapped: Countries by Alcohol Consumption Per Capita
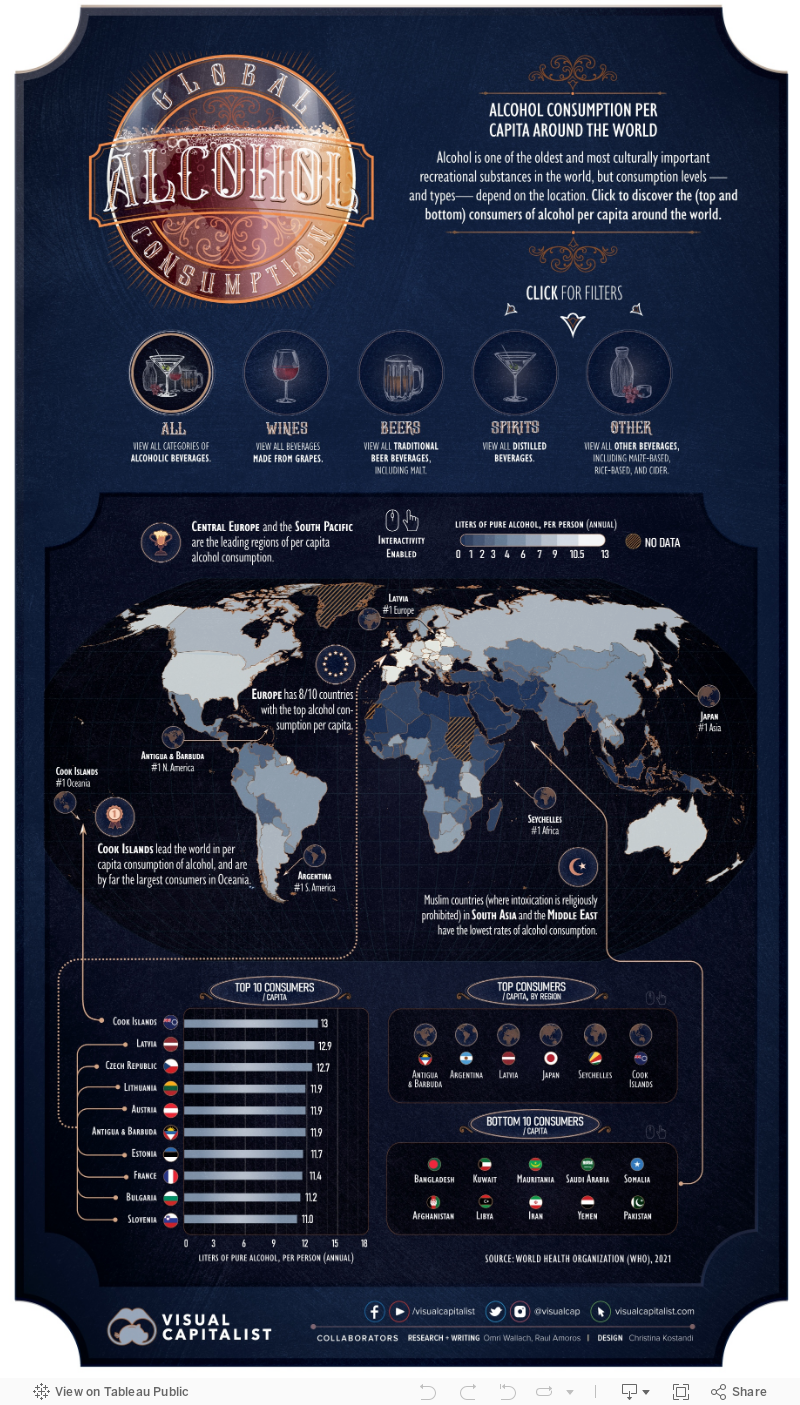
Alcohol might be one of the oldest and most frequently used recreational substances in the world, but examining countries by alcohol consumption shows that usage is not equal.
Consumption levels, and types of alcohol consumed, vary widely based on location. Furthermore, the availability of fruits and grains used in alcohol production impacts which drinks are more commonly consumed, as does the predominant culture. Some cultures see alcohol consumption as a pleasurable experience, while others see intoxication as a sin.
There’s also the question of economics and availability. It’s strange, but in some regions of the world, industrially mass-produced alcohol can flood markets and become cheaper than other beverages, including water.
When we map alcohol consumption by capita, and by different types of alcohol, these local and cultural stories come to light. The above maps use recorded consumption data from WHO for 2019, in liters of pure alcohol.
Europe Leads in Per Capita Alcohol Consumption
The top 10 countries by alcohol consumption highlight the prominence of alcoholic beverages in European culture.
Eight of the 10 countries with the top alcohol consumption per capita were in Europe. Primarily, they were Eastern and Central European countries, including #2 Latvia, #3 Czech Republic, #4 Lithuania, and #5 Austria.
But the crown of alcohol consumption per capita goes to the Cook Islands, which leads the world with an annual per capita consumption of 13L (3.4 gallons) of alcohol.
| Location | 2019 Alcohol consumption/capita (L) |
|---|---|
| Cook Islands | 12.97 |
| Latvia | 12.90 |
| Czech Republic | 12.73 |
| Lithuania | 11.93 |
| Austria | 11.90 |
| Antigua and Barbuda | 11.88 |
| Estonia | 11.65 |
| France | 11.44 |
| Bulgaria | 11.18 |
| Slovenia | 11.05 |
| Luxembourg | 11.00 |
| Andorra | 10.99 |
| Romania | 10.96 |
| Poland | 10.96 |
| Ireland | 10.91 |
| Hungary | 10.79 |
| Spain | 10.72 |
| Belarus | 10.57 |
| Germany | 10.56 |
| Portugal | 10.37 |
| Slovakia | 10.30 |
| Barbados | 9.94 |
| Montenegro | 9.91 |
| UK | 9.80 |
| Cyprus | 9.64 |
| Croatia | 9.64 |
| Australia | 9.51 |
| Seychelles | 9.48 |
| Bahamas | 9.48 |
| Switzerland | 9.41 |
| Saint Lucia | 9.30 |
| New Zealand | 9.17 |
| Denmark | 9.16 |
| Belgium | 9.15 |
| U.S. | 8.93 |
| Saint Kitts and Nevis | 8.84 |
| Grenada | 8.62 |
| Niue | 8.50 |
| Japan | 8.36 |
| Netherlands | 8.23 |
| Finland | 8.23 |
| Lao People's Democratic Republic | 8.15 |
| Malta | 8.07 |
| Canada | 8.00 |
| Argentina | 7.95 |
| United Republic of Tanzania | 7.81 |
| Chile | 7.80 |
| South Korea | 7.74 |
| Iceland | 7.72 |
| Eswatini | 7.68 |
| Italy | 7.65 |
| Saint Vincent and the Grenadines | 7.48 |
| Serbia | 7.45 |
| Republic of Moldova | 7.45 |
| Georgia | 7.45 |
| Russian Federation | 7.29 |
| Burkina Faso | 7.28 |
| South Africa | 7.21 |
| Sweden | 7.10 |
| Thailand | 6.86 |
| Uganda | 6.82 |
| Suriname | 6.60 |
| Panama | 6.54 |
| Gabon | 6.47 |
| Rwanda | 6.35 |
| Greece | 6.33 |
| Dominica | 6.32 |
| Brazil | 6.12 |
| Equatorial Guinea | 6.11 |
| Norway | 6.05 |
| Botswana | 5.98 |
| Belize | 5.93 |
| Angola | 5.84 |
| Trinidad and Tobago | 5.81 |
| Peru | 5.74 |
| Congo | 5.74 |
| Ukraine | 5.69 |
| Dominican Republic | 5.56 |
| Paraguay | 5.47 |
| Mongolia | 5.46 |
| Bosnia and Herzegovina | 5.46 |
| Uruguay | 5.42 |
| Guyana | 5.11 |
| Philippines | 4.85 |
| Cuba | 4.70 |
| Cabo Verde | 4.70 |
| Cambodia | 4.56 |
| Nigeria | 4.49 |
| China | 4.48 |
| Albania | 4.40 |
| Mexico | 4.25 |
| Sao Tome and Principe | 4.23 |
| Colombia | 4.09 |
| Cameroon | 4.09 |
| Burundi | 4.07 |
| Kyrgyzstan | 4.02 |
| Macedonia | 3.90 |
| Zambia | 3.82 |
| Armenia | 3.77 |
| Kazakhstan | 3.73 |
| Nicaragua | 3.69 |
| North Korea | 3.61 |
| Lesotho | 3.56 |
| Jamaica | 3.46 |
| Viet Nam | 3.41 |
| Mauritius | 3.39 |
| Sierra Leone | 3.22 |
| Guinea-Bissau | 3.21 |
| Liberia | 3.12 |
| Zimbabwe | 3.11 |
| India | 3.09 |
| Israel | 3.07 |
| Costa Rica | 3.07 |
| Ecuador | 3.05 |
| Bolivia | 2.98 |
| El Salvador | 2.94 |
| Turkmenistan | 2.88 |
| Haiti | 2.85 |
| Honduras | 2.73 |
| Fiji | 2.71 |
| Gambia | 2.67 |
| Sri Lanka | 2.58 |
| Venezuela | 2.51 |
| Uzbekistan | 2.45 |
| Nauru | 2.44 |
| Namibia | 2.38 |
| Samoa | 2.18 |
| Myanmar | 2.06 |
| Malawi | 2.04 |
| United Arab Emirates | 2.03 |
| Singapore | 1.81 |
| Côte d’Ivoire | 1.70 |
| Kenya | 1.68 |
| Guatemala | 1.63 |
| Vanuatu | 1.60 |
| Micronesia | 1.59 |
| Ghana | 1.59 |
| Tunisia | 1.51 |
| Mozambique | 1.46 |
| Togo | 1.40 |
| Maldives | 1.38 |
| Azerbaijan | 1.38 |
| Papua New Guinea | 1.26 |
| Benin | 1.25 |
| Solomon Islands | 1.19 |
| Turkey | 1.18 |
| Bahrain | 1.18 |
| Ethiopia | 1.16 |
| Lebanon | 1.14 |
| Qatar | 0.96 |
| Central African Republic | 0.94 |
| Tuvalu | 0.93 |
| Eritrea | 0.93 |
| Madagascar | 0.89 |
| Tajikistan | 0.85 |
| Brunei Darussalam | 0.69 |
| Malaysia | 0.64 |
| Mali | 0.60 |
| Algeria | 0.59 |
| Democratic Republic of the Congo | 0.56 |
| Chad | 0.55 |
| Morocco | 0.51 |
| Oman | 0.47 |
| Kiribati | 0.43 |
| Timor-Leste | 0.41 |
| Nepal | 0.36 |
| Guinea | 0.33 |
| Tonga | 0.31 |
| Senegal | 0.25 |
| Jordan | 0.25 |
| Djibouti | 0.21 |
| Comoros | 0.18 |
| Iraq | 0.16 |
| Egypt | 0.14 |
| Syrian Arab Republic | 0.13 |
| Niger | 0.11 |
| Indonesia | 0.08 |
| Bhutan | 0.07 |
| Pakistan | 0.04 |
| Yemen | 0.02 |
| Iran | 0.02 |
| Libya | 0.01 |
| Afghanistan | 0.01 |
| Somalia | 0 |
| Saudi Arabia | 0 |
| Mauritania | 0 |
| Kuwait | 0 |
| Bangladesh | 0 |
At the bottom of the consumption charts? Not surprisingly, it’s Bangladesh, Saudi Arabia, Kuwait, and other Muslim countries where intoxication is religiously prohibited.
Regional Disparities in Alcohol Consumption
Per capita consumption of alcohol also highlights clear regional preferences in amount and type, or a lack of interest.
The biggest consumers of alcohol are countries in Central Europe, the South Pacific, and parts of the Caribbean. In Europe, beer and wine are kings, with most of the top consumers also being top producers such as France and Germany.
Spirits like rum, meanwhile, are dominant in the Cook Islands and much of the Caribbean, which has four of the 12 top spirit consumers. The others are mainly in Eastern Europe and Russia, which get most of their alcohol consumption from vodka.
| Top Consuming Country by Alcohol | Type | Consumption/Capita |
|---|---|---|
| Czech Republic | Beer | 6.77L |
| France | Wine | 6.44L |
| Cook Islands | Spirits | 7.07L |
| Tanzania | Others | 6.60L |
The importance of local crops couldn’t be overstated. Regions like Africa and Asia that struggle with the right conditions for grapes or hops saw higher consumption of “other” distilled drinks.
These include rice alcohol in South Korea and Japan, and drinks made from sugarcane, molasses, and even bananas in African countries like Tanzania.
Unlike goods like coffee or tea, alcohol can be produced from many different grains, fruits, or sources of sugar that can be fermented—so it’s natural that regional differences in types, amounts, and even cultural importance would arise.
But as one of the world’s most widely used recreational drugs, it’s played a storied role throughout history that is certain to continue evolving.


Maps
The Largest Earthquakes in the New York Area (1970-2024)
The earthquake that shook buildings across New York in April 2024 was the third-largest quake in the Northeast U.S. over the past 50 years.


The Largest Earthquakes in the New York Area
This was originally posted on our Voronoi app. Download the app for free on Apple or Android and discover incredible data-driven charts from a variety of trusted sources.
The 4.8 magnitude earthquake that shook buildings across New York on Friday, April 5th, 2024 was the third-largest quake in the U.S. Northeast area over the past 50 years.
In this map, we illustrate earthquakes with a magnitude of 4.0 or greater recorded in the Northeastern U.S. since 1970, according to the United States Geological Survey (USGS).
Shallow Quakes and Older Buildings
The earthquake that struck the U.S. Northeast in April 2024 was felt by millions of people from Washington, D.C., to north of Boston. It even caused a full ground stop at Newark Airport.
The quake, occurring just 5 km beneath the Earth’s surface, was considered shallow, which is what contributed to more intense shaking at the surface.
According to the USGS, rocks in the eastern U.S. are significantly older, denser, and harder than those on the western side, compressed by time. This makes them more efficient conduits for seismic energy. Additionally, buildings in the Northeast tend to be older and may not adhere to the latest earthquake codes.
Despite disrupting work and school life, the earthquake was considered minor, according to the Michigan Technological University magnitude scale:
| Magnitude | Earthquake Effects | Estimated Number Each Year |
|---|---|---|
| 2.5 or less | Usually not felt, but can be recorded by seismograph. | Millions |
| 2.5 to 5.4 | Often felt, but only causes minor damage. | 500,000 |
| 5.5 to 6.0 | Slight damage to buildings and other structures. | 350 |
| 6.1 to 6.9 | May cause a lot of damage in very populated areas. | 100 |
| 7.0 to 7.9 | Major earthquake. Serious damage. | 10-15 |
| 8.0 or greater | Great earthquake. Can totally destroy communities near the epicenter. | One every year or two |
The largest earthquake felt in the area over the past 50 years was a 5.3 magnitude quake that occurred in Au Sable Forks, New York, in 2002. It damaged houses and cracked roads in a remote corner of the Adirondack Mountains, but caused no injuries.
| Date | Magnitude | Location | State |
|---|---|---|---|
| April 20, 2002 | 5.3 | Au Sable Forks | New York |
| October 7, 1983 | 5.1 | Newcomb | New York |
| April 5, 2024 | 4.8 | Whitehouse Station | New Jersey |
| October 16, 2012 | 4.7 | Hollis Center | Maine |
| January 16, 1994 | 4.6 | Sinking Spring | Pennsylvania |
| January 19, 1982 | 4.5 | Sanbornton | New Hampshire |
| September 25, 1998 | 4.5 | Adamsville | Pennsylvania |
| June 9, 1975 | 4.2 | Altona | New York |
| May 29, 1983 | 4.2 | Peru | Maine |
| April 23, 1984 | 4.2 | Conestoga | Pennsylvania |
| January 16, 1994 | 4.2 | Sinking Spring | Pennsylvania |
| November 3, 1975 | 4 | Long Lake | New York |
| June 17, 1991 | 4 | Worcester | New York |
The largest earthquake in U.S. history, however, was the 1964 Good Friday quake in Alaska, measuring 9.2 magnitude and killing 131 people.

-

 Business2 weeks ago
America’s Top Companies by Revenue (1994 vs. 2023)
-

 Environment1 week ago
Ranked: Top Countries by Total Forest Loss Since 2001
-

 Markets1 week ago
Visualizing America’s Shortage of Affordable Homes
-

 Maps2 weeks ago
Mapped: Average Wages Across Europe
-

 Mining2 weeks ago
Charted: The Value Gap Between the Gold Price and Gold Miners
-

 Demographics2 weeks ago
Visualizing the Size of the Global Senior Population
-

 Misc2 weeks ago
Tesla Is Once Again the World’s Best-Selling EV Company
-

 Technology2 weeks ago
Ranked: The Most Popular Smartphone Brands in the U.S.