Datastream
U.S. Military Spending vs Other Top Countries


The Briefing
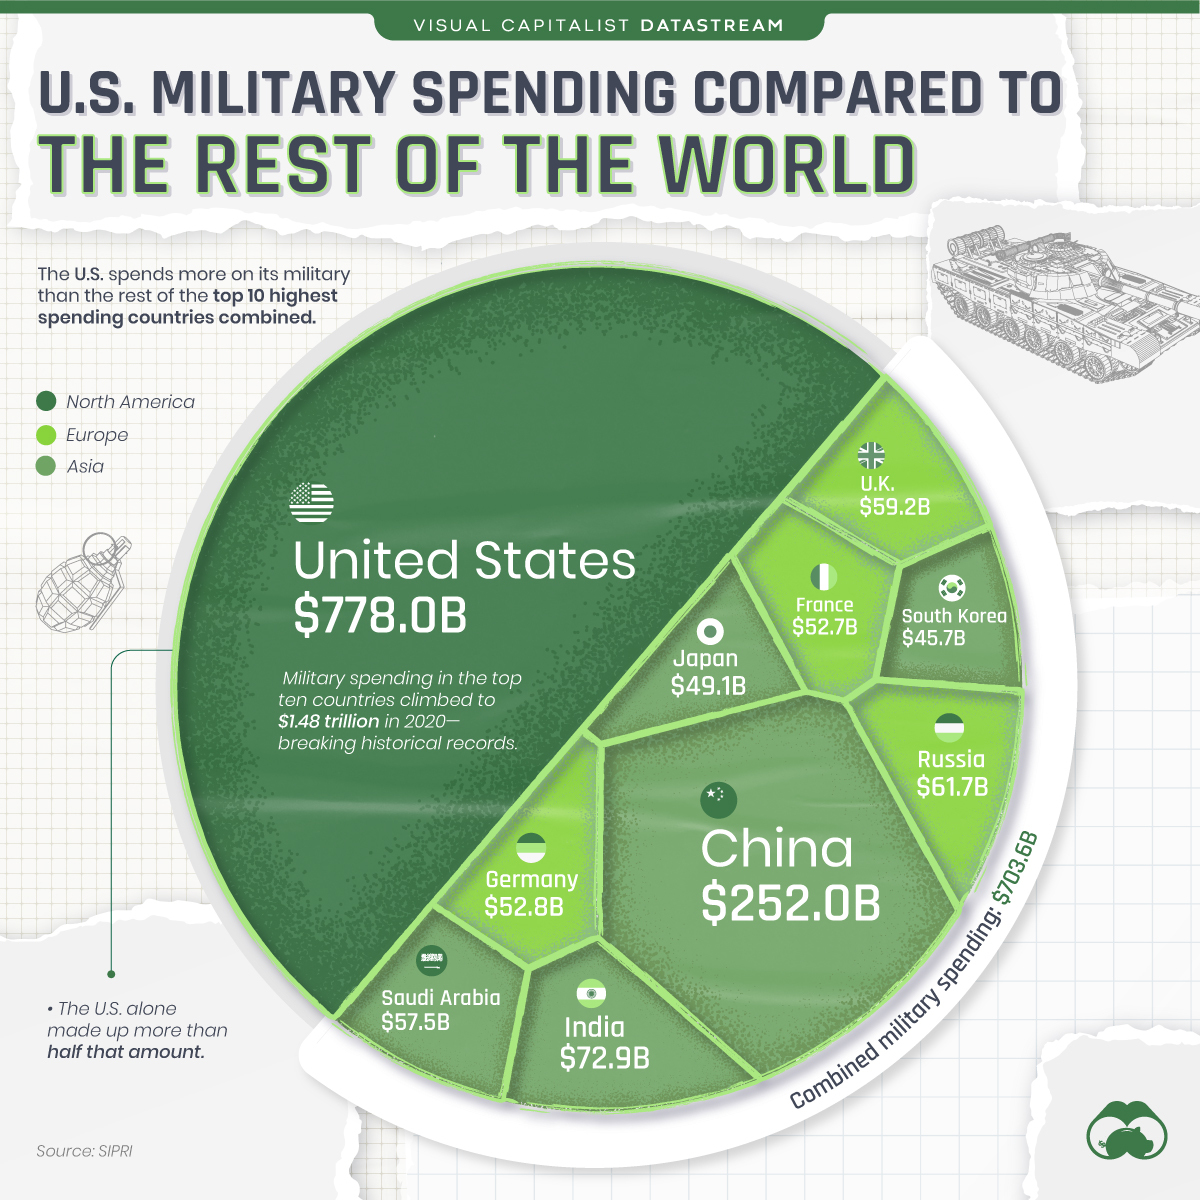
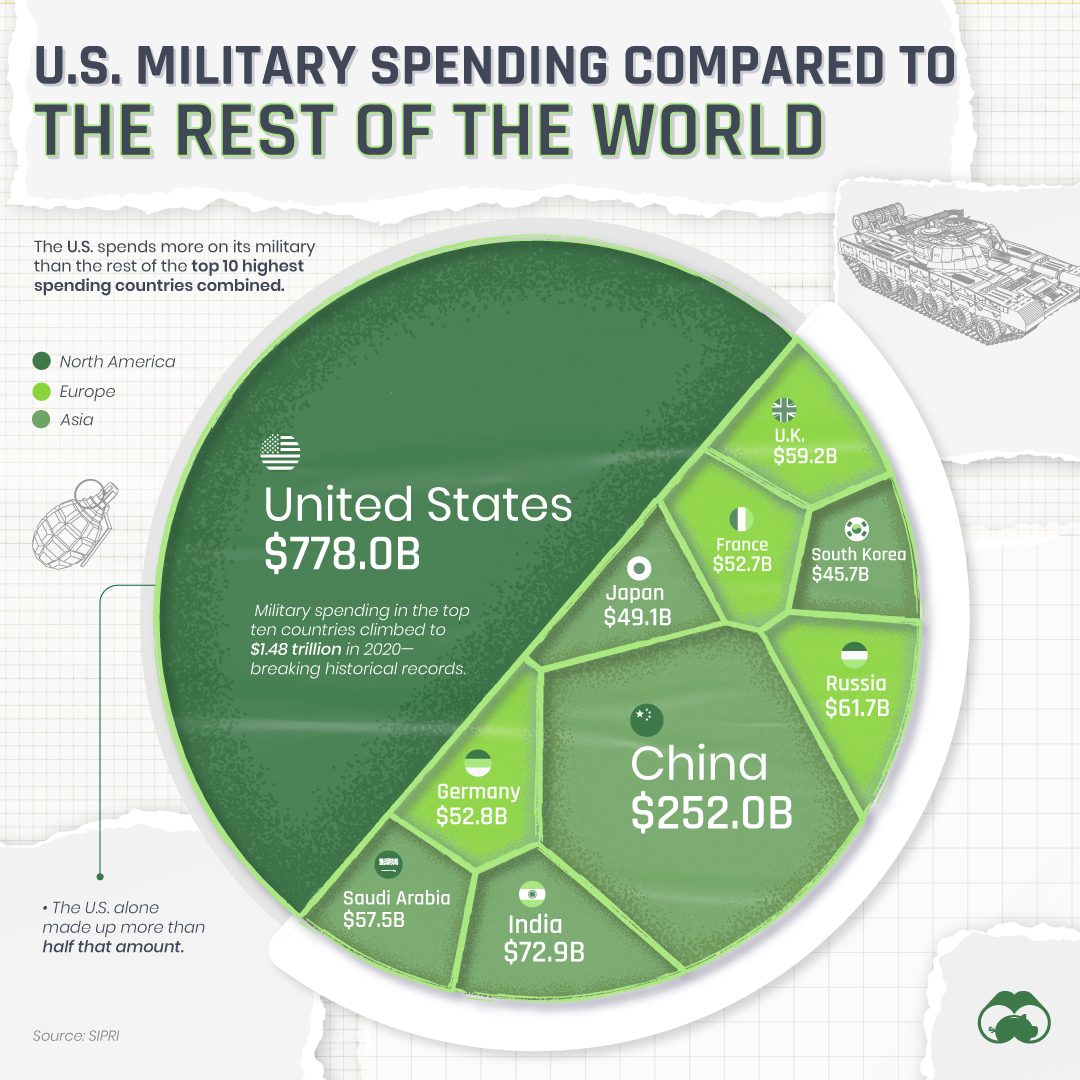
- U.S. military spending surpassed $778 billion in 2020.
- The U.S. spends more on its military than the next nine highest spending countries combined.
U.S. Military Spending vs Other Top Countries
The U.S. is well known for its immense military and defense spending. In 2020, the nation ranked #1 in the world in terms of military spending at $778 billion outpacing the next nine highest spenders, which came out to $703.6 billion combined.
One factor is the military–industrial complex (MIC) which feeds into the U.S.’ defense dominance, with a longstanding tradition of the defense and weapons industries working closely with the U.S. government and armed forces.
A Breakdown of U.S. Military Spending
So what are these billions being spent on?
The U.S. Department of Defense (DoD) laid out the spending plan when they made their 2020 budget proposal. It included a few main areas to invest in, including:
- Air – $57.7 billion
- Maritime – $34.7 billion
- Ground systems – $14.6 billion
- Space – $14.1 billion
- Cyber – $6.9 billion
This is just the tip of the iceberg. The overall goal of the 2020 budget was to promote innovation and to strengthen competitive advantages to increase the military’s ‘readiness’ factor. Additionally, in an effort to sustain forces, a military pay raise of 3.1% was included.
Military Maintenance
Surprisingly, however, the U.S. actually does not have the largest military in the world in terms of personnel, and some of the other top 10 countries have larger or similarly sized militaries spread across different branches.
| Country | Active Military | Reserve Military | Paramilitary | Total Military |
|---|---|---|---|---|
| 🇷🇺 Russia | 1,013,628 | 2,572,500 | 2,310,859 | 5,896,987 |
| 🇺🇸 United States | 1,374,699 | 845,000 | 2,918,161 | 5,137,860 |
| 🇮🇳 India | 1,440,000 | 2,096,000 | 1,585,950 | 5,121,950 |
| 🇰🇷 South Korea | 599,000 | 3,100,000 | 900,000 | 4,599,000 |
| 🇨🇳 China | 2,035,000 | 510,000 | 1,500,000 | 4,045,000 |
| 🇫🇷 France | 202,700 | 72,300 | 103,400 | 378,400 |
| 🇯🇵 Japan | 247,150 | 56,000 | 13,740 | 316,890 |
| 🇸🇦 Saudi Arabia | 227,000 | 0 | 24,500 | 251,500 |
| 🇬🇧 United Kingdom | 150,250 | 82,650 | 0 | 232,900 |
| 🇩🇪 Germany | 178,600 | 27,900 | 500 | 207,000 |
Russia is only the fourth highest spender, but they have the largest military size of any of the top 10, at around 5.9 million personnel.
All of these countries have militaries that number in the hundreds of thousands to millions, and many are a part of treaties and alliances that require them to upkeep their armies and weaponry — but none spend half as much as the U.S.
To this day, the U.S. is actively involved in a number of overseas conflicts and maintains a large military force with millions of personnel. Spending on areas such as weaponry and wages is significant in order to maintain jobs, as well as national defense.
Where does this data come from?
Source: SIPRI.


Datastream
Can You Calculate Your Daily Carbon Footprint?
Discover how the average person’s carbon footprint impacts the environment and learn how carbon credits can offset your carbon footprint.


The Briefing
- A person’s carbon footprint is substantial, with activities such as food consumption creating as much as 4,500 g of CO₂ emissions daily.
- By purchasing carbon credits from Carbon Streaming Corporation, you can offset your own emissions and fund positive climate action.
Your Everyday Carbon Footprint
While many large businesses and countries have committed to net-zero goals, it is essential to acknowledge that your everyday activities also contribute to global emissions.
In this graphic, sponsored by Carbon Streaming Corporation, we will explore how the choices we make and the products we use have a profound impact on our carbon footprint.
Carbon Emissions by Activity
Here are some of the daily activities and products of the average person and their carbon footprint, according to Clever Carbon.
| Household Activities & Products | CO2 Emissions (g) |
|---|---|
| 💡 Standard Light Bulb (100 watts, four hours) | 172 g |
| 📱 Mobile Phone Use (195 minutes per day)* | 189 g |
| 👕 Washing Machine (0.63 kWh) | 275 g |
| 🔥 Electric Oven (1.56 kWh) | 675 g |
| ♨️ Tumble Dryer (2.5 kWh) | 1,000 g |
| 🧻 Toilet Roll (2 ply) | 1,300 g |
| 🚿 Hot Shower (10 mins) | 2,000 g |
| 🚙 Daily Commute (one hour, by car) | 3,360 g |
| 🍽️ Average Daily Food Consumption (three meals of 600 calories) | 4,500 g |
| *Phone use based on yearly use of 69kg per the source, Reboxed | |
Your choice of transportation plays a crucial role in determining your carbon footprint. For instance, a 15 km daily commute to work on public transport generates an average of 1,464 g of CO₂ emissions. Compared to 3,360 g—twice the volume for a journey the same length by car.
By opting for more sustainable modes of transport, such as cycling, walking, or public transportation, you can significantly reduce your carbon footprint.
Addressing Your Carbon Footprint
One way to compensate for your emissions is by purchasing high-quality carbon credits.
Carbon credits are used to help fund projects that avoid, reduce or remove CO₂ emissions. This includes nature-based solutions such as reforestation and improved forest management, or technology-based solutions such as the production of biochar and carbon capture and storage (CCS).
While carbon credits offer a potential solution for individuals to help reduce global emissions, public awareness remains a significant challenge. A BCG-Patch survey revealed that only 34% of U.S. consumers are familiar with carbon credits, and only 3% have purchased them in the past.
About Carbon Streaming
By financing the creation or expansion of carbon projects, Carbon Streaming Corporation secures the rights to future carbon credits generated by these sustainable projects. You can then purchase these carbon credits to help fund climate solutions around the world and compensate for your own emissions.
Ready to get involved?
>> Learn more about purchasing carbon credits at Carbon Streaming

-

 Markets1 week ago
Ranked: The Largest U.S. Corporations by Number of Employees
-

 Green3 weeks ago
Ranked: Top Countries by Total Forest Loss Since 2001
-

 Money2 weeks ago
Where Does One U.S. Tax Dollar Go?
-

 Automotive2 weeks ago
Almost Every EV Stock is Down After Q1 2024
-

 AI2 weeks ago
The Stock Performance of U.S. Chipmakers So Far in 2024
-

 Markets2 weeks ago
Charted: Big Four Market Share by S&P 500 Audits
-

 Real Estate2 weeks ago
Ranked: The Most Valuable Housing Markets in America
-

 Money2 weeks ago
Which States Have the Highest Minimum Wage in America?