Maps
1 Billion Years of Tectonic Plate Movement in 40 Seconds
1 Billion Years of Tectonic Plate Movement in 40 Seconds
According to plate tectonic theory, the Earth’s surface is made up of slabs of rock that are slowly shifting right under our feet.
Because of this constant movement, today’s Earth looks a lot different from what it did millions of years ago. Today’s animation looks at the Earth’s tectonic plate movement from 1 ga (geological time for 1 billion years ago) to the present-day, via EarthByte on YouTube.
Editor’s note: The video starts at time 1,000 ma (1,000 million years ago), and ticks down at the rate of about 25 million years every second.
The Emergence of Plate Tectonic Theory
Plate tectonics is a relatively new theory—in fact, according to National Geographic, it hadn’t become popular until the 1960s. However, the concept of continental movement was brewing long before it became widely accepted.
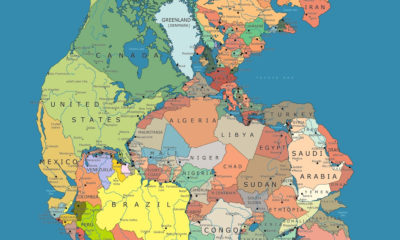
In 1912, German scientist Alfred Wegener proposed a theory he called continental drift. According to Wegener’s theory, Earth’s continents once formed a single, giant landmass, which he called Pangaea.
Over millions of years, Pangaea slowly broke apart, eventually forming the continents as they are today. Wegener believed this continental drift explained why the borders of South America and Africa looked like matching puzzle pieces. He also pointed to similar rock formations and fossils on these two continents as proof to back his theory.
Initially, the scientific community wasn’t on board with the theory of continental drift. But as more data emerged over the years, including research on seafloor spreading, the theory started to gain traction.
The Supercontinent Cycle
Nowadays, it’s believed that Pangea was just one of several supercontinents to mass together (and break apart) over the course of geological history.
The exact number of supercontinents is largely debated, but according to the Encylopedia of Geology, here are five (including Pangea) that are widely recognized:
- Kenorland: 2.7-2.5 billion years ago
- Nuna/Columbia: 1.6-1.4 billion years ago
- Rodinia: 950–800 million years ago
- Pannotia: 620-580 million years ago
- Pangea: 325-175 million years ago
According to the theory, this cycle of breaking apart and coming together happens because of subduction, which occurs when tectonic plates converge with one another.
The supercontinent cycle also ties into ocean formation. The below example of the Wilson Cycle specifically keys in on how the Atlantic Ocean, and its predecessor, the Iapetus Ocean, were formed as supercontinents drifted apart:
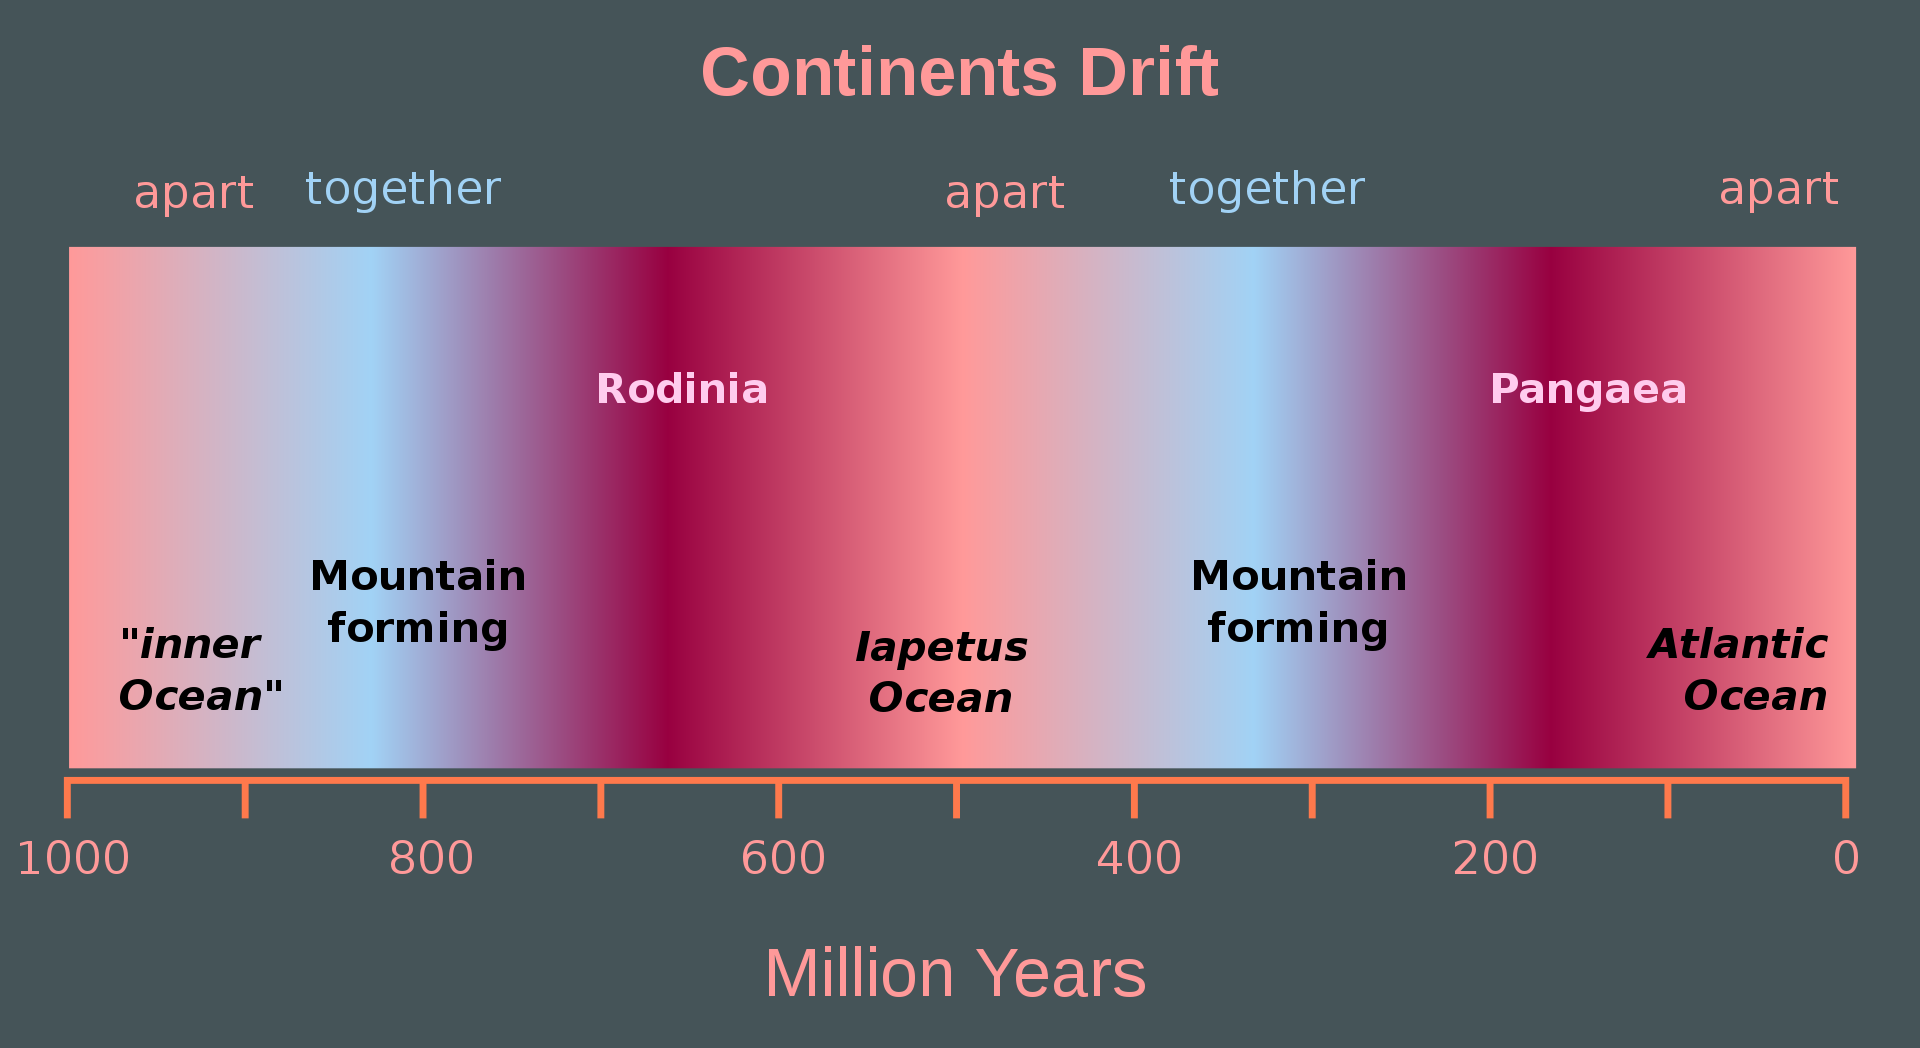
Source: Hannes Grobe
The Importance of Plate Tectonics
Plate tectonics has been a game-changer for geologists. The theory has helped to explain tons of unanswered geological questions, assisting scientists in understanding how volcanoes, mountains, and ocean ridges are formed.
It’s also valuable for the oil and gas industry since it explains how sedimentary basins were created, allowing geologists and engineers to target and locate vast oil reserves.
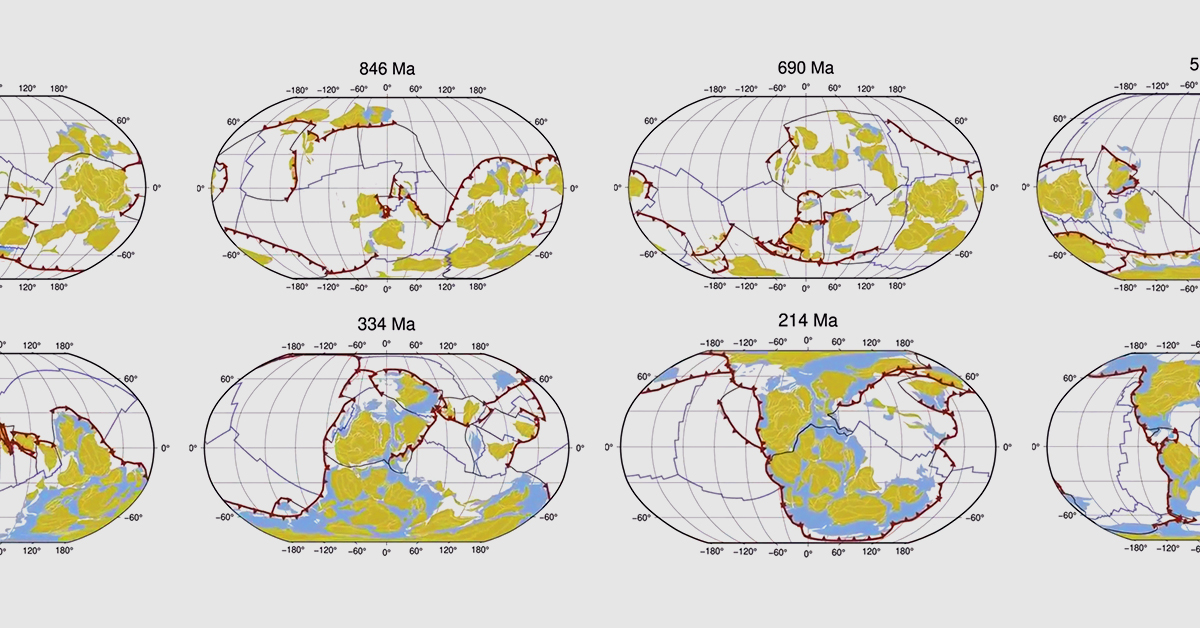
Since the theory of plate tectonics is relatively new, there’s still a lot to be discovered in this field of research. However, in March 2021, a report was published in Earth-Science Reviews that, for the first time, visualized a continuous plate model that shows how Earth’s plates have shifted over the last billion years.
The video above visualizes this particular report and accurately depicts the Earth’s tectonic plates’ movement or the observed shift in Earth’s tectonic plates over the years.


Maps
The Largest Earthquakes in the New York Area (1970-2024)
The earthquake that shook buildings across New York in April 2024 was the third-largest quake in the Northeast U.S. over the past 50 years.


The Largest Earthquakes in the New York Area
This was originally posted on our Voronoi app. Download the app for free on Apple or Android and discover incredible data-driven charts from a variety of trusted sources.
The 4.8 magnitude earthquake that shook buildings across New York on Friday, April 5th, 2024 was the third-largest quake in the U.S. Northeast area over the past 50 years.
In this map, we illustrate earthquakes with a magnitude of 4.0 or greater recorded in the Northeastern U.S. since 1970, according to the United States Geological Survey (USGS).
Shallow Quakes and Older Buildings
The earthquake that struck the U.S. Northeast in April 2024 was felt by millions of people from Washington, D.C., to north of Boston. It even caused a full ground stop at Newark Airport.
The quake, occurring just 5 km beneath the Earth’s surface, was considered shallow, which is what contributed to more intense shaking at the surface.
According to the USGS, rocks in the eastern U.S. are significantly older, denser, and harder than those on the western side, compressed by time. This makes them more efficient conduits for seismic energy. Additionally, buildings in the Northeast tend to be older and may not adhere to the latest earthquake codes.
Despite disrupting work and school life, the earthquake was considered minor, according to the Michigan Technological University magnitude scale:
| Magnitude | Earthquake Effects | Estimated Number Each Year |
|---|---|---|
| 2.5 or less | Usually not felt, but can be recorded by seismograph. | Millions |
| 2.5 to 5.4 | Often felt, but only causes minor damage. | 500,000 |
| 5.5 to 6.0 | Slight damage to buildings and other structures. | 350 |
| 6.1 to 6.9 | May cause a lot of damage in very populated areas. | 100 |
| 7.0 to 7.9 | Major earthquake. Serious damage. | 10-15 |
| 8.0 or greater | Great earthquake. Can totally destroy communities near the epicenter. | One every year or two |
The largest earthquake felt in the area over the past 50 years was a 5.3 magnitude quake that occurred in Au Sable Forks, New York, in 2002. It damaged houses and cracked roads in a remote corner of the Adirondack Mountains, but caused no injuries.
| Date | Magnitude | Location | State |
|---|---|---|---|
| April 20, 2002 | 5.3 | Au Sable Forks | New York |
| October 7, 1983 | 5.1 | Newcomb | New York |
| April 5, 2024 | 4.8 | Whitehouse Station | New Jersey |
| October 16, 2012 | 4.7 | Hollis Center | Maine |
| January 16, 1994 | 4.6 | Sinking Spring | Pennsylvania |
| January 19, 1982 | 4.5 | Sanbornton | New Hampshire |
| September 25, 1998 | 4.5 | Adamsville | Pennsylvania |
| June 9, 1975 | 4.2 | Altona | New York |
| May 29, 1983 | 4.2 | Peru | Maine |
| April 23, 1984 | 4.2 | Conestoga | Pennsylvania |
| January 16, 1994 | 4.2 | Sinking Spring | Pennsylvania |
| November 3, 1975 | 4 | Long Lake | New York |
| June 17, 1991 | 4 | Worcester | New York |
The largest earthquake in U.S. history, however, was the 1964 Good Friday quake in Alaska, measuring 9.2 magnitude and killing 131 people.

-

 Green1 week ago
Ranked: The Countries With the Most Air Pollution in 2023
-

 Automotive2 weeks ago
Almost Every EV Stock is Down After Q1 2024
-

 AI2 weeks ago
The Stock Performance of U.S. Chipmakers So Far in 2024
-

 Markets2 weeks ago
Charted: Big Four Market Share by S&P 500 Audits
-

 Real Estate2 weeks ago
Ranked: The Most Valuable Housing Markets in America
-

 Money2 weeks ago
Which States Have the Highest Minimum Wage in America?
-

 AI2 weeks ago
Ranked: Semiconductor Companies by Industry Revenue Share
-

 Travel2 weeks ago
Ranked: The World’s Top Flight Routes, by Revenue