Commodities
Which Countries Produce the Most Wheat?
Article/Editing:
Visualizing Global Wheat Production by Country (2000-2020)
Wheat is a dietary staple for millions of people around the world.
After rice and corn (maize), wheat is the third most-produced cereal worldwide, and the second-most-produced for human consumption. And considering wheat’s importance in the global food system, any impact on major producers such as droughts, wars, or other events, can impact the entire world.
Which countries are the largest producers of wheat? This graphic by Kashish Rastogi visualizes the breakdown of 20 years of global wheat production by country.
Top 10 Wheat Producing Countries
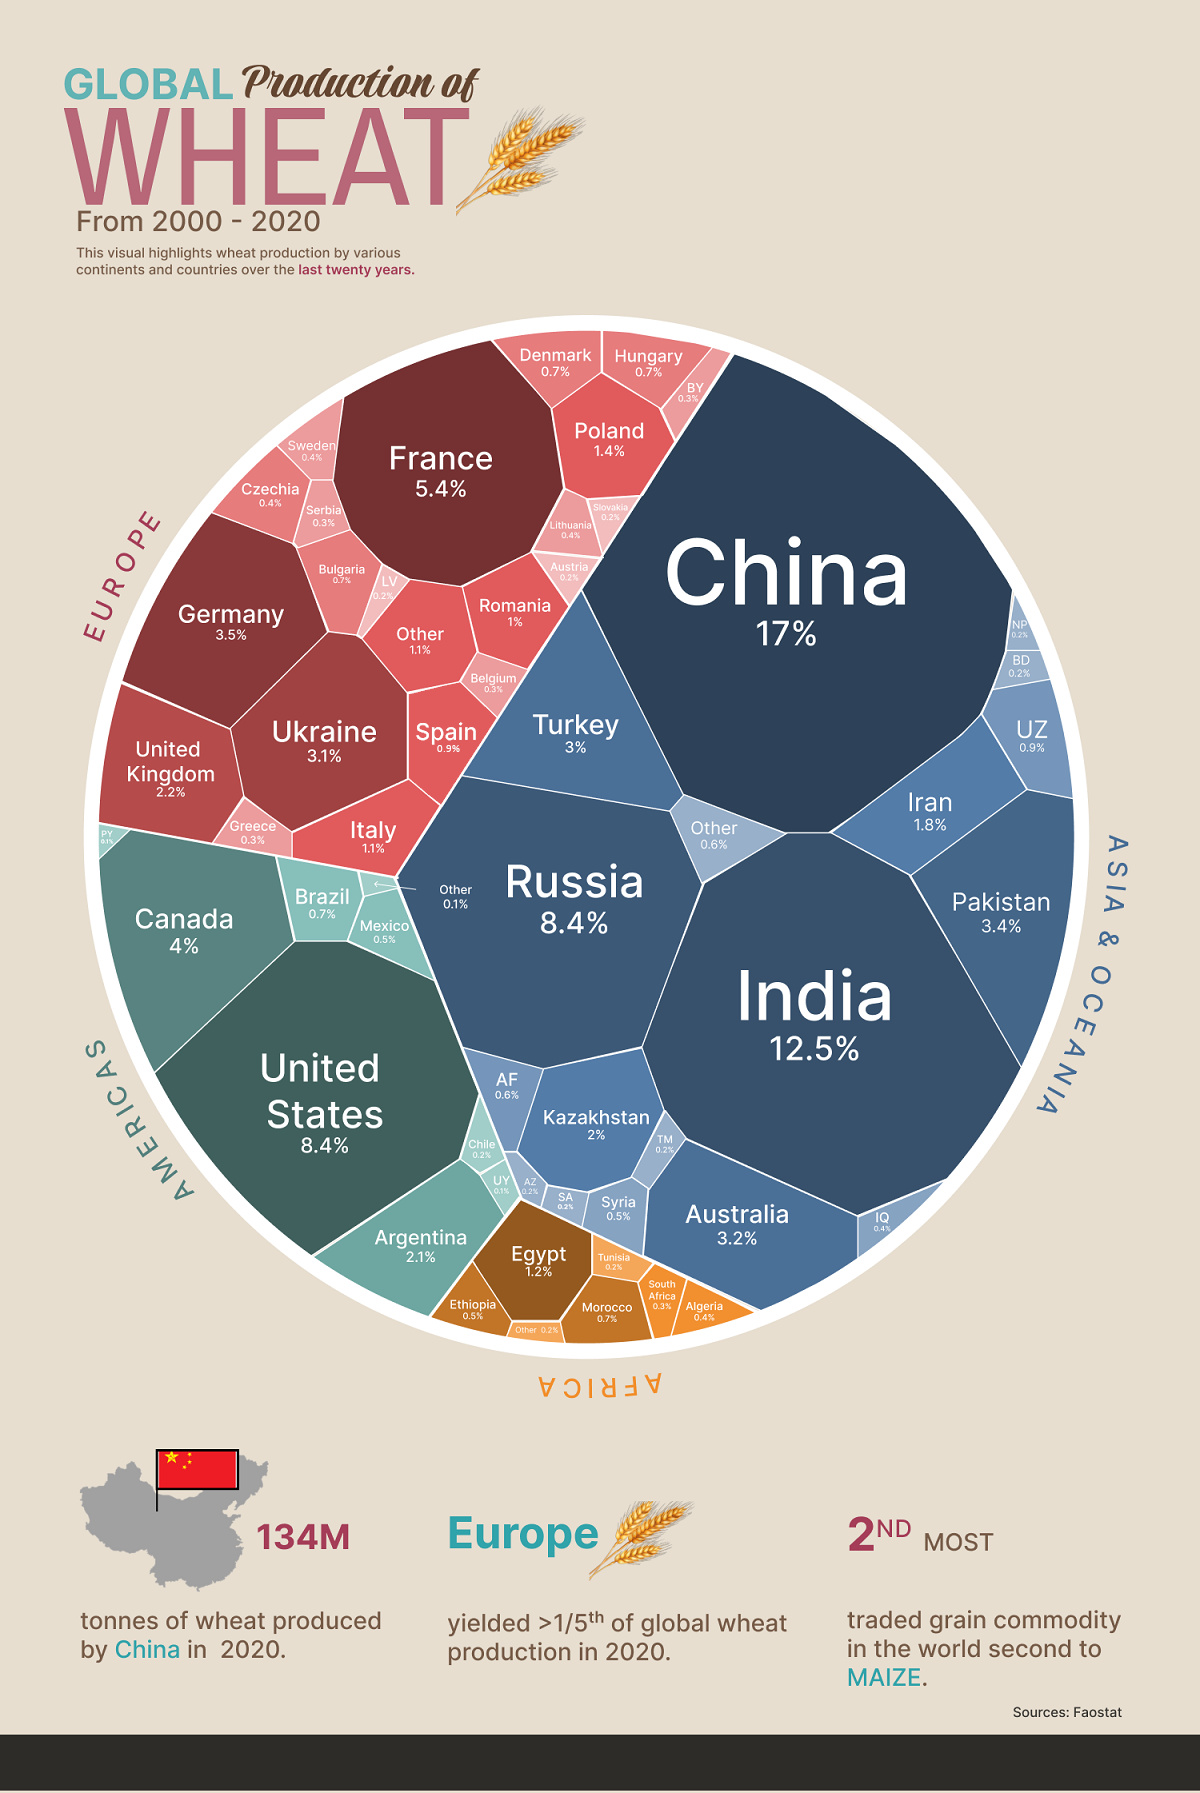
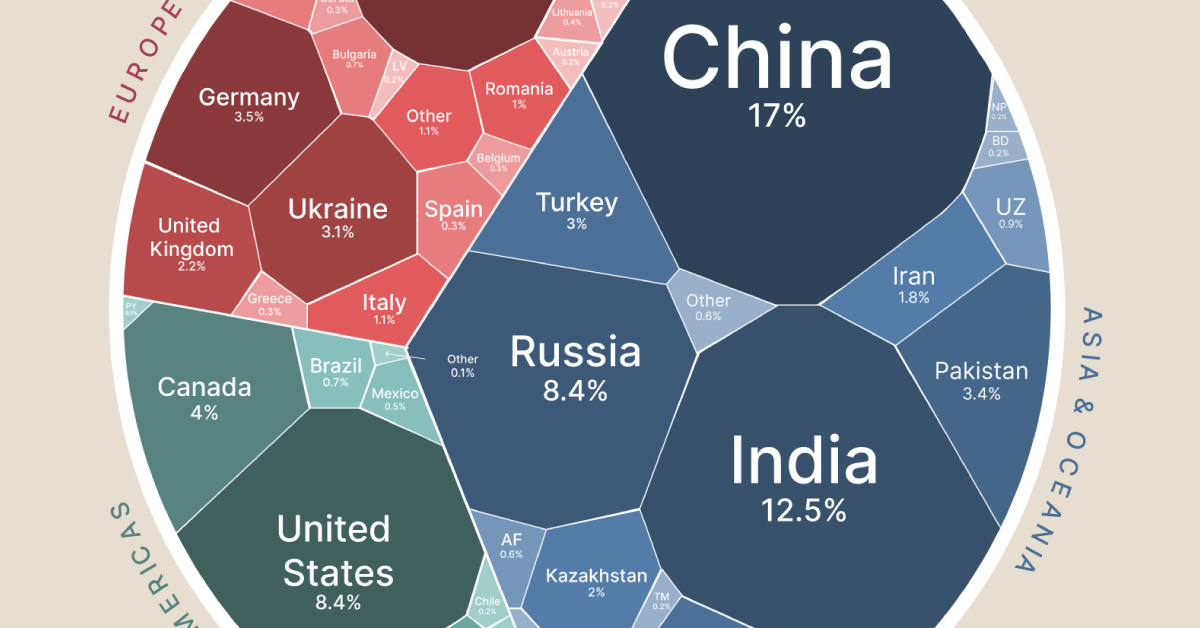
While more than 80 different countries produce wheat around the world, the majority of global wheat production comes from just a handful of countries, according to data from The Food and Agriculture Organization of the United Nations (FAO).
Here’s a look at the top 10 wheat-producing countries worldwide, based on total yield in tonnes from 2000-2020:
| Rank | Country | Continent | Total yield (tonnes, 2000-2020) | % of total (2000-2020) |
|---|---|---|---|---|
| #1 | 🇨🇳 China | Asia & Oceania | 2.4 B | 17.0% |
| #2 | 🇮🇳 India | Asia & Oceania | 1.8 B | 12.5% |
| #3 | 🇷🇺 Russia | Asia & Oceania | 1.2 B | 8.4% |
| #4 | 🇺🇸 U.S. | Americas | 1.2 B | 8.4% |
| #5 | 🇫🇷 France | Europe | 767 M | 5.4% |
| #6 | 🇨🇦 Canada | Americas | 571 M | 4.0% |
| #7 | 🇩🇪 Germany | Europe | 491 M | 3.5% |
| #8 | 🇵🇰 Pakistan | Asia & Oceania | 482 M | 3.4% |
| #9 | 🇦🇺 Australia | Asia & Oceania | 456 M | 3.2% |
| #10 | 🇺🇦 Ukraine | Europe | 433 M | 3.1% |
China, the world’s largest wheat producer, has yielded more than 2.4 billion tonnes of wheat over the last two decades, making up roughly 17% of total production from 2000-2020.
A majority of China’s wheat is used domestically to help meet the country’s rising food demand. China is the world’s largest consumer of wheat—in 2020/2021, the country accounted for approximately 19% of global wheat consumption.
The second-largest wheat-producing country is India. Over the last two decades, India has produced 12.5% of the world’s wheat. Like China, India keeps most of its wheat domestic because of significant food demand across the country.
Russia, the world’s third-largest wheat producer, is also the largest global exporter of wheat. The country exported more than $7.3 billion worth of wheat in 2021, accounting for approximately 13.1% of total wheat exports that year.
Russia-Ukraine Impact on Global Wheat Market
Because Russia and Ukraine are both significant global wheat producers, the ongoing conflict between the two countries has caused massive disruptions to the global wheat market.
The conflict has had an impact on adjacent industries as well. For instance, Russia is one of the world’s major fertilizer suppliers, and the conflict has led to a global fertilizer shortage which could lead to food shortages worldwide.

This article was published as a part of Visual Capitalist's Creator Program, which features data-driven visuals from some of our favorite Creators around the world.


Markets
Panama Canal Traffic by Shipment Category and Tonnage
This graphic illustrates Panama Canal traffic by shipment category, looking at the total number of shipping crossings and the total tonnage.
Panama Canal Traffic by Shipment Category and Tonnage
This was originally posted on our Voronoi app. Download the app for free on iOS or Android and discover incredible data-driven charts from a variety of trusted sources.
Daily Panama Canal traffic has been steadily restricted to start the year, with an expected peak reduction of over 40% by February 2024 due to severe drought. The problem is already affecting supply chains for U.S. and Asian importers.
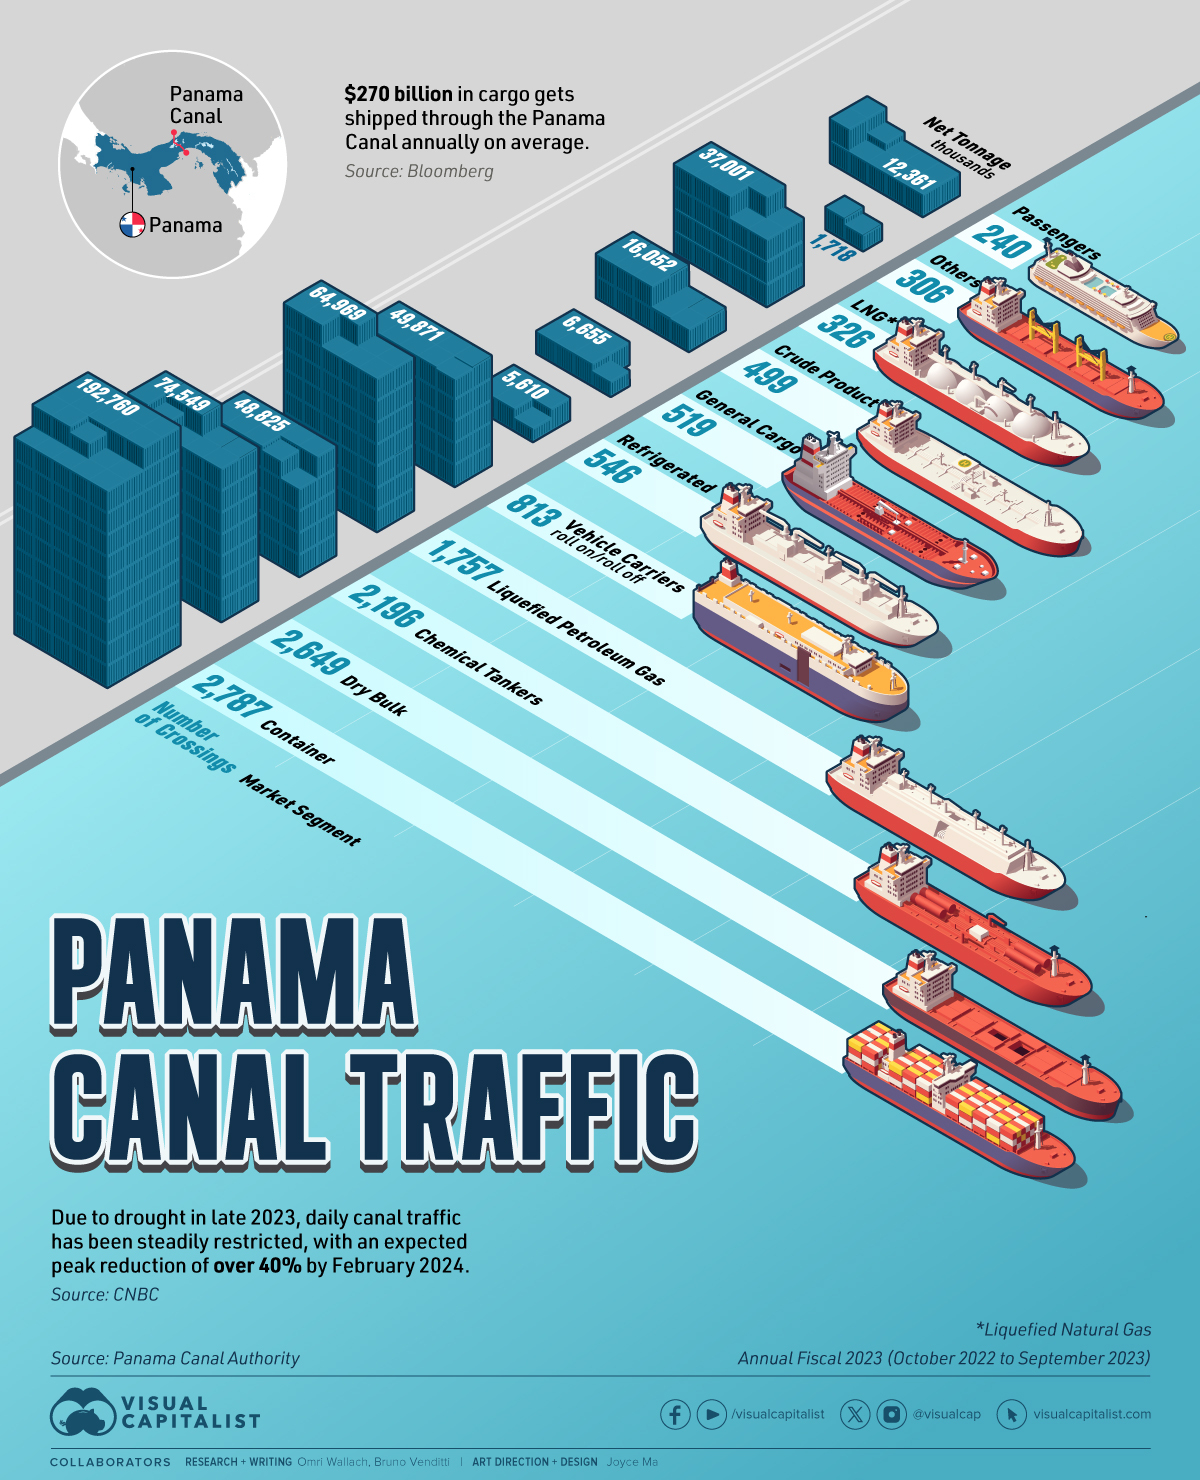
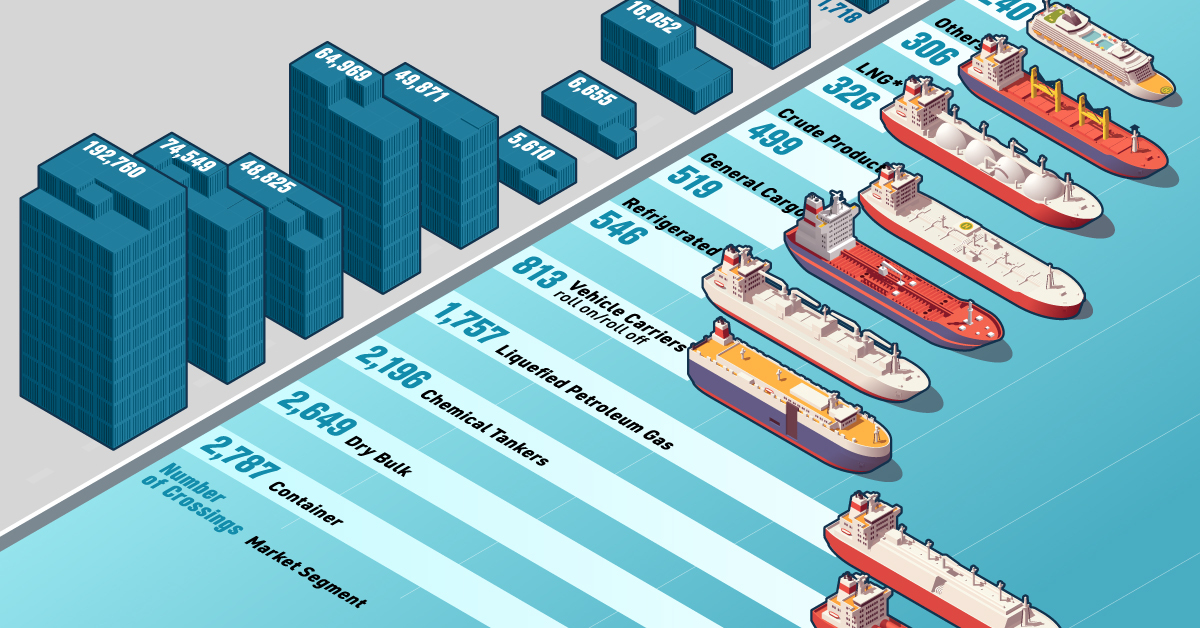
This graphic illustrates the number of shipping crossings by market segment at the Canal and the net tonnage carried during the Annual Fiscal 2023 (October 2022 to September 2023). Data is from the Panama Canal Authority.
About the Panama Canal
The Panama Canal is an artificial 82-kilometer (51-mile) waterway that connects the Pacific Ocean with the Atlantic Ocean, built between 1904 and 1914.
The Canal locks at each end lift ships to Gatun Lake, an artificial freshwater lake 26 meters (85 ft) above sea level. The shortcut dramatically reduces the time for ships to travel between the two oceans, enabling them to avoid the route around the southernmost tip of South America via the Drake Passage or Strait of Magellan.
The Panama Canal moves roughly $270 billion worth of cargo annually–it’s the trade route taken by 40% of all U.S. container traffic alone and handles about 5% of all global maritime trade.
The Driest October in 70 Years
Last October, however, Panama received 41% less rainfall than usual, leading to the driest October in 70 years in what was supposed to be Panama’s rainy season, bringing the level of the Gatun Lake almost six feet below where it was a year ago. Additionally, infrastructure constraints led the Panama Canal Authority to restrict the number of ships that could pass each day.
The principal commodity groups carried through the Canal are motor vehicles, petroleum products, grains, coal, and coke.
| Market Segment | Transits (#) | Net Tonnage (thousands) |
|---|---|---|
| Container | 2,787 | 192,760 |
| Dy Bulk | 2,649 | 74,549 |
| Chemical Tankers | 2,196 | 48,825 |
| Liquefied Petroleum Gas | 1,757 | 64,969 |
| Vehicle Carriers | 813 | 49,871 |
| Refrigerated | 546 | 5,610 |
| General Cargo | 519 | 6,655 |
| Crude Product Tankers | 499 | 16,052 |
| Liquefied Natural Gas | 326 | 37,001 |
| Other | 306 | 1,718 |
| Passengers | 240 | 12,361 |
| Total | 12,638 | 510,370 |
According to the Panama Canal Authority, most of its traffic came from containers and dry bulk like soybeans. The world’s largest operator of chemical tankers (Stolt-Nielsen) typically also uses the Canal. However, due to the drought and the backup at the crossing, the operator has decided to reroute its fleet to the Suez Canal.
Although representing the smaller number of crossings, the Canal is also an important route for passengers, with many ocean cruise lines offering popular Panama Canal itineraries that sail through the Canal in the approximately 8-hour passage to their next destination in the opposite ocean.

-

 Maps2 weeks ago
Mapped: Average Wages Across Europe
-

 Money1 week ago
Which States Have the Highest Minimum Wage in America?
-

 Real Estate1 week ago
Ranked: The Most Valuable Housing Markets in America
-

 Markets1 week ago
Charted: Big Four Market Share by S&P 500 Audits
-

 AI1 week ago
The Stock Performance of U.S. Chipmakers So Far in 2024
-

 Automotive2 weeks ago
Almost Every EV Stock is Down After Q1 2024
-

 Money2 weeks ago
Where Does One U.S. Tax Dollar Go?
-

 Green2 weeks ago
Ranked: Top Countries by Total Forest Loss Since 2001