Money
Mapped: A Snapshot of Wealth in Africa


Mapped: A Snapshot of Wealth in Africa
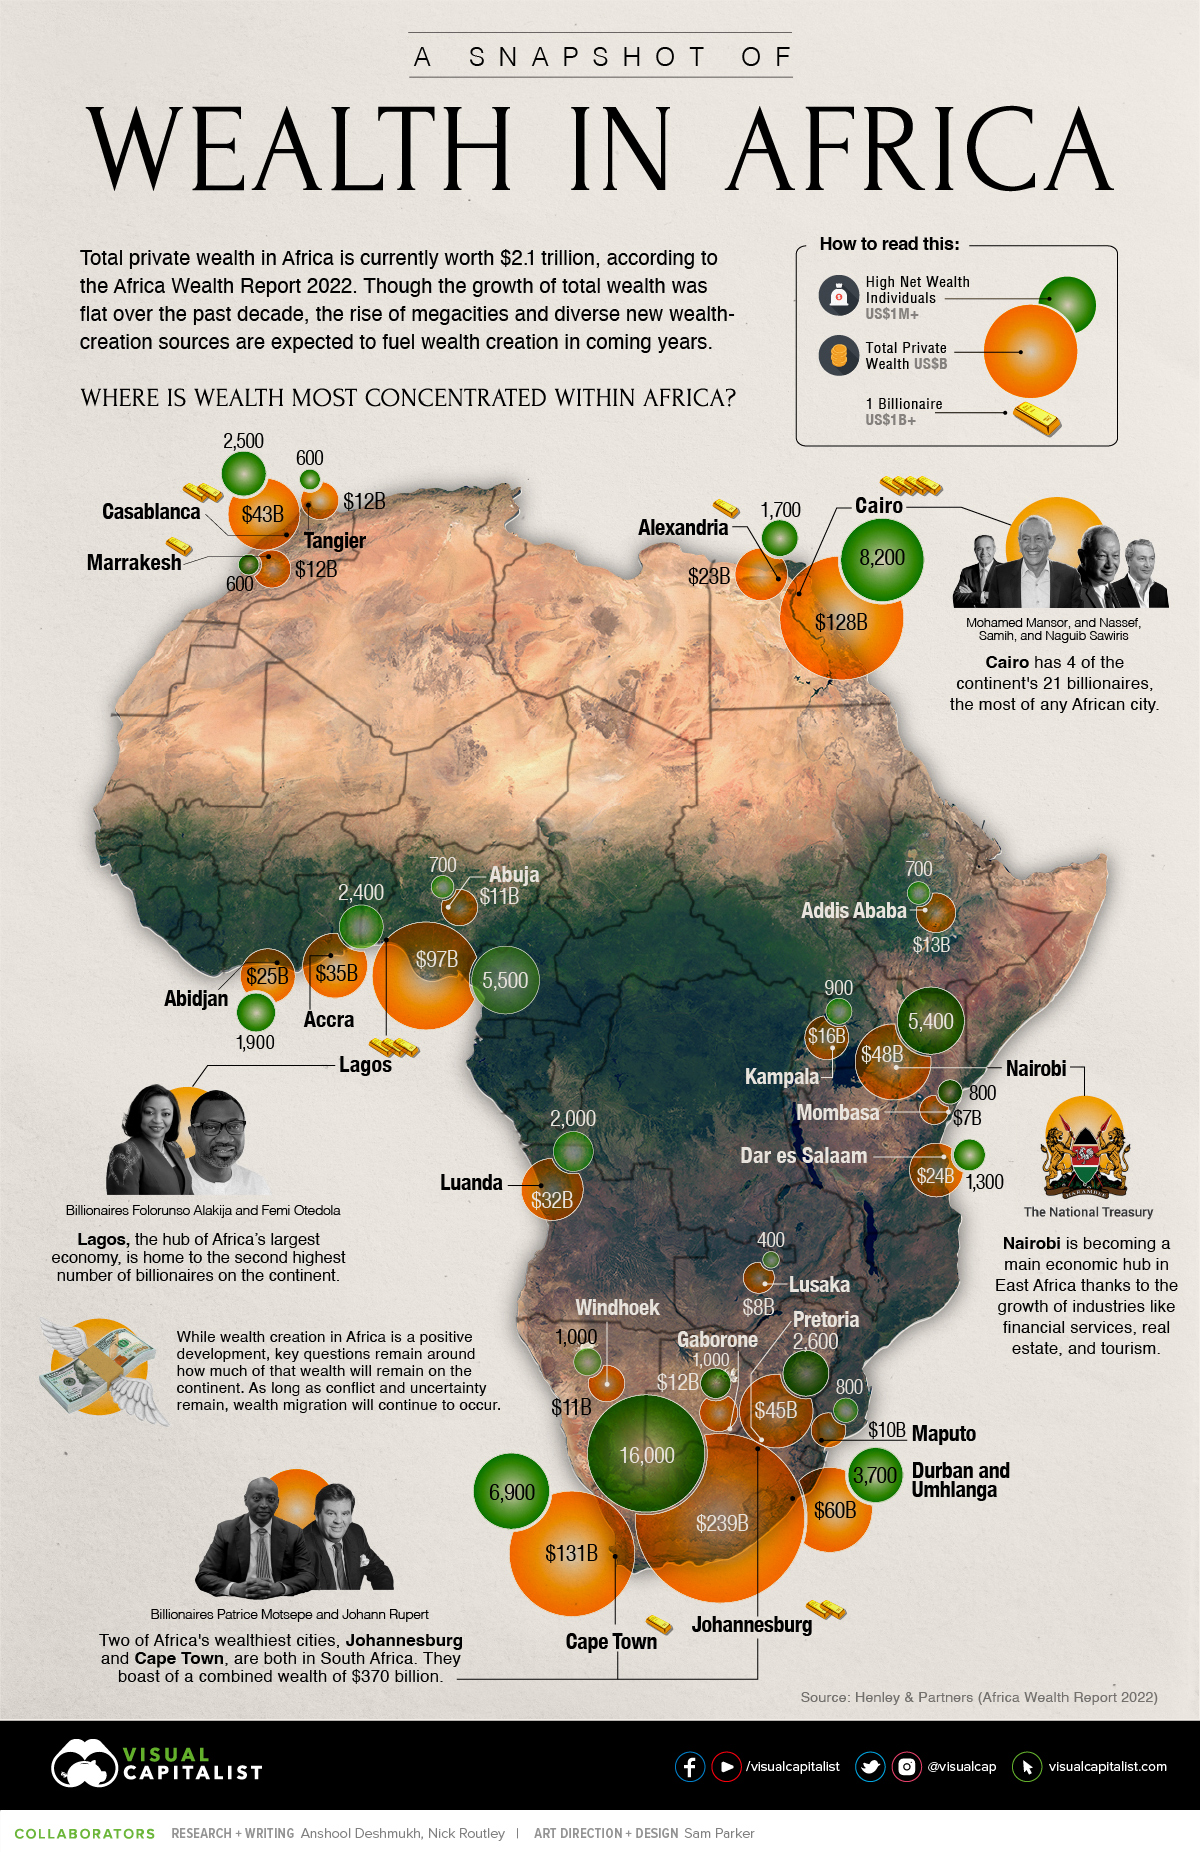
The continent of Africa contains more than 50 countries, but just five account for more than half of total wealth on the continent: South Africa, Egypt, Nigeria, Morocco, and Kenya.
Despite recent setbacks in Africa’s largest economies, wealth creation has been strong in a number of areas, and total private wealth is now estimated to be US$2.1 trillion. There also an estimated 21 billionaires in Africa today.
Drawing from the latest Africa Wealth Report, here’s a look at where all that wealth is concentrated around the continent.
A Country-Level Look at Wealth in Africa
South Africa is a still a major stronghold of wealth in Africa, with a robust luxury real estate market and ample wealth management services. The country is also ranked second on the continent in per capita wealth. That said, the country has faced challenges in recent years.
An estimated 4,500 high net worth individuals (wealth of US$1 million or more) have left South Africa over the past decade, migrating to places like the UK, Australia, and the United States. In one stark data point, the report points out that “there are 15 South African born billionaires in the world, but only 5 of them still live in South Africa.”
Here is how major African countries compare in terms of per capita wealth.
| Rank | Country | Wealth per Capita (US$) |
|---|---|---|
| #1 | 🇲🇺 Mauritius | $34,000 |
| #2 | 🇿🇦 South Africa | $10,970 |
| #3 | 🇳🇦 Namibia | $9,320 |
| #4 | 🇧🇼 Botswana | $7,880 |
| #5 | 🇲🇦 Morocco | $3,380 |
| #6 | 🇪🇬 Egypt | $3,000 |
| #7 | 🇬🇭 Ghana | $1,890 |
| #8 | 🇰🇪 Kenya | $1,700 |
| #9 | 🇦🇴 Angola | $1,620 |
| #10 | 🇨🇮 Côte d'Ivoire | $1,610 |
| #11 | 🇳🇬 Nigeria | $1,100 |
| #12 | 🇹🇿 Tanzania | $940 |
| #13 | 🇷🇼 Rwanda | $850 |
| #14 | 🇺🇬 Uganda | $820 |
| #15 | 🇿🇲 Zambia | $760 |
| #16 | 🇲🇿 Mozambique | $650 |
| #17 | 🇪🇹 Ethiopia | $540 |
Mauritius is Africa’s wealthiest nation on a per capita basis. Here are a few reasons why the island nation comes out on top:
- HNWI growth – Wealthy individuals have flocked to Mauritius in recent years
- Ease of doing business – Mauritius ranked 13th worldwide in World Bank’s Doing Business Report
- Low taxes – There is no inheritance tax or capital gains tax in the country
- Safety – Mauritius was recently rated by New World Wealth as the safest country in Africa
- Financial sector – A growing local financial services sector and stock market (SEMDEX)
As a result, Mauritius has seen the strongest growth in total private wealth over the past decade, followed by Rwanda and Ethiopia.
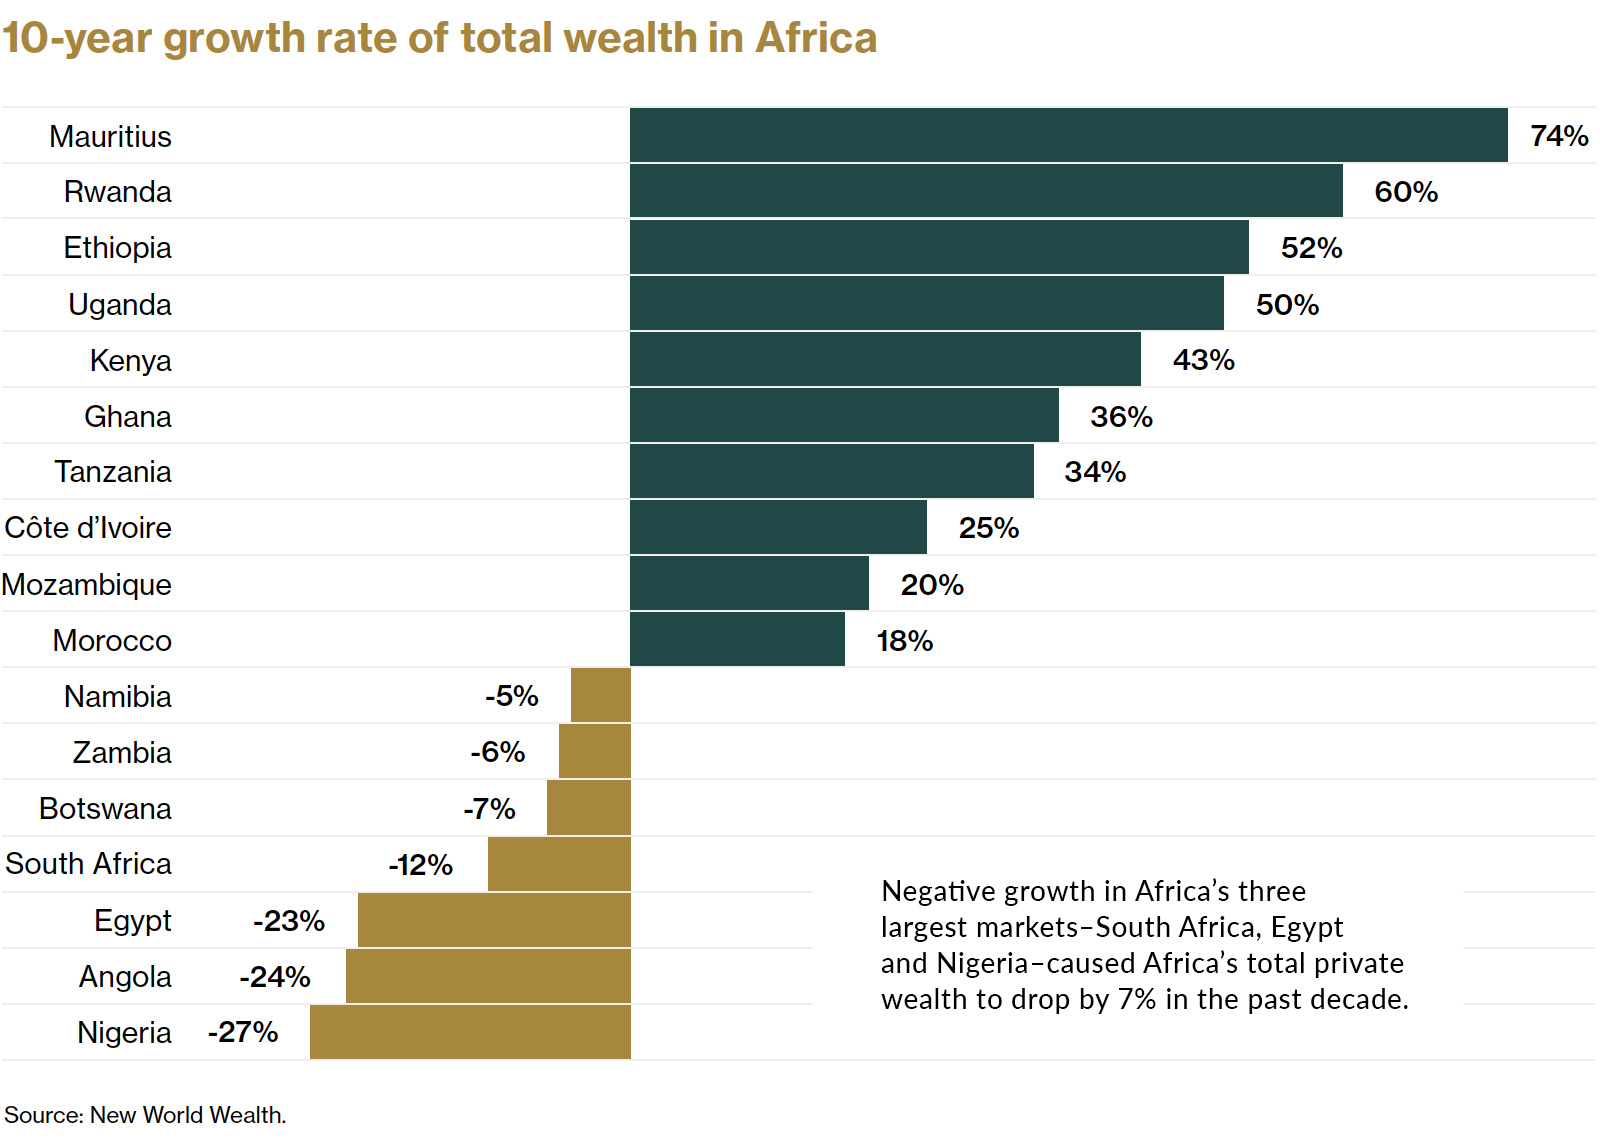
On the flip side of the equation, Nigeria—which is Africa’s largest economy—saw a steep drop in total wealth. The country has struggled in recent years with high unemployment, corruption, and an over-reliance on crude oil.
The Big Picture
Over time, African countries are becoming less dependent on extractive industries, and business conditions are continuing to improve nearly across the board. These tailwinds, combined with the continent’s favorable demographics, point to a bright economic future for Africa.
The outlook for private wealth on the continent is largely positive as well. Total private wealth held in Africa is expected to reach US$3 trillion by 2031, an increase of close to 40%.


Money
How Debt-to-GDP Ratios Have Changed Since 2000
See how much the debt-to-GDP ratios of advanced economies have grown (or shrank) since the year 2000.


How Debt-to-GDP Ratios Have Changed Since 2000
This was originally posted on our Voronoi app. Download the app for free on Apple or Android and discover incredible data-driven charts from a variety of trusted sources.
Government debt levels have grown in most parts of the world since the 2008 financial crisis, and even more so after the COVID-19 pandemic.
To gain perspective on this long-term trend, we’ve visualized the debt-to-GDP ratios of advanced economies, as of 2000 and 2024 (estimated). All figures were sourced from the IMF’s World Economic Outlook.
Data and Highlights
The data we used to create this graphic is listed in the table below. “Government gross debt” consists of all liabilities that require payment(s) of interest and/or principal in the future.
| Country | 2000 (%) | 2024 (%) | Change (pp) |
|---|---|---|---|
| 🇯🇵 Japan | 135.6 | 251.9 | +116.3 |
| 🇸🇬 Singapore | 82.3 | 168.3 | +86.0 |
| 🇺🇸 United States | 55.6 | 126.9 | +71.3 |
| 🇬🇧 United Kingdom | 36.6 | 105.9 | +69.3 |
| 🇬🇷 Greece | 104.9 | 160.2 | +55.3 |
| 🇫🇷 France | 58.9 | 110.5 | +51.6 |
| 🇵🇹 Portugal | 54.2 | 104.0 | +49.8 |
| 🇪🇸 Spain | 57.8 | 104.7 | +46.9 |
| 🇸🇮 Slovenia | 25.9 | 66.5 | +40.6 |
| 🇫🇮 Finland | 42.4 | 76.5 | +34.1 |
| 🇭🇷 Croatia | 35.4 | 61.8 | +26.4 |
| 🇨🇦 Canada | 80.4 | 103.3 | +22.9 |
| 🇨🇾 Cyprus | 56.0 | 70.9 | +14.9 |
| 🇦🇹 Austria | 65.7 | 74.0 | +8.3 |
| 🇸🇰 Slovak Republic | 50.5 | 56.5 | +6.0 |
| 🇩🇪 Germany | 59.3 | 64.0 | +4.7 |
| 🇧🇪 Belgium | 109.6 | 106.8 | -2.8 |
| 🇮🇱 Israel | 77.4 | 56.8 | -20.6 |
| 🇮🇸 Iceland | 75.8 | 54.6 | -21.2 |
The debt-to-GDP ratio indicates how much a country owes compared to the size of its economy, reflecting its ability to manage and repay debts. Percentage point (pp) changes shown above indicate the increase or decrease of these ratios.
Countries with the Biggest Increases
Japan (+116 pp), Singapore (+86 pp), and the U.S. (+71 pp) have grown their debt as a percentage of GDP the most since the year 2000.
All three of these countries have stable, well-developed economies, so it’s unlikely that any of them will default on their growing debts. With that said, higher government debt leads to increased interest payments, which in turn can diminish available funds for future government budgets.
This is a rising issue in the U.S., where annual interest payments on the national debt have surpassed $1 trillion for the first time ever.
Only 3 Countries Saw Declines
Among this list of advanced economies, Belgium (-2.8 pp), Iceland (-21.2 pp), and Israel (-20.6 pp) were the only countries that decreased their debt-to-GDP ratio since the year 2000.
According to Fitch Ratings, Iceland’s debt ratio has decreased due to strong GDP growth and the use of its cash deposits to pay down upcoming maturities.
See More Debt Graphics from Visual Capitalist
Curious to see which countries have the most government debt in dollars? Check out this graphic that breaks down $97 trillion in debt as of 2023.

-

 Real Estate2 weeks ago
Visualizing America’s Shortage of Affordable Homes
-

 Technology1 week ago
Ranked: Semiconductor Companies by Industry Revenue Share
-

 Money1 week ago
Which States Have the Highest Minimum Wage in America?
-

 Real Estate1 week ago
Ranked: The Most Valuable Housing Markets in America
-

 Business2 weeks ago
Charted: Big Four Market Share by S&P 500 Audits
-

 AI2 weeks ago
The Stock Performance of U.S. Chipmakers So Far in 2024
-

 Misc2 weeks ago
Almost Every EV Stock is Down After Q1 2024
-

 Money2 weeks ago
Where Does One U.S. Tax Dollar Go?