

Misc
Mapped: Countries With the Highest Flood Risk


Risk of Flooding Mapped Around the World
Devastating floods across Pakistan this summer have resulted in more than 1,400 lives lost and one-third of the country being under water.
This raises the question: which nations and their populations are the most vulnerable to the risk of flooding around the world?
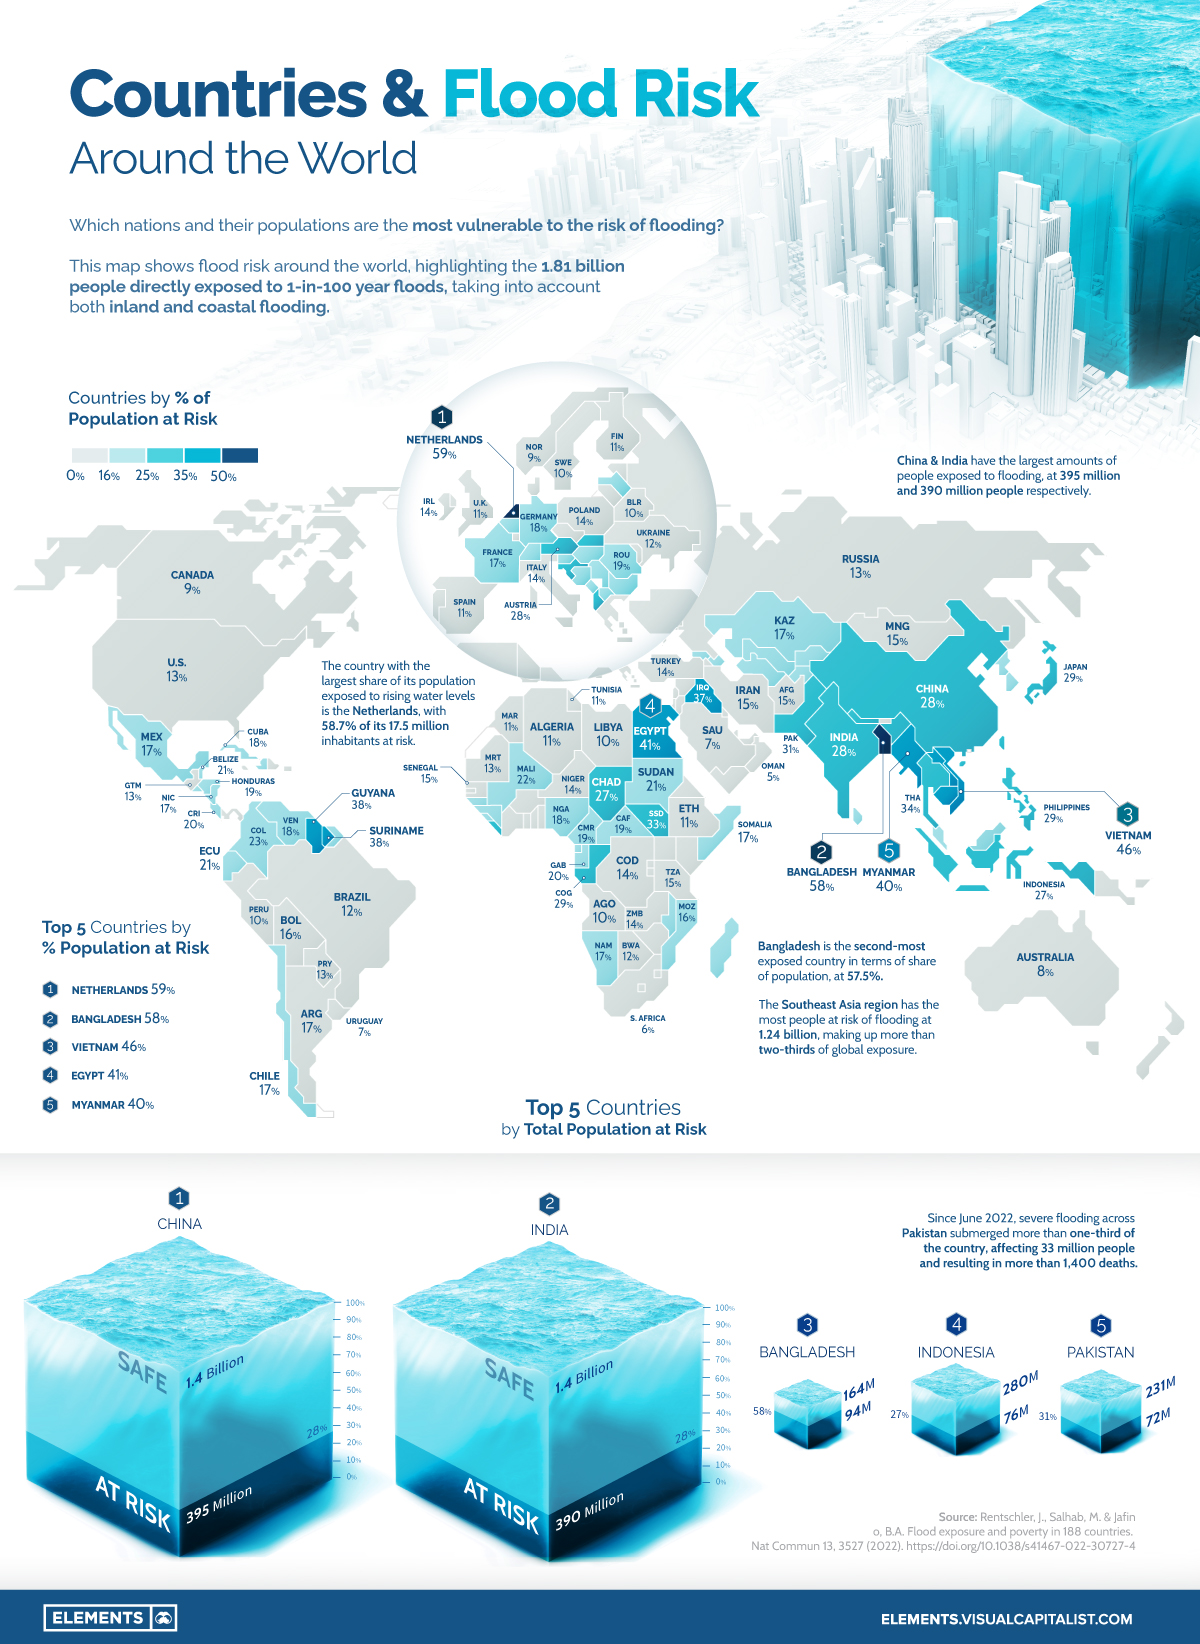
Using data from a recent study published in Nature, this graphic maps flood risk around the world, highlighting the 1.81 billion people directly exposed to 1-in-100 year floods. The methodology takes into account potential risks from both inland and coastal flooding.
Asian Countries Most at Risk from Rising Water Levels
Not surprisingly, countries with considerable coastlines, river systems, and flatlands find themselves with high percentages of their population at risk.
The Netherlands and Bangladesh are the only two nations in the world to have more than half of their population at risk due to flooding, at 59% and 58%, respectively. Vietnam (46%), Egypt (41%), and Myanmar (40%) round out the rest of the top five nations.
Besides the Netherlands, only two other European nations are in the top 20 nations by percentage of population at risk, Austria (18th at 29%) and Albania (20th at 28%).
| Rank | Country | Flood risk, by population exposed (%) | Total population exposed |
|---|---|---|---|
| #1 | 🇳🇱 Netherlands | 58.7% | 10,100,000 |
| #2 | 🇧🇩 Bangladesh | 57.5% | 94,424,000 |
| #3 | 🇻🇳 Vietnam | 46.0% | 45,504,000 |
| #4 | 🇪🇬 Egypt | 40.5% | 38,871,000 |
| #5 | 🇲🇲 Myanmar | 39.9% | 19,104,000 |
| #6 | 🇱🇦 Laos | 39.7% | 2,985,000 |
| #7 | 🇰🇭 Cambodia | 38.1% | 7,431,000 |
| #8 | 🇬🇾 Guyana | 37.9% | 276,000 |
| #9 | 🇸🇷 Suriname | 37.7% | 233,000 |
| #10 | 🇮🇶 Iraq | 36.8% | 16,350,000 |
| #11 | 🇹🇭 Thailand | 33.9% | 25,431,000 |
| #12 | 🇸🇸 South Sudan | 32.5% | 5,437,000 |
| #13 | 🇵🇰 Pakistan | 31.1% | 71,786,000 |
| #14 | 🇳🇵 Nepal | 29.4% | 11,993,000 |
| #15 | 🇨🇬 Republic of the Congo | 29.3% | 1,170,000 |
| #16 | 🇵🇭 Philippines | 29.0% | 30,483,000 |
| #17 | 🇯🇵 Japan | 28.7% | 36,060,000 |
| #18 | 🇦🇹 Austria | 27.8% | 2,437,000 |
| #19 | 🇮🇳 India | 27.7% | 389,816,000 |
| #20 | 🇦🇱 Albania | 27.6% | 771,000 |
| #21 | 🇨🇳 China | 27.5% | 394,826,000 |
| #22 | 🇹🇩 Chad | 27.4% | 4,547,000 |
| #23 | 🇮🇩 Indonesia | 27.0% | 75,696,000 |
| #24 | 🇭🇷 Croatia | 26.9% | 1,094,000 |
| #25 | 🇸🇰 Slovakia | 26.7% | 1,401,000 |
The Southeast Asia region alone makes up more than two-thirds of the global population exposed to flooding risk at 1.24 billion people.
China and India account for 395 million and 390 million people, respectively, with both nations at the top in terms of the absolute number of people at risk of rising water levels. The rest of the top five countries by total population at risk are Bangladesh (94 million people at risk), Indonesia (76 million people at risk), and Pakistan (72 million people at risk).
How Flooding is Already Affecting Countries Like Pakistan
While forecasted climate and natural disasters can often take years to manifest, flooding affected more than 100 million people in 2021. Recent summer floods in Pakistan have continued the trend in 2022.
With 31% of its population (72 million people) at risk of flooding, Pakistan is particularly vulnerable to floods.
In 2010, floods in Pakistan were estimated to have affected more than 18 million people. The recent floods, which started in June, are estimated to have affected more than 33 million people as more than one-third of the country is submerged underwater.
The Cost of Floods Today and in the Future
Although the rising human toll is by far the biggest concern that floods present, they also bring with them massive economic costs. Last year, droughts, floods, and storms caused economic losses totaling $224.2 billion worldwide, nearly doubling the 2001-2020 annual average of $117.8 billion.
A recent report forecasted that water risk (caused by droughts, floods, and storms) could eat up $5.6 trillion of global GDP by 2050, with floods projected to account for 36% of these direct losses.
As both human and economic losses caused by floods continue to mount, nations around the world will need to focus on preventative infrastructure and restorative solutions for ecosystems and communities already affected and most at risk of flooding.


Misc
Brass Rods: The Secure Choice
This graphic shows why brass rods are the secure choice for precision-machined and forged parts.

Brass Rods: The Secure Choice
The unique combination of machinability and recyclability makes brass rods the secure choice for manufacturers seeking future-proof raw material solutions.
This infographic, from the Copper Development Association, shows three ways brass rods give manufacturers greater control and a license to grow in the competitive market for precision-machined and forged products.
Future-Proof Investments in New Machine Tools
A material’s machinability directly impacts machine throughput, which typically has the largest impact on machine shop profitability.
The high-speed machining capabilities of brass rods maximize machine tool performance, allowing manufacturers to run the material faster and longer without sacrificing tool life, chip formation, or surface quality.
The high machining efficiency of brass leads to reduced per-part costs, quicker return on investment (ROI) for new machine tools, and expanded production capacity for new projects.
Supply Security Through Closed Loop Recycling
Brass, like its parent element copper, can be infinitely recycled.
In 2022, brass- and wire-rod mills accounted for the majority of the 830,000 tonnes of copper recycled from scrap in the U.S.
Given that scrap ratios for machined parts typically range from 60-70% by weight, producing mills benefit from a secure and steady supply of clean scrap returned directly from customers, which is recycled to create new brass rods.
The high residual value of brass scrap creates a strong recycling incentive. Scrap buy back programs give manufacturers greater control over raw material net costs as scrap value is often factored into supplier purchase agreements.
Next Generation Alloys for a Lead-Free Future
Increasingly stringent global regulations continue to pressure manufacturers to minimize the use of materials containing trace amounts of lead and other harmful impurities.
The latest generation of brass-rod alloys is engineered to meet the most demanding criteria for lead leaching in drinking water and other sensitive applications.
Seven brass-rod alloys passed rigorous testing to become the only ‘Acceptable Materials’ against lower lead leaching criteria recently adopted in the national U.S. drinking water quality standard, NSF 61.
Learn more about the advantages of brass rods solutions.
Misc
Brass Rods: The Safe Choice
From airbags to firefighting equipment, components made from brass rods play a vital role in creating a safer environment.

Brass Rods: The Safe Choice
From airbags to firefighting equipment, components made from brass rods play a vital role in creating a safer environment.
This infographic from the Copper Development Association illustrates three use cases for brass. This is the first of three infographics in our Choose Brass series.
Why Brass?
Brass is one of the most reliable metals for industrial and other applications. It contains little to no iron, protecting it from oxidation, which can cause other materials to fail over time.
Additionally, the malleability of brass ensures tight and leak-free metal-to-metal seals for threaded joints, minimizing the risk of costly and dangerous system failures. Brass’s durability ensures critical system components function properly for years.
Brass for Safe Water Systems
Exposure to lead in water can cause various health problems, including neurological damage, developmental delays, and cardiovascular diseases.
As a result, the U.S. sets minimum health-effect requirements for chemical contaminants and impurities indirectly transferred to drinking water from products, components, and materials used in water systems.
Currently, only brass rod alloys are designated as “acceptable materials” according to national standards.
Brass is also essential for ensuring workplace safety, particularly in high-risk manufacturing environments.
Using Brass for Safe Manufacturing and Industrial Environments
Brass is used extensively in industrial applications such as machinery components, valves, fittings, architectural elements, bearings, and gears.
The machinability of brass rods also means longer tool life and higher productivity for manufacturers of precision parts.
The microstructure of brass helps break up metal chips generated during machining operations, preventing long and stringy chips that can crash machines and seriously injure operators.
Additionally, brass’s non-sparking properties make it ideal for tooling, fittings, and components in high-risk industries such as oil & gas, chemicals, pharmaceuticals, paint manufacturing, power plants, and explosives.
Brass for Safer Communities
Many pieces of equipment in our daily lives also rely on brass rod parts to function. Control valves in gas stoves, BBQs, and home furnaces made from brass rods reduce the risk of deadly gas leaks and fires.
Moreover, brass is ideal for firefighting equipment due to its corrosion resistance, durability, heat resistance, and non-sparking properties.
Fittings made from brass rods ensure that the brakes and airbags in our vehicles work when needed.
Brass and other copper-based alloys are also naturally antimicrobial, helping prevent diseases when used in high-touch surfaces such as door handles.
These are only some of the ways that brass rods help build a safer world for everyone.
Explore the Advantages of Brass Rod Solutions.

-

 Electrification3 years ago
Ranked: The Top 10 EV Battery Manufacturers
-

 Electrification2 years ago
The Key Minerals in an EV Battery
-

 Real Assets3 years ago
The World’s Top 10 Gold Mining Companies
-

 Misc3 years ago
All the Metals We Mined in One Visualization
-

 Electrification3 years ago
The Biggest Mining Companies in the World in 2021
-

 Energy Shift2 years ago
What Are the Five Major Types of Renewable Energy?
-

 Electrification2 years ago
The World’s Largest Nickel Mining Companies
-

 Electrification2 years ago
Mapped: Solar Power by Country in 2021