Money
Mapped: The World’s Billionaire Population, by Country


Visualized: The World’s Billionaire Population
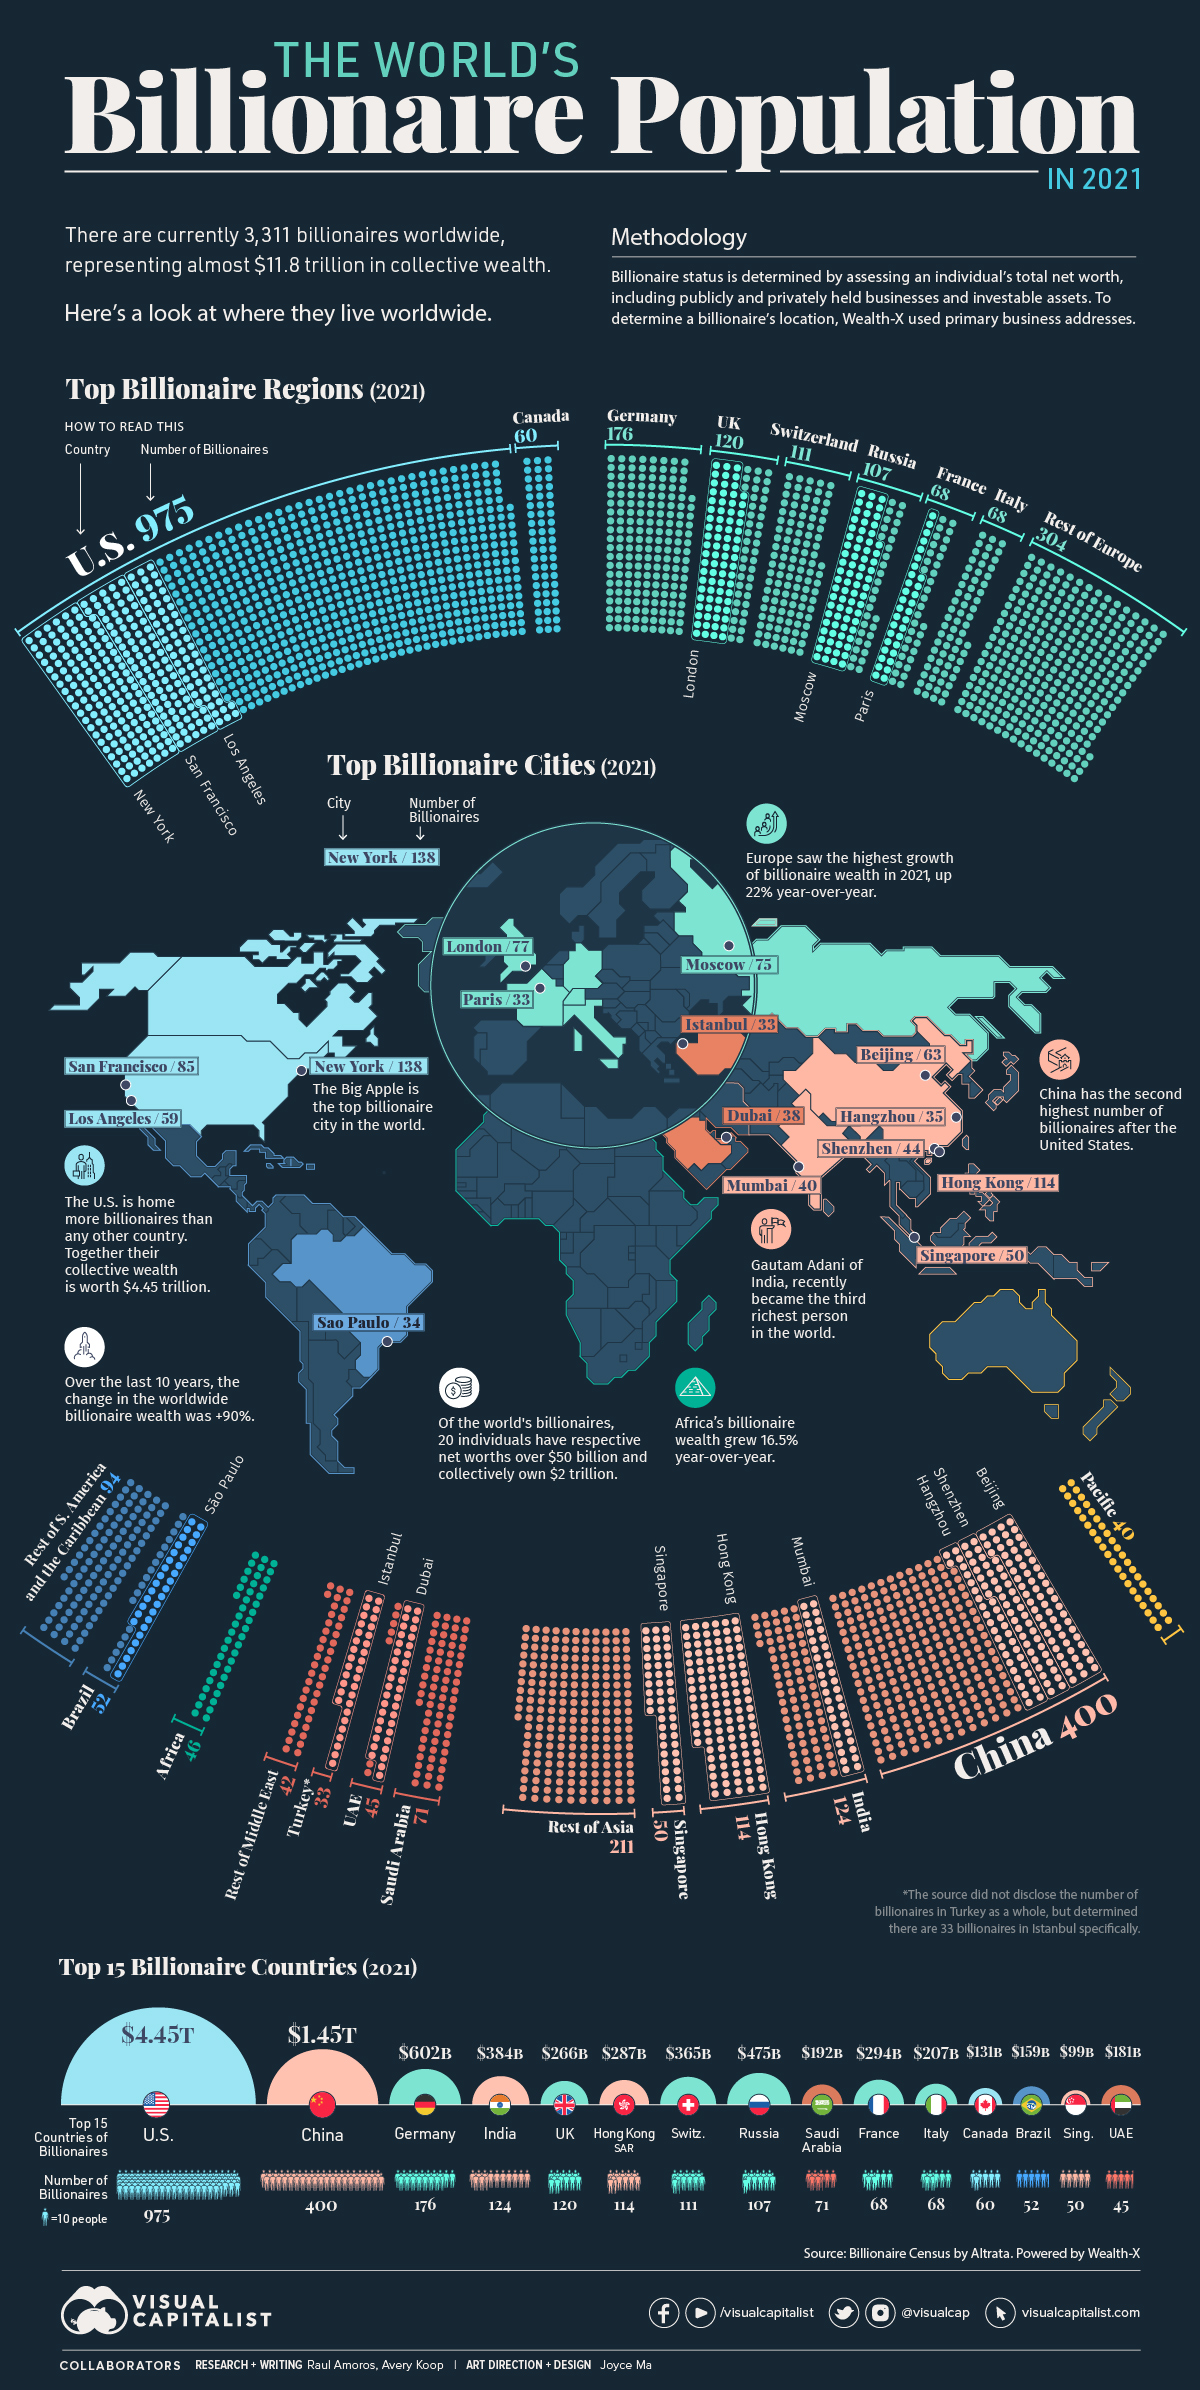
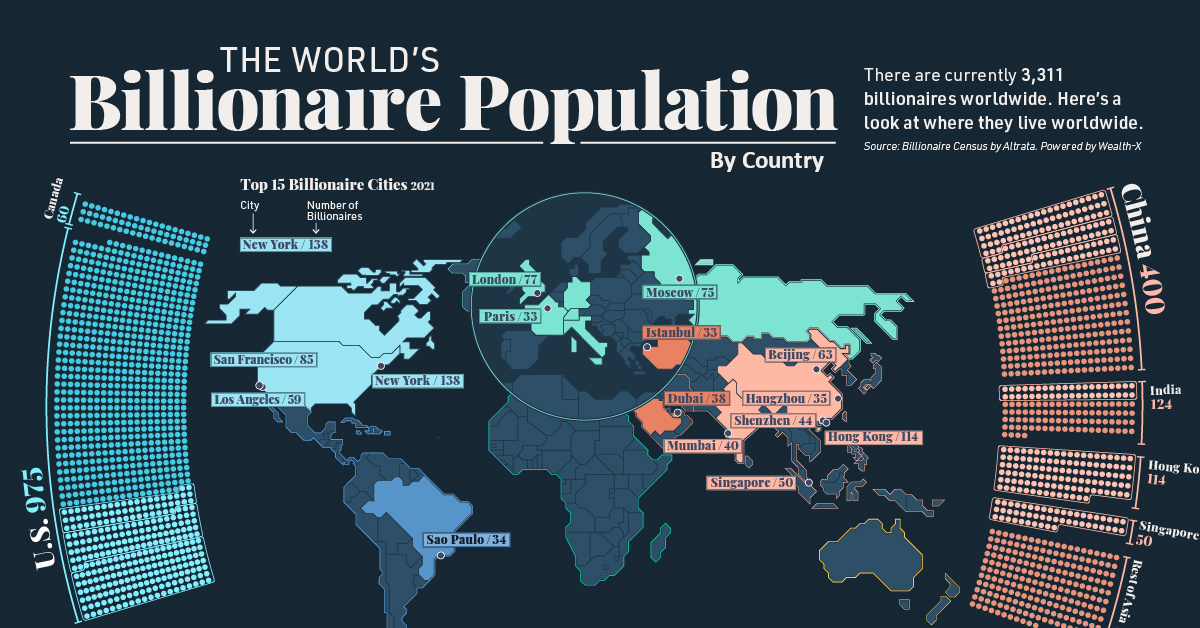
The world’s billionaires—only 3,311 individuals—represent almost $11.8 trillion in wealth. The global billionaire population continued to grow in 2021, increasing by 3%. Over the same period, billionaire wealth also increased by 18%.
This map uses data from the Wealth-X Billionaire Census to visualize where the world’s billionaires live and breaks down their collective wealth.
Note on methodology: The report uses proprietary data from Wealth-X. Billionaire status is determined by assessing an individual’s total net worth, including publicly and privately held businesses and investable assets. To determine a billionaire’s location, Wealth-X used their primary business address.
Billionaires by Region
We’ll begin by zooming out to look at how various continents and world regions rank in terms of their billionaire population.
North America is home to most billionaires, worth $4.6 trillion. The U.S., unsurprisingly, accounts for the majority of this wealth, with 975 billionaires and a collective net worth of $4.45 trillion.
| Rank | Region | Number of billionaires | Collective Billionaire Wealth |
|---|---|---|---|
| #1 | North America | 1,035 | $4.6 trillion |
| #2 | Europe | 954 | $3.1 trillion |
| #3 | Asia | 899 | $2.9 trillion |
| #4 | Middle East | 191 | $519 billion |
| #5 | Latin America and the Caribbean | 146 | $465 billion |
| #6 | Africa | 46 | $104 billion |
| #7 | Pacific | 40 | $89 billion |
In regional terms, Europe’s billionaire wealth is growing the fastest, up 22% year-over-year in 2021. In contrast, the year-over-year change in the Middle East was -12.5%.
Asia is inching towards Europe, holding almost a quarter of all billionaire wealth worldwide, compared to Europe’s 26.5%.
Wealth in Africa will also be important to watch in coming years. Although only home to 46 billionaires currently, the change in billionaire wealth increased by almost 17% year-over-year. Additionally, while they no longer live there, a number of the world’s billionaires hail from African countries originally.
Billionaires by Country
Now, let’s look at the ranking broken down by the top 15 countries:
| Rank | Country | Number of Billionaires | Collective Billionaire Wealth |
|---|---|---|---|
| #1 | 🇺🇸 US | 975 | $4.45 trillion |
| #2 | 🇨🇳 China | 400 | $1.45 trillion |
| #3 | 🇩🇪 Germany | 176 | $602 billion |
| #4 | 🇮🇳 India | 124 | $384 billion |
| #5 | 🇬🇧 UK | 120 | $266 billion |
| #6 | 🇭🇰 Hong Kong SAR | 114 | $287 billion |
| #7 | 🇨🇭 Switzerland | 111 | $365 billion |
| #8 | 🇷🇺 Russia | 107 | $475 billion |
| #9 | 🇸🇦 Saudi Arabia | 71 | $192 billion |
| #10 | 🇫🇷 France | 68 | $294 billion |
| #11 | 🇮🇹 Italy | 68 | $207 billion |
| #12 | 🇨🇦 Canada | 60 | $131 billion |
| #13 | 🇧🇷 Brazil | 52 | $159 billion |
| #14 | 🇸🇬 Singapore | 50 | $99 billion |
| #15 | 🇦🇪 UAE | 45 | $181 billion |
China is an obvious second in billionaire wealth to the United States, with famous billionaires like Zhang Yiming ($44.5 billion) of TikTok and Zhong Shanshan ($67.1 billion), whose wealth primarily comes from the pharmaceutical and beverages industries.
That said, Chinese billionaire wealth actually decreased 2% last year. It was India that came out on top in terms of growth, seeing a 19% increase in 2021.
Billionaires by City
Looking at cities, New York is home to the most billionaires—with 13 added billionaire residents last year—followed by Hong Kong.
| Rank | City | Country | Number of Billionaires |
|---|---|---|---|
| #1 | New York City | 🇺🇸 U.S. | 138 |
| #2 | Hong Kong | 🇭🇰 China | 114 |
| #3 | San Francisco | 🇺🇸 U.S. | 85 |
| #4 | London | 🇬🇧 UK | 77 |
| #5 | Moscow | 🇷🇺 Russia | 75 |
| #6 | Beijing | 🇨🇳 China | 63 |
| #7 | Los Angeles | 🇺🇸 U.S. | 59 |
| #8 | Singapore | 🇸🇬 Singapore | 50 |
| #9 | Shenzhen | 🇨🇳 China | 44 |
| #10 | Mumbai | 🇮🇳 India | 40 |
| #11 | Dubai | 🇦🇪 UAE | 38 |
| #12 | Hangzhou | 🇨🇳 China | 35 |
| #13 | São Paulo | 🇧🇷 Brazil | 34 |
| #14 | Istanbul | 🇹🇷 Turkey | 33 |
| #15 | Paris | 🇫🇷 France | 33 |
Billionaire Wealth in 2022
Billionaires have significant power and influence, not in the least because their collective wealth is equivalent to about 11.8% of global GDP.
In recent billionaire news, Gautam Adani’s wealth has been soaring, most recently hitting the $145 billion mark, making him the third-richest person in the world according to Bloomberg’s Billionaire Index. However, not all billionaires are holding on to their wealth. Patagonia founder, Yvon Chouinard, recently transferred ownership of his company to an organization that fights climate change.
Over the last decade, billionaires have been grown their fortunes considerably, with wealth increasing at a faster rate than the growth in the number of billionaires themselves. According to Wealth-X, collective billionaire net worth grew by an astonishing 90% in the last 10 years.
But in the shorter term, the situation is often more volatile. With markets reeling in 2022, Bloomberg reported that billionaires lost a record $1.4 trillion over the first half of the year. Once the year is over and the final numbers are in, it will be interesting to see how the billionaire landscape shapes up in comparison to the more long-term trend.


Money
Charted: Who Has Savings in This Economy?
Older, better-educated adults are winning the savings game, reveals a January survey by the National Opinion Research Center at the University of Chicago.


Who Has Savings in This Economy?
This was originally posted on our Voronoi app. Download the app for free on iOS or Android and discover incredible data-driven charts from a variety of trusted sources.
Two full years of inflation have taken their toll on American households. In 2023, the country’s collective credit card debt crossed $1 trillion for the first time. So who is managing to save money in the current economic environment?
We visualize the percentage of respondents to the statement “I have money leftover at the end of the month” categorized by age and education qualifications. Data is sourced from a National Endowment for Financial Education (NEFE) report, published last month.
The survey for NEFE was conducted from January 12-14, 2024, by the National Opinion Research Center at the University of Chicago. It involved 1,222 adults aged 18+ and aimed to be representative of the U.S. population.
Older Americans Save More Than Their Younger Counterparts
General trends from this dataset indicate that as respondents get older, a higher percentage of them are able to save.
| Age | Always/Often | Sometimes | Rarely/Never |
|---|---|---|---|
| 18–29 | 29% | 33% | 38% |
| 30–44 | 36% | 27% | 37% |
| 45–59 | 39% | 23% | 38% |
| Above 60 | 49% | 28% | 23% |
| All Adults | 39% | 33% | 27% |
Note: Percentages are rounded and may not sum to 100.
Perhaps not surprisingly, those aged 60+ are the age group with the highest percentage saying they have leftover money at the end of the month. This age group spent the most time making peak earnings in their careers, are more likely to have investments, and are more likely to have paid off major expenses like a mortgage or raising a family.
The Impact of Higher Education on Earnings and Savings
Based on this survey, higher education dramatically improves one’s ability to save. Shown in the table below, those with a bachelor’s degree or higher are three times more likely to have leftover money than those without a high school diploma.
| Education | Always/Often | Sometimes | Rarely/Never |
|---|---|---|---|
| No HS Diploma | 18% | 26% | 56% |
| HS Diploma | 28% | 33% | 39% |
| Associate Degree | 33% | 31% | 36% |
| Bachelor/Higher Degree | 59% | 21% | 20% |
| All Adults | 39% | 33% | 27% |
Note: Percentages are rounded and may not sum to 100.
As the Bureau of Labor Statistics notes, earnings improve with every level of education completed.
For example, those with a high school diploma made 25% more than those without in 2022. And as the qualifications increase, the effects keep stacking.
Meanwhile, a Federal Reserve study also found that those with more education tended to make financial decisions that contributed to building wealth, of which the first step is to save.

-

 Markets1 week ago
U.S. Debt Interest Payments Reach $1 Trillion
-

 Business2 weeks ago
Charted: Big Four Market Share by S&P 500 Audits
-

 Real Estate2 weeks ago
Ranked: The Most Valuable Housing Markets in America
-

 Money2 weeks ago
Which States Have the Highest Minimum Wage in America?
-

 AI2 weeks ago
Ranked: Semiconductor Companies by Industry Revenue Share
-

 Markets2 weeks ago
Ranked: The World’s Top Flight Routes, by Revenue
-

 Demographics2 weeks ago
Population Projections: The World’s 6 Largest Countries in 2075
-

 Markets2 weeks ago
The Top 10 States by Real GDP Growth in 2023