Misc
Ranked: The World’s Most Surveilled Cities


Ranked: The World’s Most Surveilled Cities
This may come as a surprise, but it wasn’t until 2007 that the global urban population overtook the rural population. At that time, the two groups were split nearly 50/50, with around 3.3 billion people apiece.
Today, the percentage of people living in urban areas has grown to over 55%, and is expected to reach 68% by 2050. Due to this trend, many of the world’s largest cities have become home to tens of millions of people.
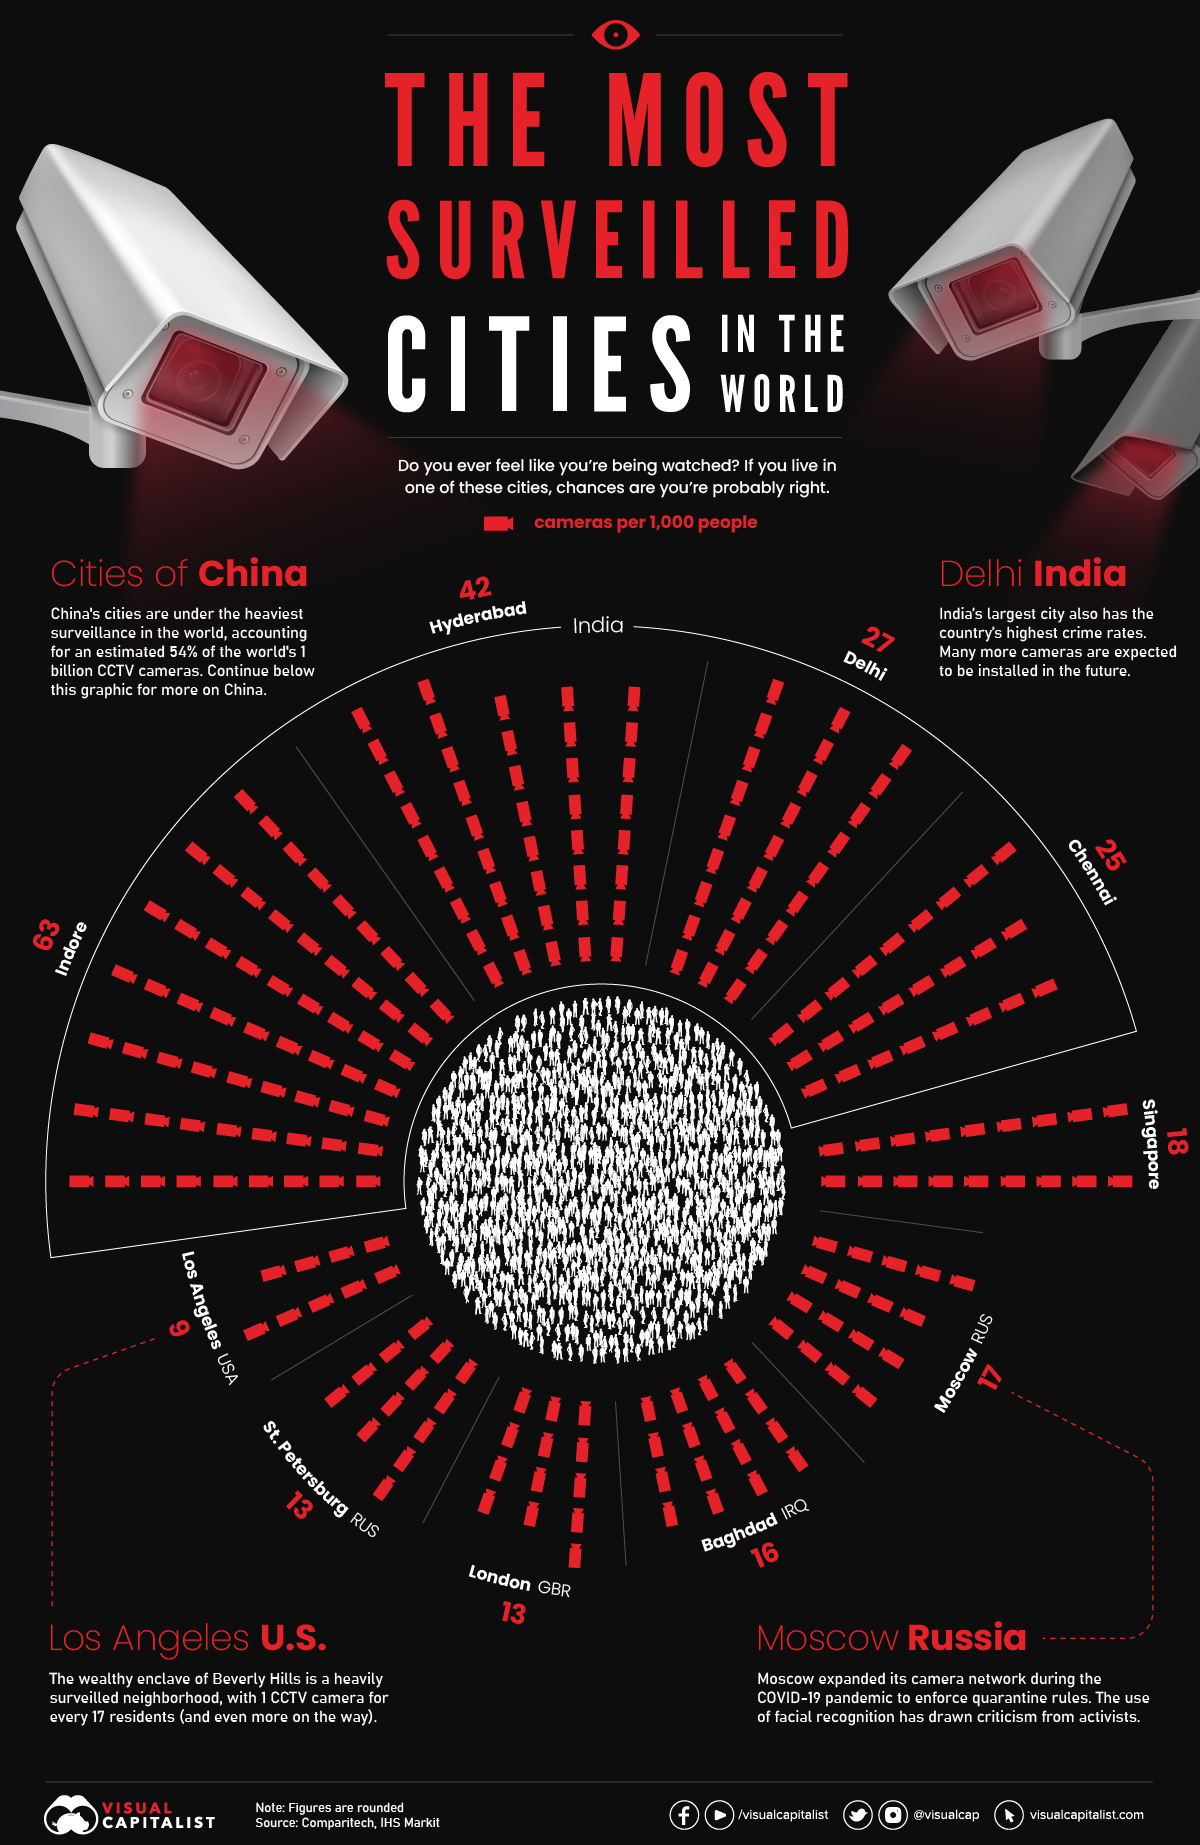
In response to such incredible density, governments, businesses, and households have installed countless security cameras for various purposes including crime protection. To grasp the scale of this surveillance, we’ve taken data from a recent report by Comparitech to visualize the most surveilled cities in the world.
The List (Excluding China)
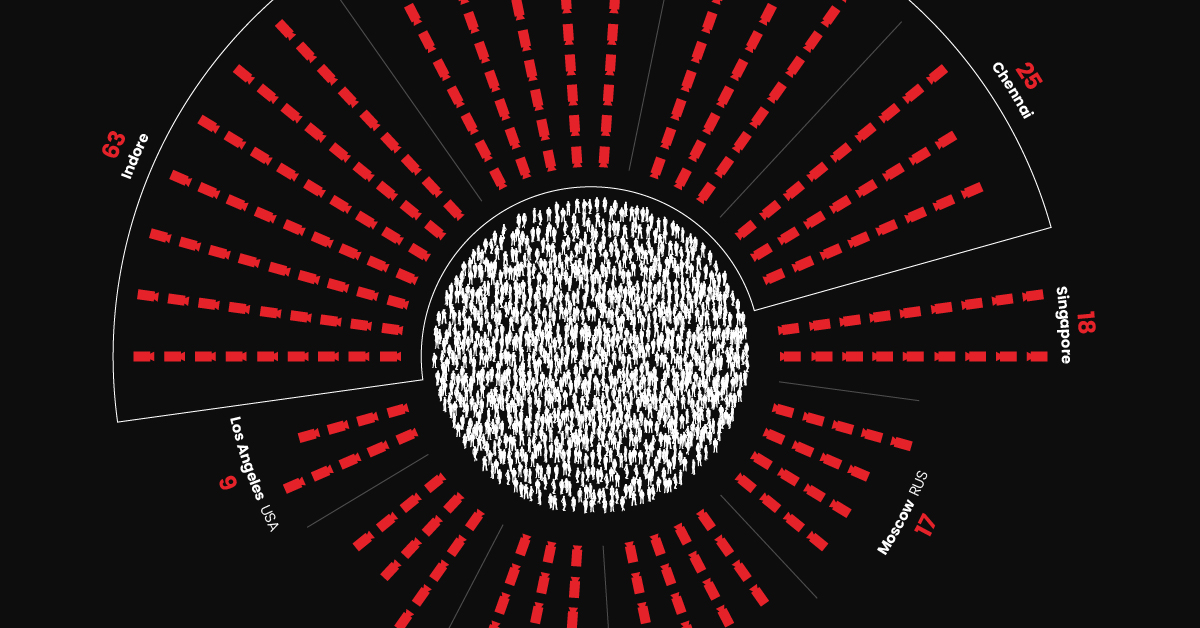
Excluding China for the time being, these are the world’s 10 most surveilled cities.
| City | Population | Number of Cameras | Cameras per 1,000 people |
|---|---|---|---|
| 🇮🇳 Indore, India | 3.2M | 200,600 | 63 |
| 🇮🇳 Hyderabad, India | 10.5M | 440,299 | 42 |
| 🇮🇳 Delhi, India | 16.3M | 436,600 | 27 |
| 🇮🇳 Chennai, India | 11.5M | 282,126 | 25 |
| 🇸🇬 Singapore | 6.0M | 108,981 | 18 |
| 🇷🇺 Moscow, Russia | 12.6M | 213,000 | 17 |
| 🇮🇶 Baghdad, Iraq | 7.5M | 120,000 | 16 |
| 🇬🇧 London, UK | 9.5M | 127,373 | 13 |
| 🇷🇺 St. Petersburg, Russia | 5.5M | 70,000 | 13 |
| 🇺🇸 Los Angeles, U.S. | 3.9M | 34,959 | 9 |
Figures rounded
The top four cities all belong to India, which is the world’s second largest country by population. Surveillance cameras are playing a major role in the country’s efforts to reduce crimes against women.
Further down the list are cities from a variety of countries. One of these is Russia, which has expanded its use of surveillance cameras in recent years. Given the country’s track record of human rights violations, activists are worried that facial recognition technology could become a tool of oppression.
The only U.S. city on the list is Los Angeles, which contains some of the country’s wealthiest neighborhoods and municipalities. That includes Beverly Hills, which according to the Los Angeles Times, has over 2,000 cameras for its population of 32,500. That translates to about 62 cameras per 1,000 people, meaning that Beverly Hills would finish at #2 in the global ranking if it were listed as a separate entity.
Surveillance in China
IHS Markit estimates that as of 2021, there are over 1 billion surveillance cameras installed worldwide. The firm also believes that 54% of these cameras are located in China.
Because of limited transparency, it’s impossible to pinpoint how many cameras are actually in each Chinese city. However, if we assume that China has 540 million cameras and divide that amongst its population of 1.46 billion, we can reasonably say that there are 373 cameras per 1,000 people (figures rounded).
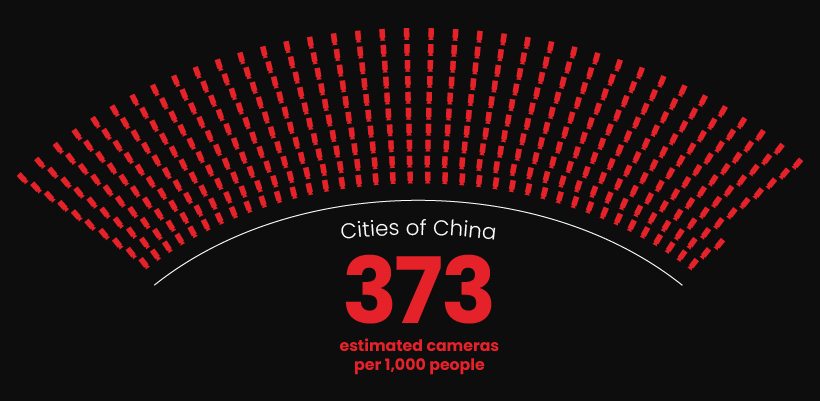
A limitation of this approach is that it assumes everyone in China lives in a city, which is far from reality. The most recent World Bank figures suggest that 37% of China’s population is rural, which equates to over 500 million people.
With this in mind, the number of cameras per 1,000 people in a Tier 1+ Chinese city (e.g. Shanghai) is likely far greater than 373.
More About China
China’s expansive use of cameras and facial recognition technology has been widely documented in the media. These networks enable the country’s social credit program, which gives local governments an unprecedented amount of oversight over its citizens.
For example, China’s camera networks can be used to verify ATM withdrawals, permit access into homes, and even publicly shame people for minor offences like jaywalking.
This might sound like a dystopian nightmare to Western audiences, but according to Chinese citizens, it’s mostly a good thing. In a 2018 survey of 2,209 citizens, 80% of respondents approved of social credit systems.
If you’re interested in learning more about surveillance in Chinese cities, consider this video from The Economist, which explores the opportunities and dangers of comprehensive state control.


Politics
Charted: Trust in Government Institutions by G7 Countries
How much do you trust the government and its various institutions? We look at data for G7 countries for the time period of 2006-2023.


Trust in Government Institutions by G7 Countries
This was originally posted on our Voronoi app. Download the app for free on iOS or Android and discover incredible data-driven charts from a variety of trusted sources.
How much do you trust the government, and its various institutions?
It’s likely that your level of confidence probably depends on a wide range of factors, such as perceived competency, historical context, economic performance, accountability, social cohesion, and transparency.
And for these same reasons, trust levels in government institutions also change all the time, even in the world’s most developed countries: the G7.
Confidence in Government by G7 Countries (2006-2023)
This chart looks at the changes in trust in government institutions between the years 2006 and 2023, based on data from a multi-country Gallup poll.
Specifically, this dataset aggregates confidence in multiple national institutions, including the military, the judicial system, the national government, and the integrity of the electoral system.
| Country | Confidence (2006) | Confidence (2023) | Change (p.p.) |
|---|---|---|---|
| Canada | 57% | 64% | +7 |
| Britain | 63% | 63% | +0 |
| Germany | 55% | 61% | +6 |
| France | 54% | 60% | +6 |
| Japan | 48% | 59% | +11 |
| Italy | 41% | 54% | +13 |
| United States | 63% | 50% | -13 |
What’s interesting here is that in the G7, a group of the world’s most developed economies, there is only one country bucking the general trend: the United States.
Across most G7 countries, confidence in institutions has either improved or stayed the same between 2006 and 2023. The largest percentage point (p.p.) increases occur in Italy and Japan, which saw +13 p.p. and +11 p.p. increases in trust over the time period.
In the U.S., however, confidence in government institutions has fallen by 13 p.p. over the years. What happened?
Key Figures on U.S. Trust in Institutions
In 2006, the U.S. was tied with the UK as having the highest confidence in government institutions, at 63%.
But here’s where the scores stand in 2023, across various institutions:
| 🇺🇸 Institutions | Confidence (2023) |
|---|---|
| Military | 81% |
| Judiciary | 42% |
| National Government | 30% |
| Elections | 44% |
| Overall | 49% |
Based on this data, it’s clear that the U.S. lags behind in three key indicators: confidence in the national government, confidence in the justice system, and confidence in fair elections. It ranked in last place for each indicator in the G7.
One other data point that stands out: despite leading the world in military spending, the U.S. is only the third most confident in its military in the G7. It lags behind France (86%) and the United Kingdom (83%).

-

 United States6 days ago
Visualizing the Most Common Pets in the U.S.
-

 Debt2 weeks ago
How Debt-to-GDP Ratios Have Changed Since 2000
-

 Culture2 weeks ago
The Highest Earning Athletes in Seven Professional Sports
-

 Science2 weeks ago
Visualizing the Average Lifespans of Mammals
-

 Brands2 weeks ago
How Tech Logos Have Evolved Over Time
-

 Energy2 weeks ago
Ranked: The Top 10 EV Battery Manufacturers in 2023
-

 Demographics2 weeks ago
Countries With the Largest Happiness Gains Since 2010
-

 Economy2 weeks ago
VC+: Get Our Key Takeaways From the IMF’s World Economic Outlook