Money
Ranked: The World’s Richest Billionaires Over the Past 10 Years
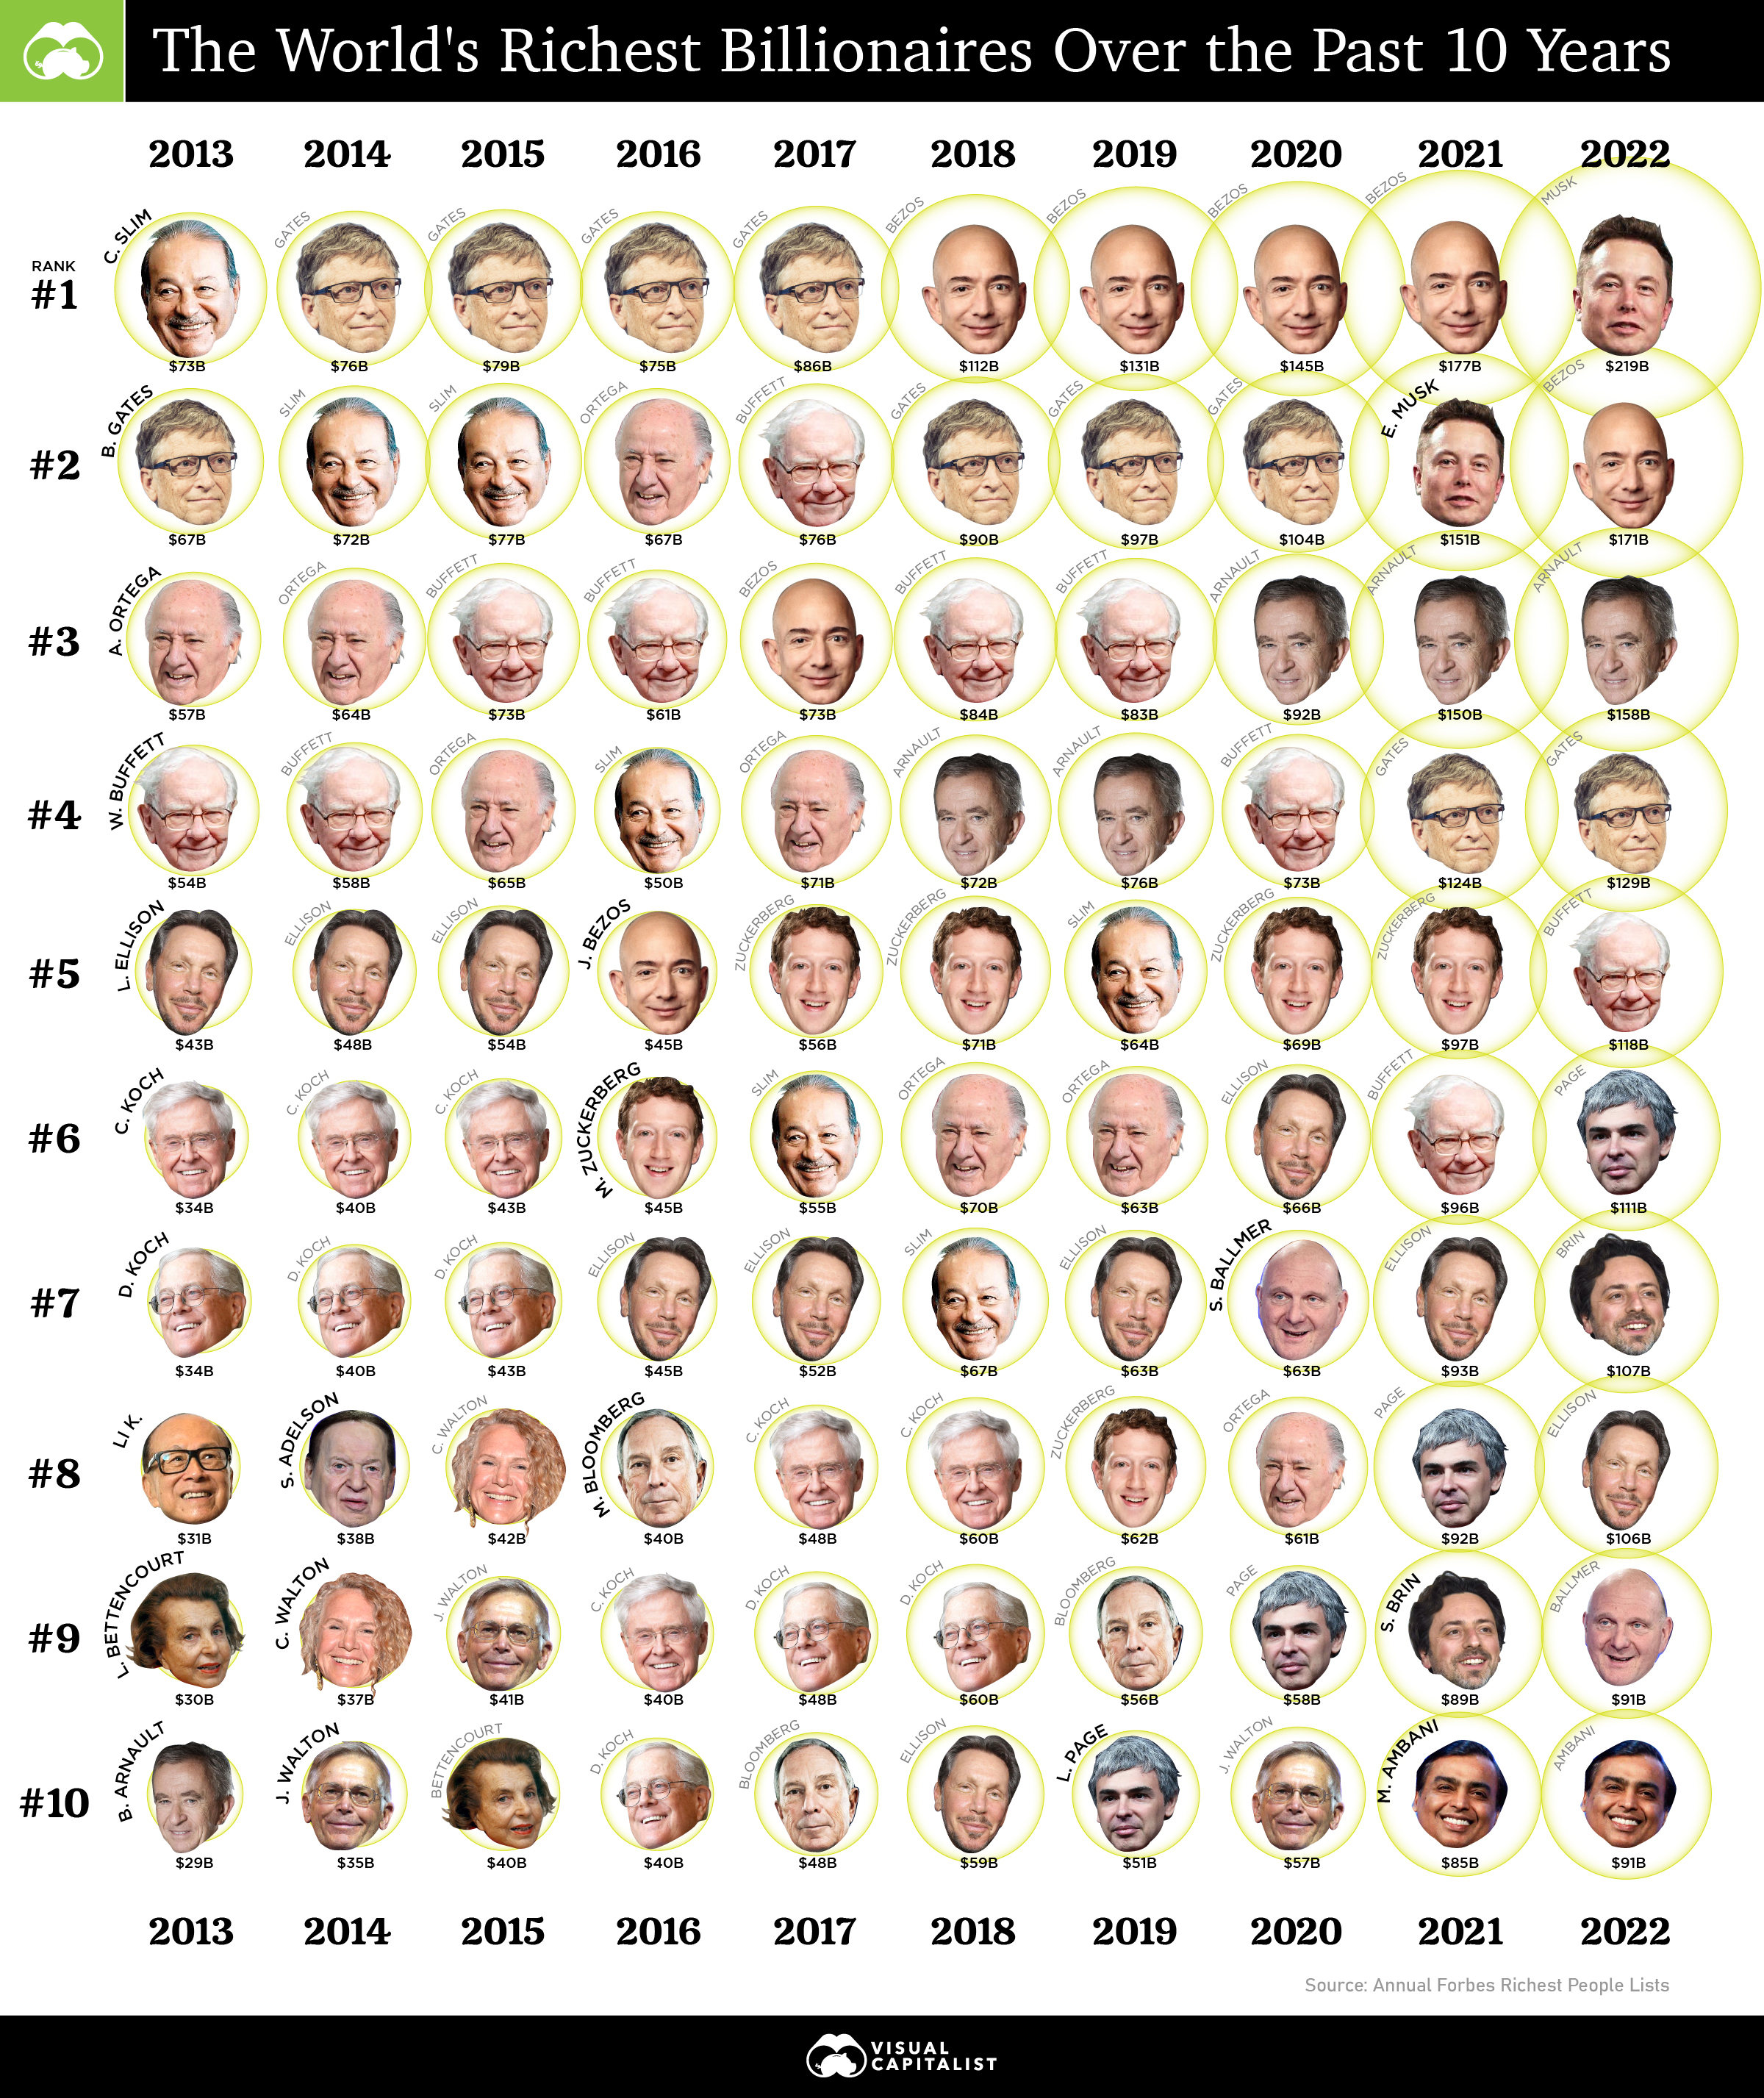


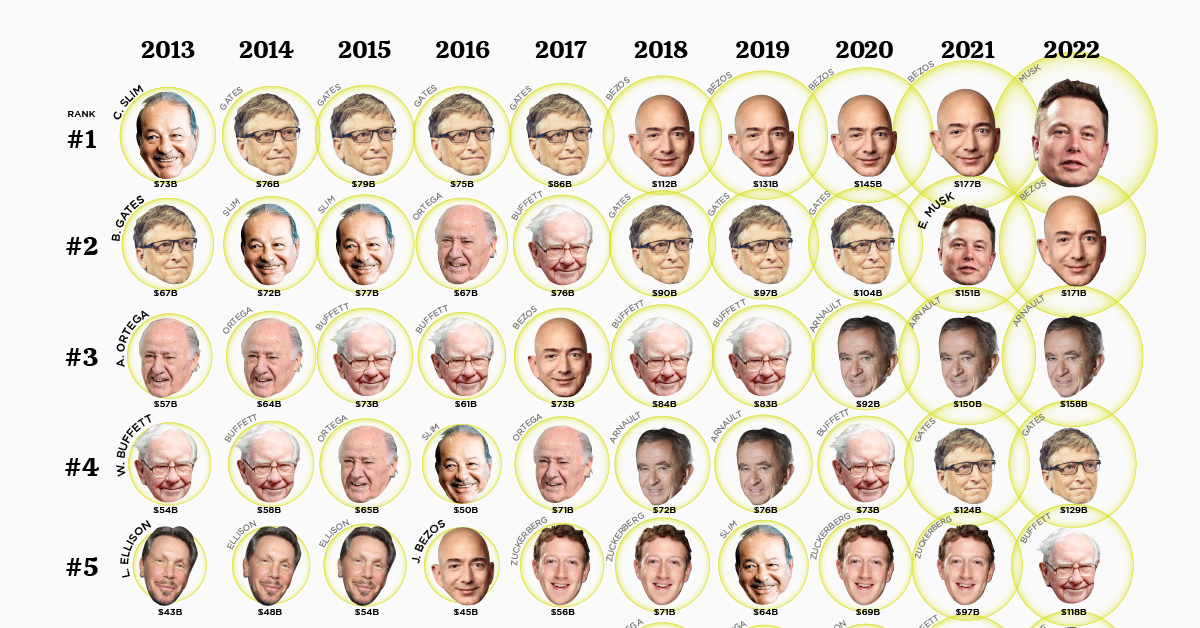
Ranked: The World’s Richest Billionaires Over the Past 10 Years
The last decade has seen a number of changes in the world’s richest billionaires list.
For one, there are new faces at the top of the leaderboard that were never there before. One of the most obvious changes though, is that the richest billionaires have accumulated a lot more wealth in recent years.
Using annual data from Forbes on the richest billionaires, we’ve visualized the wealth and ranking of the top 10 billionaires over the past decade.
Who are the World’s Richest Billionaires?
While the pecking order has fluctuated, the leaderboard remains very exclusive. Out of a possible 10 spots, there are only 19 individuals that have made the list over the last decade.
Here’s the current list of richest billionaires in 2022, including when they first made the list (if in the last decade):
| Rank | Name | Country | Net Worth (2022) | First Year on List* |
|---|---|---|---|---|
| #1 | Elon Musk | 🇺🇸 U.S. | $219 billion | 2021 |
| #2 | Jeff Bezos | 🇺🇸 U.S. | $171 billion | 2016 |
| #3 | Bernard Arnault | 🇫🇷 France | $158 billion | - |
| #4 | Bill Gates | 🇺🇸 U.S. | $129 billion | - |
| #5 | Warren Buffett | 🇺🇸 U.S. | $118 billion | - |
| #6 | Larry Page | 🇺🇸 U.S. | $111 billion | 2019 |
| #7 | Sergey Brin | 🇺🇸 U.S. | $107 billion | 2021 |
| #8 | Larry Ellison | 🇺🇸 U.S. | $106 billion | - |
| #9 | Steve Ballmer | 🇺🇸 U.S. | $91 billion | 2020 |
| #10 | Mukesh Ambani | 🇮🇳 India | $91 billion | - |
*Billionaires with “-” first made the list at an earlier date. Example: Mukesh Ambani made the 2008 list.
Microsoft co-founder turned philanthropist, Bill Gates, is a perennial presence at the top of these lists. Gates is currently at his lowest rank over this time period, but is still in fourth spot. The billionaire has pledged to give away nearly all of his fortune to the eponymously named Bill & Melinda Gates Foundation.
From 2018 to 2021, Jeff Bezos sat at the top of the world’s richest people ranking, only to be bumped out by Elon Musk. In 2020, Bezos became the first person to amass a $200 billion fortune after Amazon’s stock price surged during the pandemic. In recent months, Bezos’ net worth has taken a hit as Amazon’s share price has fallen back down to Earth.
Today, Elon Musk is the world’s richest person.
The Rich Get Richer
Over time, the median net worth of the richest billionaires has grown significantly.
| Year | Median Net Worth of Top 10 Billionaires |
|---|---|
| 2013 | $39 billion |
| 2014 | $44 billion |
| 2015 | $49 billion |
| 2016 | $45 billion |
| 2017 | $56 billion |
| 2018 | $71 billion |
| 2019 | $64 billion |
| 2020 | $68 billion |
| 2021 | $97 billion |
| 2022 | $115 billion |
Most fortunes are held in the form of business equity, real estate, and publicly-traded stocks—all asset classes that have benefited from the era of cheap money and ultra-low interest rates.
Over the decade period, the median net worth of the top 10 billionaires has nearly tripled from $39 billion to $115 billion.
In fact, the first billionaire to pass the $100 billion threshold was Jeff Bezos in 2018, when he took the top spot on the list from Bill Gates. However, now all but two on the top 10 wealthiest list are centibillionaires.


Money
Charted: Who Has Savings in This Economy?
Older, better-educated adults are winning the savings game, reveals a January survey by the National Opinion Research Center at the University of Chicago.


Who Has Savings in This Economy?
This was originally posted on our Voronoi app. Download the app for free on iOS or Android and discover incredible data-driven charts from a variety of trusted sources.
Two full years of inflation have taken their toll on American households. In 2023, the country’s collective credit card debt crossed $1 trillion for the first time. So who is managing to save money in the current economic environment?
We visualize the percentage of respondents to the statement “I have money leftover at the end of the month” categorized by age and education qualifications. Data is sourced from a National Endowment for Financial Education (NEFE) report, published last month.
The survey for NEFE was conducted from January 12-14, 2024, by the National Opinion Research Center at the University of Chicago. It involved 1,222 adults aged 18+ and aimed to be representative of the U.S. population.
Older Americans Save More Than Their Younger Counterparts
General trends from this dataset indicate that as respondents get older, a higher percentage of them are able to save.
| Age | Always/Often | Sometimes | Rarely/Never |
|---|---|---|---|
| 18–29 | 29% | 33% | 38% |
| 30–44 | 36% | 27% | 37% |
| 45–59 | 39% | 23% | 38% |
| Above 60 | 49% | 28% | 23% |
| All Adults | 39% | 33% | 27% |
Note: Percentages are rounded and may not sum to 100.
Perhaps not surprisingly, those aged 60+ are the age group with the highest percentage saying they have leftover money at the end of the month. This age group spent the most time making peak earnings in their careers, are more likely to have investments, and are more likely to have paid off major expenses like a mortgage or raising a family.
The Impact of Higher Education on Earnings and Savings
Based on this survey, higher education dramatically improves one’s ability to save. Shown in the table below, those with a bachelor’s degree or higher are three times more likely to have leftover money than those without a high school diploma.
| Education | Always/Often | Sometimes | Rarely/Never |
|---|---|---|---|
| No HS Diploma | 18% | 26% | 56% |
| HS Diploma | 28% | 33% | 39% |
| Associate Degree | 33% | 31% | 36% |
| Bachelor/Higher Degree | 59% | 21% | 20% |
| All Adults | 39% | 33% | 27% |
Note: Percentages are rounded and may not sum to 100.
As the Bureau of Labor Statistics notes, earnings improve with every level of education completed.
For example, those with a high school diploma made 25% more than those without in 2022. And as the qualifications increase, the effects keep stacking.
Meanwhile, a Federal Reserve study also found that those with more education tended to make financial decisions that contributed to building wealth, of which the first step is to save.

-

 Markets1 week ago
U.S. Debt Interest Payments Reach $1 Trillion
-

 Business2 weeks ago
Charted: Big Four Market Share by S&P 500 Audits
-

 Real Estate2 weeks ago
Ranked: The Most Valuable Housing Markets in America
-

 Money2 weeks ago
Which States Have the Highest Minimum Wage in America?
-

 AI2 weeks ago
Ranked: Semiconductor Companies by Industry Revenue Share
-

 Markets2 weeks ago
Ranked: The World’s Top Flight Routes, by Revenue
-

 Demographics2 weeks ago
Population Projections: The World’s 6 Largest Countries in 2075
-

 Markets2 weeks ago
The Top 10 States by Real GDP Growth in 2023