Misc
Visualizing the Depth of the Great Lakes
View the full-resolution version of this infographic
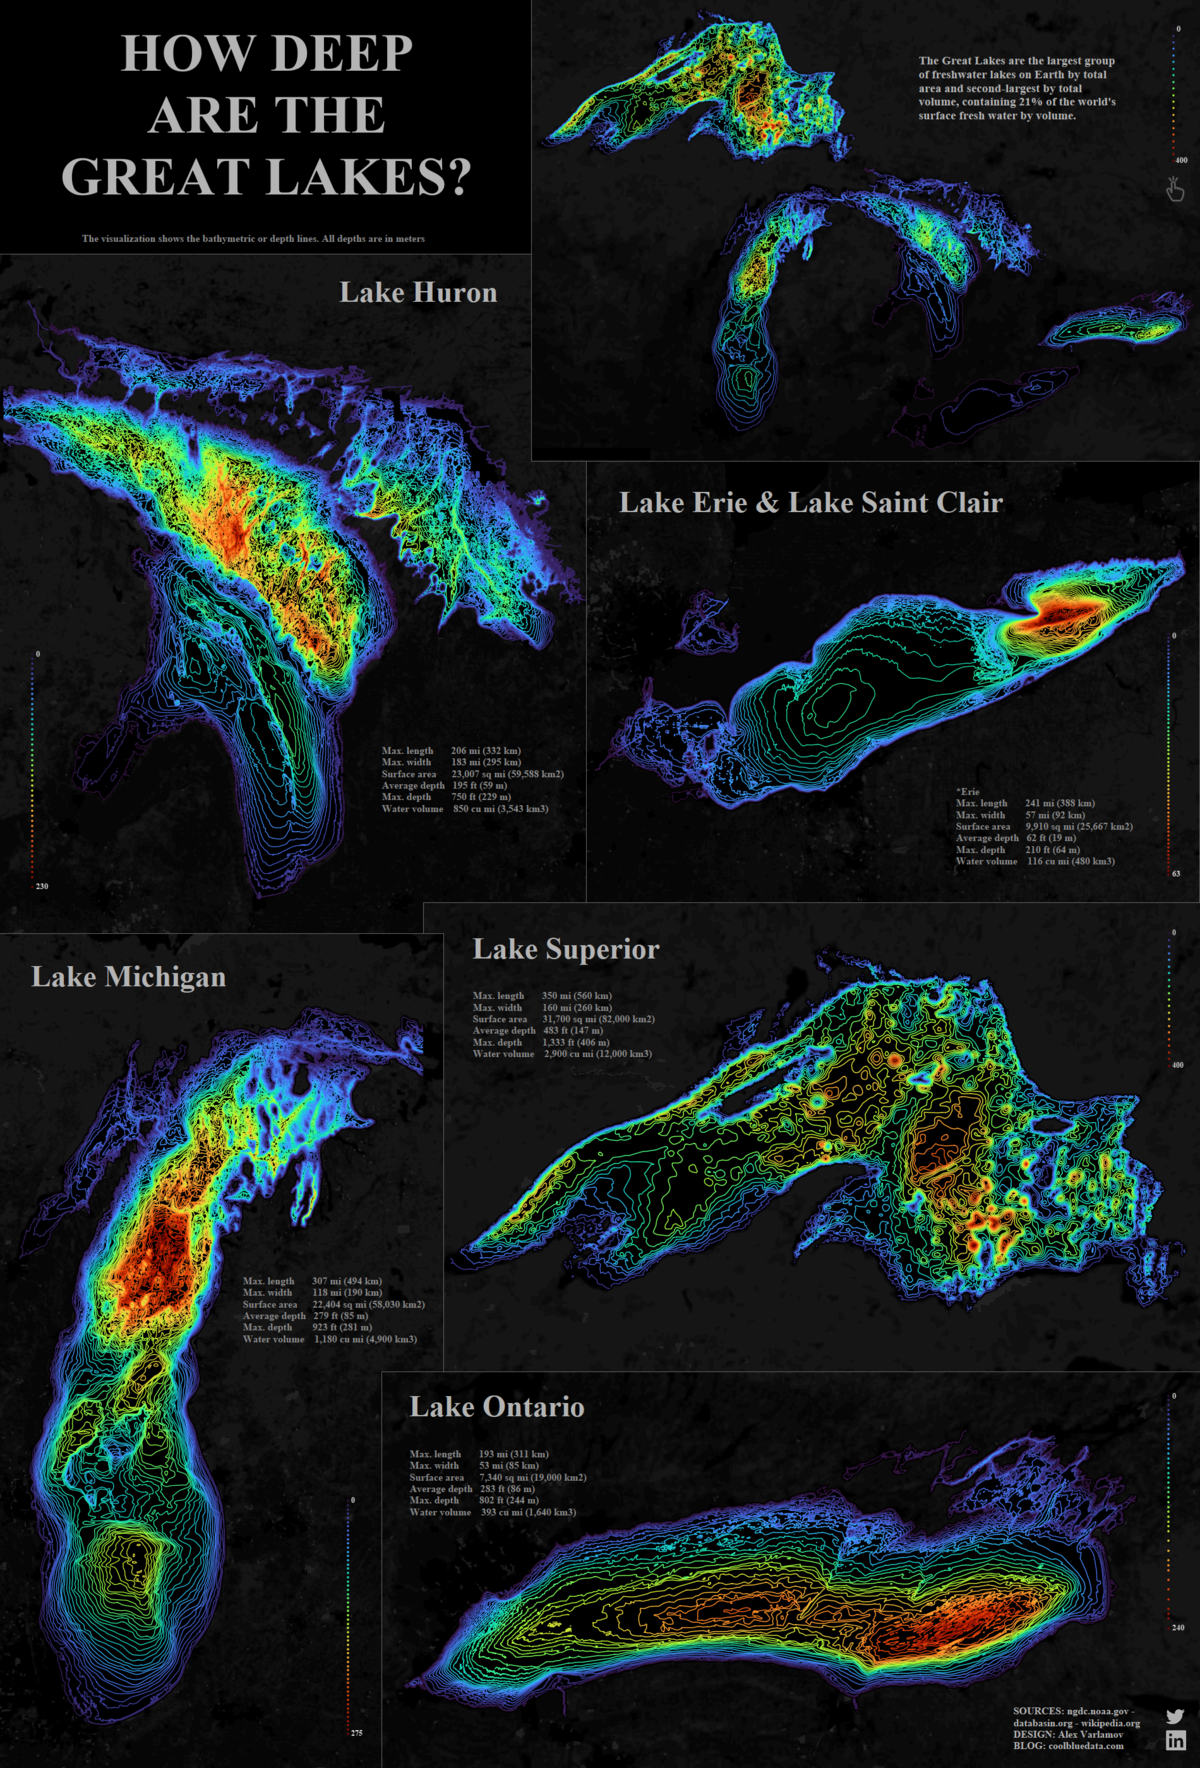
Visualized: The Depth of The Great Lakes
Click here to view the interactive version of the visualization on Tableau.
As the seasons change, it’s natural to want to enjoy the outdoors to the fullest. The Great Lakes, a distinct geographical region sandwiched between the U.S. and Canada, provides immense opportunity for millions of tourists to do just that every year.
But did you know that altogether the Great Lakes contain 21% of the world’s surface freshwater by volume—or 84% of the surface freshwater in North America?
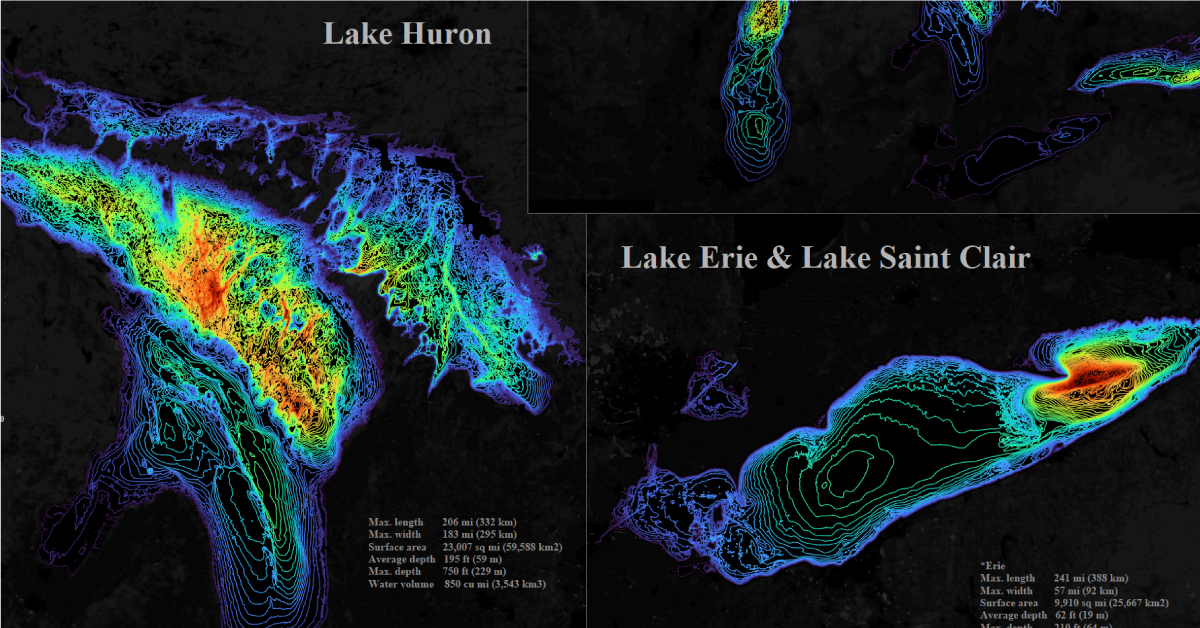
This bathymetric visualization, created by Alex Varlamov, helps put the sheer size and depth of all five of the Great Lakes into perspective.
What is Bathymetry?
Bathymetry is the study of the underwater depth of ocean or lake floors, a geographical science that falls under the wider umbrella of hydrography.
In essence, it is the underwater equivalent of topography. Contour lines help to represent and study the physical features of bodies of water, from oceans to lakes.
Most bathymetric studies are conducted via sonar systems, transmitting pulses that ‘ping’ off the ocean and lake floor, uncovering what lies below.
The Depth of the Great Lakes, Compared
High on the list of the world’s largest lakes, the five Great Lakes altogether account for over 244,700 km² (94,250 mi²) in total surface area. That’s bigger than the entire United Kingdom.
Lake Superior emerges, well, superior in terms of total surface area, water volume, and both average and maximum depth.
| Surface area | Water volume | Average depth | Maximum depth | |
|---|---|---|---|---|
| Lake Ontario | 19,000 km² (7,340 mi²) | 1,640 km³ (393 mi³) | 86 m (283 ft) | 245 m (804 ft) |
| Lake Erie | 25,700 km² (9,910 mi²) | 480 km³ (116 mi³) | 19 m (62 ft) | 64 m (210 ft) |
| Lake Michigan | 58,000 km² (22,300 mi²) | 4,900 km³ (1,180 mi³) | 85 m (279 ft) | 282 m (925 ft) |
| Lake Huron | 60,000 km² (23,000 mi²) | 3,500 km³ (850 mi³) | 59 m (195 ft) | 228 m (748 ft) |
| Lake Superior | 82,000 km² (31,700 mi²) | 12,000 km³ (2,900 mi³) | 147 m (483 ft) | 406 m (1,333 ft) |
Lake Erie is by far the shallowest of the lakes, with an average depth of just 19 meters (62 ft). That means on average, Lake Superior is about eight times deeper.
With that in mind, one drawback of the visualization is that it doesn’t provide an accurate view of how deep these lakes are in relation to one another.
For that, check out this additional visualization also created by Alex Varlamov, which is scaled to the same 20 meter step—in this view, Lake Erie practically disappears.
More than Meets the Eye
The Great Lakes are not only notable for their form, but also their function—they’re a crucial waterway contributing to the economy of the area, supporting over 50 million jobs and contributing $6 trillion to gross domestic product (GDP).
Together, the five Great Lakes feed into the Atlantic Ocean—and when we expand the scope to compare these lakes to vast oceans, trenches, and drill holes, the depth of the Great Lakes barely scratches the surface.


VC+
VC+: Get Our Key Takeaways From the IMF’s World Economic Outlook
A sneak preview of the exclusive VC+ Special Dispatch—your shortcut to understanding IMF’s World Economic Outlook report.

Have you read IMF’s latest World Economic Outlook yet? At a daunting 202 pages, we don’t blame you if it’s still on your to-do list.
But don’t worry, you don’t need to read the whole April release, because we’ve already done the hard work for you.
To save you time and effort, the Visual Capitalist team has compiled a visual analysis of everything you need to know from the report—and our upcoming VC+ Special Dispatch will be available exclusively to VC+ members on Thursday, April 25th.
If you’re not already subscribed to VC+, make sure you sign up now to receive the full analysis of the IMF report, and more (we release similar deep dives every week).
For now, here’s what VC+ members can expect to receive.
Your Shortcut to Understanding IMF’s World Economic Outlook
With long and short-term growth prospects declining for many countries around the world, this Special Dispatch offers a visual analysis of the key figures and takeaways from the IMF’s report including:
- The global decline in economic growth forecasts
- Real GDP growth and inflation forecasts for major nations in 2024
- When interest rate cuts will happen and interest rate forecasts
- How debt-to-GDP ratios have changed since 2000
- And much more!

Get the Full Breakdown in the Next VC+ Special Dispatch
VC+ members will receive the full Special Dispatch on Thursday, April 25th.
Make sure you join VC+ now to receive exclusive charts and the full analysis of key takeaways from IMF’s World Economic Outlook.
Don’t miss out. Become a VC+ member today.
What You Get When You Become a VC+ Member
VC+ is Visual Capitalist’s premium subscription. As a member, you’ll get the following:
- Special Dispatches: Deep dive visual briefings on crucial reports and global trends
- Markets This Month: A snappy summary of the state of the markets and what to look out for
- The Trendline: Weekly curation of the best visualizations from across the globe
- Global Forecast Series: Our flagship annual report that covers everything you need to know related to the economy, markets, geopolitics, and the latest tech trends
- VC+ Archive: Hundreds of previously released VC+ briefings and reports that you’ve been missing out on, all in one dedicated hub
You can get all of the above, and more, by joining VC+ today.

-

 Markets1 week ago
U.S. Debt Interest Payments Reach $1 Trillion
-

 Business2 weeks ago
Charted: Big Four Market Share by S&P 500 Audits
-

 Real Estate2 weeks ago
Ranked: The Most Valuable Housing Markets in America
-

 Money2 weeks ago
Which States Have the Highest Minimum Wage in America?
-

 AI2 weeks ago
Ranked: Semiconductor Companies by Industry Revenue Share
-

 Markets2 weeks ago
Ranked: The World’s Top Flight Routes, by Revenue
-

 Demographics2 weeks ago
Population Projections: The World’s 6 Largest Countries in 2075
-

 Markets2 weeks ago
The Top 10 States by Real GDP Growth in 2023