Markets
Top Heavy: Countries by Share of the Global Economy


Countries by Share of the Global Economy
As 2022 comes to a close we can recap many historic milestones of the year, like the Earth’s population hitting 8 billion and the global economy surpassing $100 trillion.
In this chart, we visualize the world’s GDP using data from the IMF, showcasing the biggest economies and the share of global economic activity that they make up.
The GDP Heavyweights
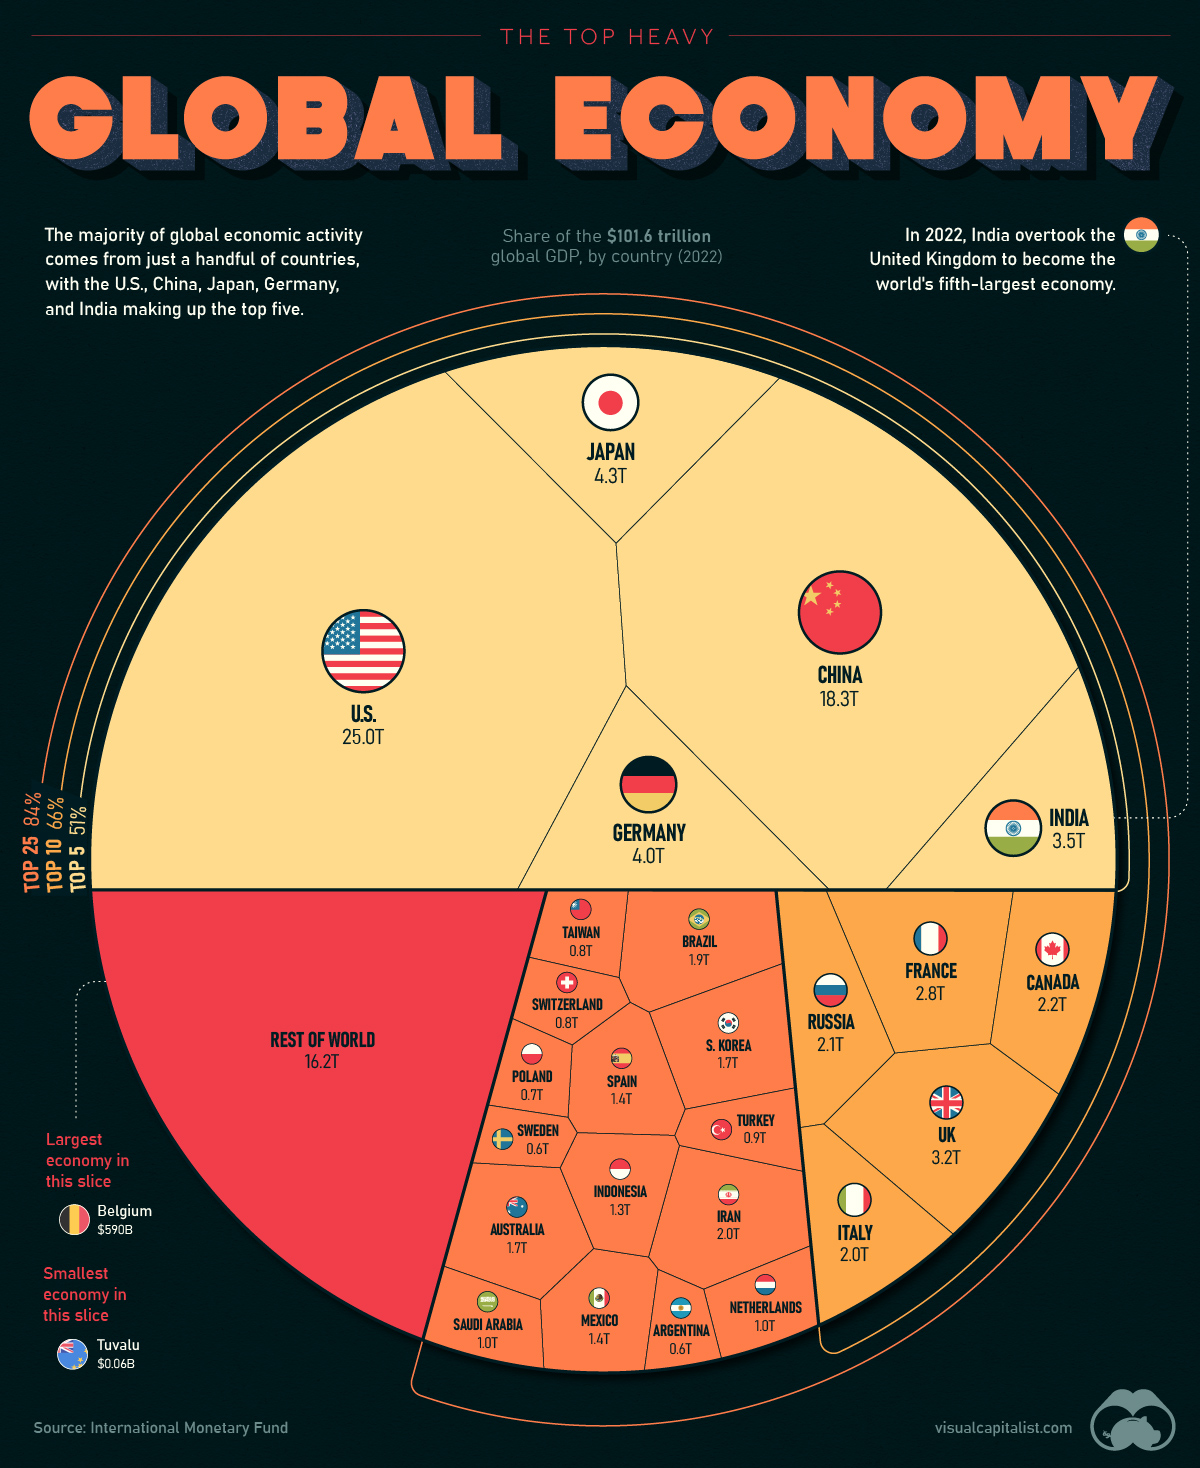
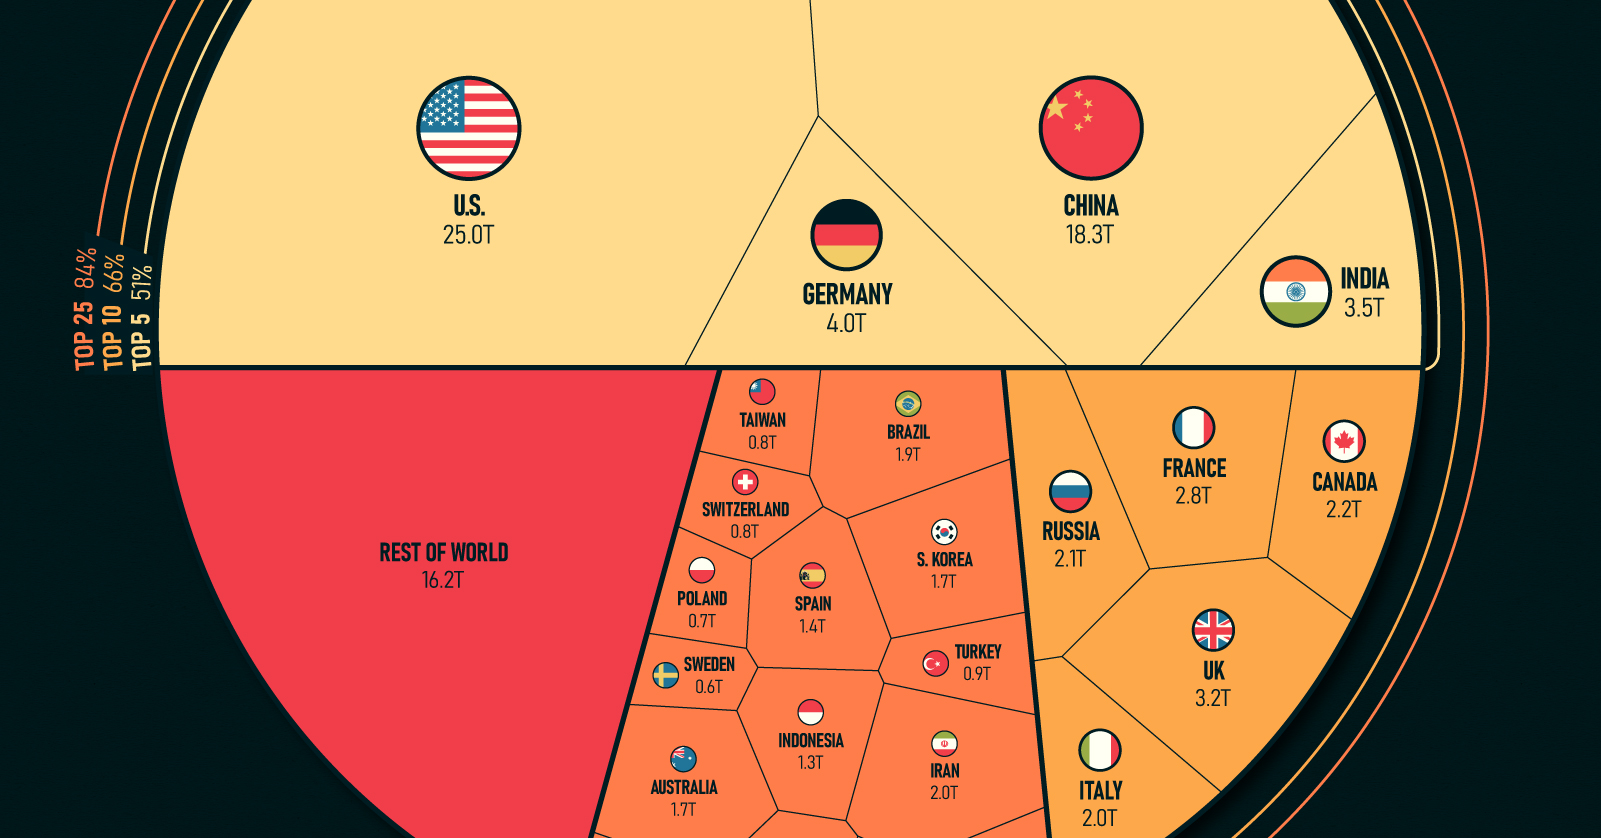
The global economy can be thought of as a pie, with the size of each slice representing the share of global GDP contributed by each country. Currently, the largest slices of the pie are held by the United States, China, Japan, Germany, and India, which together account for more than half of global GDP.
Here’s a look at every country’s share of the world’s $101.6 trillion economy:
| Rank | Country | GDP (Billions, USD) |
|---|---|---|
| #1 | 🇺🇸 United States | $25,035.2 |
| #2 | 🇨🇳 China | $18,321.2 |
| #3 | 🇯🇵 Japan | $4,300.6 |
| #4 | 🇩🇪 Germany | $4,031.1 |
| #5 | 🇮🇳 India | $3,468.6 |
| #6 | 🇬🇧 United Kingdom | $3,198.5 |
| #7 | 🇫🇷 France | $2,778.1 |
| #8 | 🇨🇦 Canada | $2,200.4 |
| #9 | 🇷🇺 Russia | $2,133.1 |
| #10 | 🇮🇹 Italy | $1,997.0 |
| #11 | 🇮🇷 Iran | $1,973.7 |
| #12 | 🇧🇷 Brazil | $1,894.7 |
| #13 | 🇰🇷 South Korea | $1,734.2 |
| #14 | 🇦🇺 Australia | $1,724.8 |
| #15 | 🇲🇽 Mexico | $1,424.5 |
| #16 | 🇪🇸 Spain | $1,389.9 |
| #17 | 🇮🇩 Indonesia | $1,289.4 |
| #18 | 🇸🇦 Saudi Arabia | $1,010.6 |
| #19 | 🇳🇱 Netherlands | $990.6 |
| #20 | 🇹🇷 Turkey | $853.5 |
| #21 | 🇹🇼 Taiwan | $828.7 |
| #22 | 🇨🇭 Switzerland | $807.4 |
| #23 | 🇵🇱 Poland | $716.3 |
| #24 | 🇦🇷 Argentina | $630.7 |
| #25 | 🇸🇪 Sweden | $603.9 |
| #26 | 🇧🇪 Belgium | $589.5 |
| #27 | 🇹🇭 Thailand | $534.8 |
| #28 | 🇮🇱 Israel | $527.2 |
| #29 | 🇮🇪 Ireland | $519.8 |
| #30 | 🇳🇴 Norway | $504.7 |
| #31 | 🇳🇬 Nigeria | $504.2 |
| #32 | 🇦🇪 United Arab Emirates | $503.9 |
| #33 | 🇪🇬 Egypt | $469.1 |
| #34 | 🇦🇹 Austria | $468.0 |
| #35 | 🇧🇩 Bangladesh | $460.8 |
| #36 | 🇲🇾 Malaysia | $434.1 |
| #37 | 🇸🇬 Singapore | $423.6 |
| #38 | 🇻🇳 Vietnam | $413.8 |
| #39 | 🇿🇦 South Africa | $411.5 |
| #40 | 🇵🇭 Philippines | $401.7 |
| #41 | 🇩🇰 Denmark | $386.7 |
| #42 | 🇵🇰 Pakistan | $376.5 |
| #43 | 🇭🇰 Hong Kong SAR | $368.4 |
| #44 | 🇨🇴 Colombia | $342.9 |
| #45 | 🇨🇱 Chile | $310.9 |
| #46 | 🇷🇴 Romania | $299.9 |
| #47 | 🇨🇿 Czech Republic | $295.6 |
| #48 | 🇮🇶 Iraq | $282.9 |
| #49 | 🇫🇮 Finland | $281.4 |
| #50 | 🇵🇹 Portugal | $255.9 |
| #51 | 🇳🇿 New Zealand | $242.7 |
| #52 | 🇵🇪 Peru | $239.3 |
| #53 | 🇰🇿 Kazakhstan | $224.3 |
| #54 | 🇬🇷 Greece | $222.0 |
| #55 | 🇶🇦 Qatar | $221.4 |
| #56 | 🇩🇿 Algeria | $187.2 |
| #57 | 🇭🇺 Hungary | $184.7 |
| #58 | 🇰🇼 Kuwait | $183.6 |
| #59 | 🇲🇦 Morocco | $142.9 |
| #60 | 🇦🇴 Angola | $124.8 |
| #61 | 🇵🇷 Puerto Rico | $118.7 |
| #62 | 🇪🇨 Ecuador | $115.5 |
| #63 | 🇰🇪 Kenya | $114.9 |
| #64 | 🇸🇰 Slovakia | $112.4 |
| #65 | 🇩🇴 Dominican Republic | $112.4 |
| #66 | 🇪🇹 Ethiopia | $111.2 |
| #67 | 🇴🇲 Oman | $109.0 |
| #68 | 🇬🇹 Guatemala | $91.3 |
| #69 | 🇧🇬 Bulgaria | $85.0 |
| #70 | 🇱🇺 Luxembourg | $82.2 |
| #71 | 🇻🇪 Venezuela | $82.1 |
| #72 | 🇧🇾 Belarus | $79.7 |
| #73 | 🇺🇿 Uzbekistan | $79.1 |
| #74 | 🇹🇿 Tanzania | $76.6 |
| #75 | 🇬🇭 Ghana | $76.0 |
| #76 | 🇹🇲 Turkmenistan | $74.4 |
| #77 | 🇱🇰 Sri Lanka | $73.7 |
| #78 | 🇺🇾 Uruguay | $71.2 |
| #79 | 🇵🇦 Panama | $71.1 |
| #80 | 🇦🇿 Azerbaijan | $70.1 |
| #81 | 🇭🇷 Croatia | $69.4 |
| #82 | 🇨🇮 Côte d'Ivoire | $68.6 |
| #83 | 🇨🇷 Costa Rica | $68.5 |
| #84 | 🇱🇹 Lithuania | $68.0 |
| #85 | 🇨🇩 Democratic Republic of the Congo | $63.9 |
| #86 | 🇷🇸 Serbia | $62.7 |
| #87 | 🇸🇮 Slovenia | $62.2 |
| #88 | 🇲🇲 Myanmar | $59.5 |
| #89 | 🇺🇬 Uganda | $48.4 |
| #90 | 🇯🇴 Jordan | $48.1 |
| #91 | 🇹🇳 Tunisia | $46.3 |
| #92 | 🇨🇲 Cameroon | $44.2 |
| #93 | 🇧🇭 Bahrain | $43.5 |
| #94 | 🇧🇴 Bolivia | $43.4 |
| #95 | 🇸🇩 Sudan | $42.8 |
| #96 | 🇵🇾 Paraguay | $41.9 |
| #97 | 🇱🇾 Libya | $40.8 |
| #98 | 🇱🇻 Latvia | $40.6 |
| #99 | 🇪🇪 Estonia | $39.1 |
| #100 | 🇳🇵 Nepal | $39.0 |
| #101 | 🇿🇼 Zimbabwe | $38.3 |
| #102 | 🇸🇻 El Salvador | $32.0 |
| #103 | 🇵🇬 Papua New Guinea | $31.4 |
| #104 | 🇭🇳 Honduras | $30.6 |
| #105 | 🇹🇹 Trinidad and Tobago | $29.3 |
| #106 | 🇰🇭 Cambodia | $28.3 |
| #107 | 🇮🇸 Iceland | $27.7 |
| #108 | 🇾🇪 Yemen | $27.6 |
| #109 | 🇸🇳 Senegal | $27.5 |
| #110 | 🇿🇲 Zambia | $27.0 |
| #111 | 🇨🇾 Cyprus | $26.7 |
| #112 | 🇬🇪 Georgia | $25.2 |
| #113 | 🇧🇦 Bosnia and Herzegovina | $23.7 |
| #114 | 🇲🇴 Macao SAR | $23.4 |
| #115 | 🇬🇦 Gabon | $22.2 |
| #116 | 🇭🇹 Haiti | $20.2 |
| #117 | 🇬🇳 Guinea | $19.7 |
| #118 | West Bank and Gaza | $18.8 |
| #119 | 🇧🇳 Brunei | $18.5 |
| #120 | 🇲🇱 Mali | $18.4 |
| #121 | 🇧🇫 Burkina Faso | $18.3 |
| #122 | 🇦🇱 Albania | $18.3 |
| #123 | 🇧🇼 Botswana | $18.0 |
| #124 | 🇲🇿 Mozambique | $17.9 |
| #125 | 🇦🇲 Armenia | $17.7 |
| #126 | 🇧🇯 Benin | $17.5 |
| #127 | 🇲🇹 Malta | $17.2 |
| #128 | 🇬🇶 Equatorial Guinea | $16.9 |
| #129 | 🇱🇦 Laos | $16.3 |
| #130 | 🇯🇲 Jamaica | $16.1 |
| #131 | 🇲🇳 Mongolia | $15.7 |
| #132 | 🇳🇮 Nicaragua | $15.7 |
| #133 | 🇲🇬 Madagascar | $15.1 |
| #134 | 🇬🇾 Guyana | $14.8 |
| #135 | 🇳🇪 Niger | $14.6 |
| #136 | 🇨🇬 Republic of Congo | $14.5 |
| #137 | 🇲🇰 North Macedonia | $14.1 |
| #138 | 🇲🇩 Moldova | $14.0 |
| #139 | 🇹🇩 Chad | $12.9 |
| #140 | 🇧🇸 The Bahamas | $12.7 |
| #141 | 🇳🇦 Namibia | $12.5 |
| #142 | 🇷🇼 Rwanda | $12.1 |
| #143 | 🇲🇼 Malawi | $11.6 |
| #144 | 🇲🇺 Mauritius | $11.5 |
| #145 | 🇲🇷 Mauritania | $10.1 |
| #146 | 🇹🇯 Tajikistan | $10.0 |
| #147 | 🇰🇬 Kyrgyzstan | $9.8 |
| #148 | 🇽🇰 Kosovo | $9.2 |
| #149 | 🇸🇴 Somalia | $8.4 |
| #150 | 🇹🇬 Togo | $8.4 |
| #151 | 🇲🇪 Montenegro | $6.1 |
| #152 | 🇲🇻 Maldives | $5.9 |
| #153 | 🇧🇧 Barbados | $5.8 |
| #154 | 🇫🇯 Fiji | $4.9 |
| #155 | 🇸🇸 South Sudan | $4.8 |
| #156 | 🇸🇿 Eswatini | $4.7 |
| #157 | 🇸🇱 Sierra Leone | $4.1 |
| #158 | 🇱🇷 Liberia | $3.9 |
| #159 | 🇩🇯 Djibouti | $3.7 |
| #160 | 🇧🇮 Burundi | $3.7 |
| #161 | 🇦🇼 Aruba | $3.5 |
| #162 | 🇦🇩 Andorra | $3.3 |
| #163 | 🇸🇷 Suriname | $3.0 |
| #164 | 🇧🇹 Bhutan | $2.7 |
| #165 | 🇧🇿 Belize | $2.7 |
| #166 | 🇱🇸 Lesotho | $2.5 |
| #167 | 🇨🇫 Central African Republic | $2.5 |
| #168 | 🇹🇱 Timor-Leste | $2.4 |
| #169 | 🇪🇷 Eritrea | $2.4 |
| #170 | 🇬🇲 The Gambia | $2.1 |
| #171 | 🇨🇻 Cabo Verde | $2.1 |
| #172 | 🇸🇨 Seychelles | $2.0 |
| #173 | 🇱🇨 St. Lucia | $2.0 |
| #174 | 🇦🇬 Antigua and Barbuda | $1.7 |
| #175 | 🇬🇼 Guinea-Bissau | $1.6 |
| #176 | 🇸🇲 San Marino | $1.6 |
| #177 | 🇸🇧 Solomon Islands | $1.6 |
| #178 | 🇰🇲 Comoros | $1.2 |
| #179 | 🇬🇩 Grenada | $1.2 |
| #180 | 🇰🇳 St. Kitts and Nevis | $1.1 |
| #181 | 🇻🇺 Vanuatu | $1.0 |
| #182 | 🇻🇨 St. Vincent and the Grenadines | $1.0 |
| #183 | 🇼🇸 Samoa | $0.83 |
| #184 | 🇩🇲 Dominica | $0.60 |
| #185 | 🇸🇹 São Tomé and Príncipe | $0.51 |
| #186 | 🇹🇴 Tonga | $0.50 |
| #187 | 🇫🇲 Micronesia | $0.43 |
| #188 | 🇲🇭 Marshall Islands | $0.27 |
| #189 | 🇵🇼 Palau | $0.23 |
| #190 | 🇰🇮 Kiribati | $0.21 |
| #191 | 🇳🇷 Nauru | $0.13 |
| #192 | 🇹🇻 Tuvalu | $0.06 |
| #193 | 🇺🇦 Ukraine | Data not available |
| Total World GDP | $101,559.3 |
Just five countries make up more than half of the world’s entire GDP in 2022: the U.S., China, Japan, India, and Germany. Interestingly, India replaced the UK this year as a top five economy.
Adding on another five countries (the top 10) makes up 66% of the global economy, and the top 25 countries comprise 84% of global GDP.
The World’s Smallest Economies
The rest of the world — the remaining 167 nations — make up 16% of global GDP. Many of the smallest economies are islands located in Oceania.
Here’s a look at the 20 smallest economies in the world:
| Country | GDP (Billions, USD) |
|---|---|
| 🇹🇻 Tuvalu | $0.06 |
| 🇳🇷 Nauru | $0.13 |
| 🇰🇮 Kiribati | $0.21 |
| 🇵🇼 Palau | $0.23 |
| 🇲🇭 Marshall Islands | $0.27 |
| 🇫🇲 Micronesia | $0.43 |
| 🇹🇴 Tonga | $0.50 |
| 🇸🇹 São Tomé and Príncipe | $0.51 |
| 🇩🇲 Dominica | $0.60 |
| 🇼🇸 Samoa | $0.83 |
| 🇻🇨 St. Vincent and the Grenadines | $0.95 |
| 🇻🇺 Vanuatu | $0.98 |
| 🇰🇳 St. Kitts and Nevis | $1.12 |
| 🇬🇩 Grenada | $1.19 |
| 🇰🇲 Comoros | $1.24 |
| 🇸🇧 Solomon Islands | $1.60 |
| 🇸🇲 San Marino | $1.62 |
| 🇬🇼 Guinea-Bissau | $1.62 |
| 🇦🇬 Antigua and Barbuda | $1.69 |
| 🇱🇨 St. Lucia | $1.97 |
Tuvalu has the smallest GDP of any country at just $64 million. Tuvalu is one of a dozen nations with a GDP of less than one billion dollars.
The Global Economy in 2023
Heading into 2023, there is much economic uncertainty. Many experts are anticipating a brief recession, although opinions differ on the definition of “brief”.
Some experts believe that China will buck the trend of economic downturn. If this prediction comes true, the country could own an even larger slice of the global GDP pie in the near future.
See what hundreds of experts are predicting for 2023 with our Global Forecast Series.
Where does this data come from?
Source: IMF (International Monetary Fund)
Data note: Due to conflict and other issues, some countries are not included in this data set (e.g. Ukraine, Syria, Afghanistan). Major sources for GDP data differ widely on the size of Iran’s economy. It’s worth noting that this data from IMF ranks Iran’s GDP much higher than World Bank or the UN.


Markets
The European Stock Market: Attractive Valuations Offer Opportunities
On average, the European stock market has valuations that are nearly 50% lower than U.S. valuations. But how can you access the market?


European Stock Market: Attractive Valuations Offer Opportunities
Europe is known for some established brands, from L’Oréal to Louis Vuitton. However, the European stock market offers additional opportunities that may be lesser known.
The above infographic, sponsored by STOXX, outlines why investors may want to consider European stocks.
Attractive Valuations
Compared to most North American and Asian markets, European stocks offer lower or comparable valuations.
| Index | Price-to-Earnings Ratio | Price-to-Book Ratio |
|---|---|---|
| EURO STOXX 50 | 14.9 | 2.2 |
| STOXX Europe 600 | 14.4 | 2 |
| U.S. | 25.9 | 4.7 |
| Canada | 16.1 | 1.8 |
| Japan | 15.4 | 1.6 |
| Asia Pacific ex. China | 17.1 | 1.8 |
Data as of February 29, 2024. See graphic for full index names. Ratios based on trailing 12 month financials. The price to earnings ratio excludes companies with negative earnings.
On average, European valuations are nearly 50% lower than U.S. valuations, potentially offering an affordable entry point for investors.
Research also shows that lower price ratios have historically led to higher long-term returns.
Market Movements Not Closely Connected
Over the last decade, the European stock market had low-to-moderate correlation with North American and Asian equities.
The below chart shows correlations from February 2014 to February 2024. A value closer to zero indicates low correlation, while a value of one would indicate that two regions are moving in perfect unison.
| EURO STOXX 50 | STOXX EUROPE 600 | U.S. | Canada | Japan | Asia Pacific ex. China |
|
|---|---|---|---|---|---|---|
| EURO STOXX 50 | 1.00 | 0.97 | 0.55 | 0.67 | 0.24 | 0.43 |
| STOXX EUROPE 600 | 1.00 | 0.56 | 0.71 | 0.28 | 0.48 | |
| U.S. | 1.00 | 0.73 | 0.12 | 0.25 | ||
| Canada | 1.00 | 0.22 | 0.40 | |||
| Japan | 1.00 | 0.88 | ||||
| Asia Pacific ex. China | 1.00 |
Data is based on daily USD returns.
European equities had relatively independent market movements from North American and Asian markets. One contributing factor could be the differing sector weights in each market. For instance, technology makes up a quarter of the U.S. market, but health care and industrials dominate the broader European market.
Ultimately, European equities can enhance portfolio diversification and have the potential to mitigate risk for investors.
Tracking the Market
For investors interested in European equities, STOXX offers a variety of flagship indices:
| Index | Description | Market Cap |
|---|---|---|
| STOXX Europe 600 | Pan-regional, broad market | €10.5T |
| STOXX Developed Europe | Pan-regional, broad-market | €9.9T |
| STOXX Europe 600 ESG-X | Pan-regional, broad market, sustainability focus | €9.7T |
| STOXX Europe 50 | Pan-regional, blue-chip | €5.1T |
| EURO STOXX 50 | Eurozone, blue-chip | €3.5T |
Data is as of February 29, 2024. Market cap is free float, which represents the shares that are readily available for public trading on stock exchanges.
The EURO STOXX 50 tracks the Eurozone’s biggest and most traded companies. It also underlies one of the world’s largest ranges of ETFs and mutual funds. As of November 2023, there were €27.3 billion in ETFs and €23.5B in mutual fund assets under management tracking the index.
“For the past 25 years, the EURO STOXX 50 has served as an accurate, reliable and tradable representation of the Eurozone equity market.”
— Axel Lomholt, General Manager at STOXX
Partnering with STOXX to Track the European Stock Market
Are you interested in European equities? STOXX can be a valuable partner:
- Comprehensive, liquid and investable ecosystem
- European heritage, global reach
- Highly sophisticated customization capabilities
- Open architecture approach to using data
- Close partnerships with clients
- Part of ISS STOXX and Deutsche Börse Group
With a full suite of indices, STOXX can help you benchmark against the European stock market.
Learn how STOXX’s European indices offer liquid and effective market access.

-

 Economy1 day ago
Economic Growth Forecasts for G7 and BRICS Countries in 2024
The IMF has released its economic growth forecasts for 2024. How do the G7 and BRICS countries compare?
-

 Markets1 week ago
U.S. Debt Interest Payments Reach $1 Trillion
U.S. debt interest payments have surged past the $1 trillion dollar mark, amid high interest rates and an ever-expanding debt burden.
-

 United States1 week ago
Ranked: The Largest U.S. Corporations by Number of Employees
We visualized the top U.S. companies by employees, revealing the massive scale of retailers like Walmart, Target, and Home Depot.
-

 Markets2 weeks ago
The Top 10 States by Real GDP Growth in 2023
This graphic shows the states with the highest real GDP growth rate in 2023, largely propelled by the oil and gas boom.
-

 Markets2 weeks ago
Ranked: The World’s Top Flight Routes, by Revenue
In this graphic, we show the highest earning flight routes globally as air travel continued to rebound in 2023.
-

 Markets2 weeks ago
Ranked: The Most Valuable Housing Markets in America
The U.S. residential real estate market is worth a staggering $47.5 trillion. Here are the most valuable housing markets in the country.

-

 Mining1 week ago
Gold vs. S&P 500: Which Has Grown More Over Five Years?
-
Markets2 weeks ago
Ranked: The Most Valuable Housing Markets in America
-

 Money2 weeks ago
Which States Have the Highest Minimum Wage in America?
-

 AI2 weeks ago
Ranked: Semiconductor Companies by Industry Revenue Share
-
Markets2 weeks ago
Ranked: The World’s Top Flight Routes, by Revenue
-

 Demographics2 weeks ago
Population Projections: The World’s 6 Largest Countries in 2075
-
Markets2 weeks ago
The Top 10 States by Real GDP Growth in 2023
-

 Demographics2 weeks ago
The Smallest Gender Wage Gaps in OECD Countries