Politics
Which Countries are the Most Polarized?


Which Countries are the Most Polarized?
How do you measure something that’s made headlines for half a decade but is still difficult to quantify? We’re talking about polarization.
Even within the social sciences, polarization covers everything from racial segregation, to labor skill levels, to class divide, to political ideology.
How Do You Quantify Polarization?
Edelman’s data on which countries are the most polarized comes from survey results asking respondents two very simple questions:
- How divided is their country?
- How entrenched is the divide?
The questions help bring to light the social issues a particular country is facing and the lack of consensus on those issues.
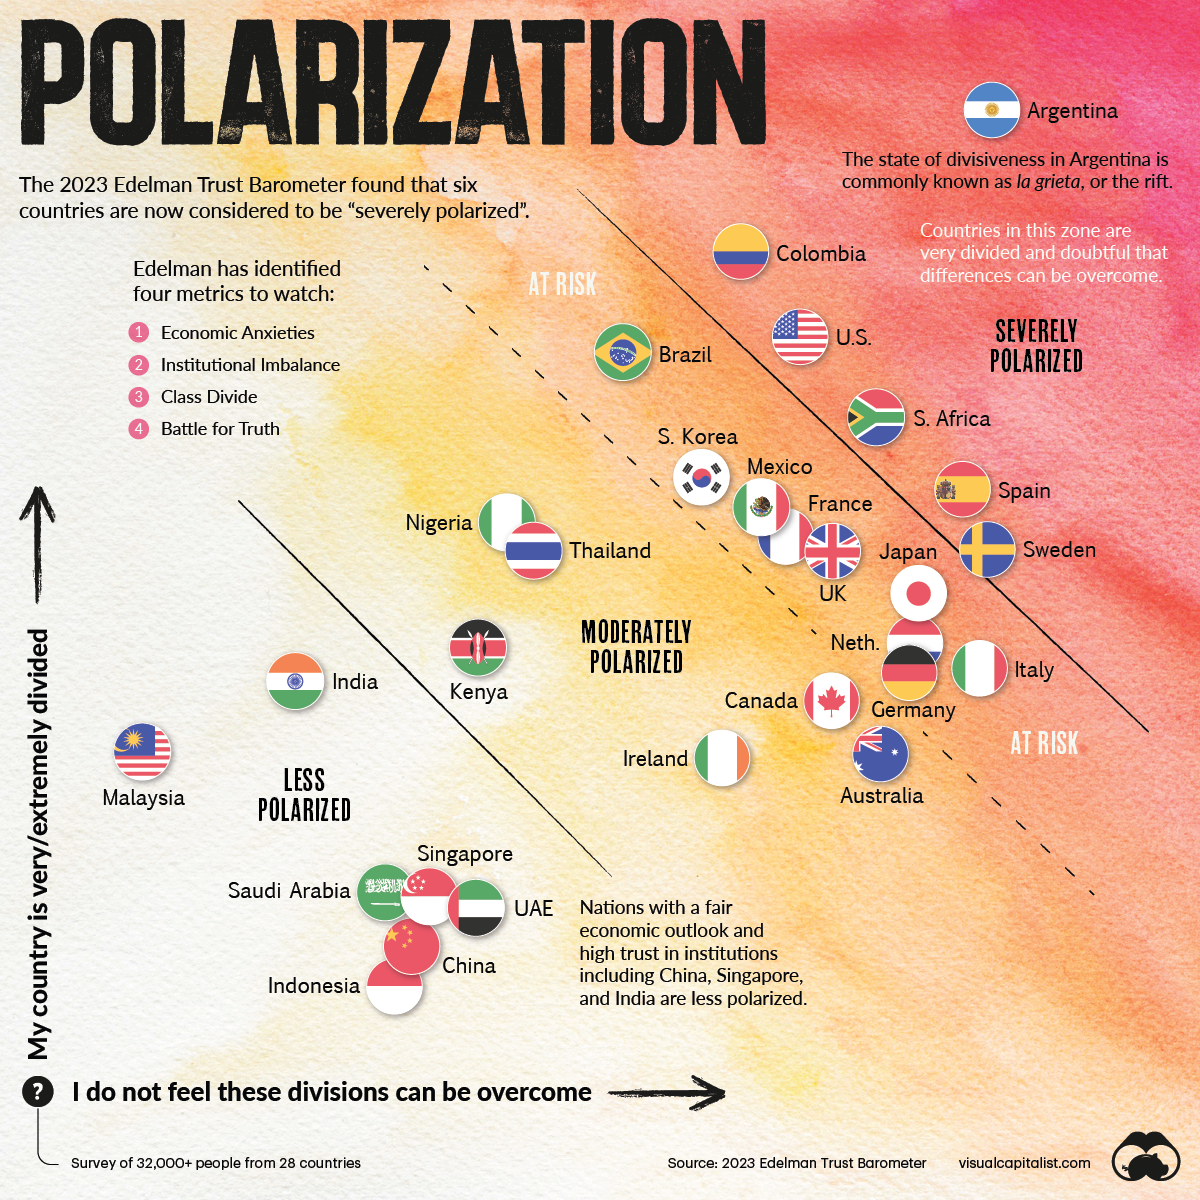
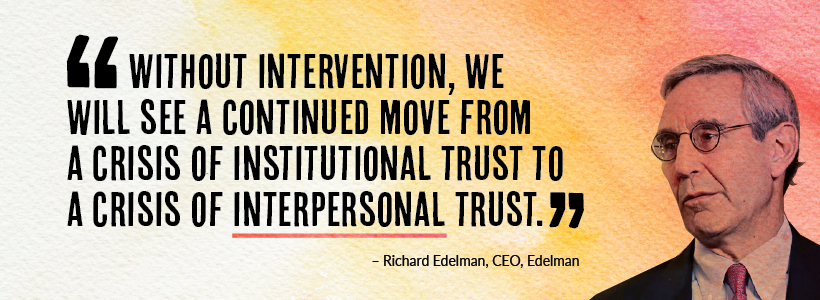
Plotted against each other, a chart emerges. A country in the top–right corner of the chart is “severely polarized.” Countries located closer to the lower–left are considered less polarized.
In the report, Edelman identifies four metrics to watch for and measure which help quantify polarization.
| Economic Anxieties | Will my family be better off in five years? |
| Institutional Imbalance | Government is viewed as unethical and incompetent. |
| Class Divide | People with higher incomes have a higher trust in institutions. |
| Battle for Truth | Echo chambers, and a low trust in media. |
Following Edelman’s metrics, countries with economic uncertainty and inequality as well as institutional distrust are more likely to be polarized. Below, we look at key highlights from the chart.
Severely Polarized Countries
Despite being one of the largest economies in Latin America, Argentina is the most polarized country surveyed by a large margin. Foreign loan defaults, a high fiscal deficit, and now surging inflation have created a perfect storm in the country.
43% of the Argentinian respondents said they will be better off in five years, down 17 percentage points from last year.
Along with fiscal upheaval, Argentinians are also dealing with enduring corruption in the public sector and abrupt policy reversals between governments. Only 20% of those surveyed in Argentina said they trusted the government—the least of all surveyed countries.
Here are all six of the countries considered to be severely polarized:
-
🇦🇷 Argentina
🇨🇴 Colombia
🇺🇸 United States
🇿🇦 South Africa
🇪🇸 Spain
🇸🇪 Sweden
In the U.S., heightened political upheaval between Democrats and Republicans over the last few years has led to strengthening ideological stances and to an abundance of headlines about polarization. Only 42% of respondents in the country trust the government.
And in South Africa, persistent inequality and falling trust in the African National Congress also check off Edelman’s metrics. It’s also second after Argentina with the least trust in government (22%) per the survey.
Moderately Polarized Countries
The biggest cluster of 15 countries are in moderately polarized section of the chart, with all continents represented.
-
🇧🇷 Brazil
🇰🇷 South Korea
🇲🇽 Mexico
🇫🇷 France
🇬🇧 United Kingdom
🇯🇵 Japan
🇳🇱 Netherlands
🇮🇹 Italy
🇩🇪 Germany
🇳🇬 Nigeria
🇹🇭 Thailand
🇰🇪 Kenya
🇨🇦 Canada
🇦🇺 Australia
🇮🇪 Ireland
Some are on the cusp of being severely polarized, including economic heavyweights like Japan, the UK, France, and Germany. On the other hand, smaller economies like Thailand, Kenya, and Nigeria, are doing comparatively better on the polarization chart.
Less Polarized Countries
Countries with fair economic outlook and high trust in institutions including China, Singapore, and India are in the bottom left sector of the chart.
-
🇮🇩 Indonesia
🇨🇳 China
🇦🇪 United Arab Emirates
🇸🇬 Singapore
🇸🇦 Saudi Arabia
🇲🇾 Malaysia
🇮🇳 India
It’s interesting to note that of the seven countries in that sector, three are not democracies. That said, there are also more developing countries on this list as well, which could also be a factor.
Looking Ahead
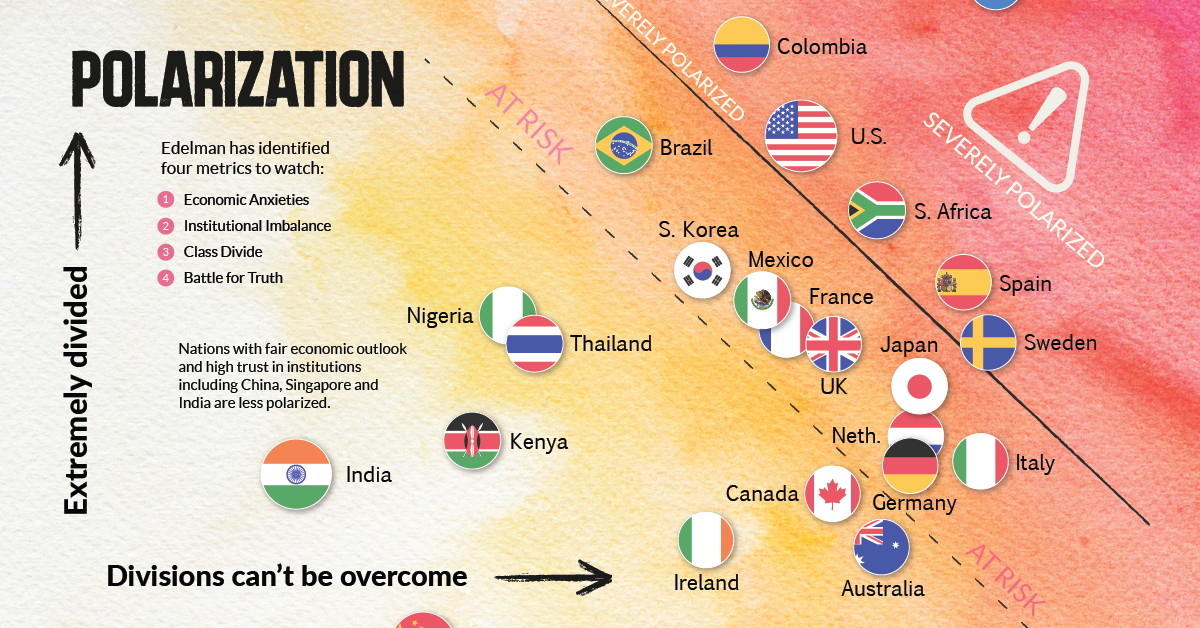
Edelman notes that polarization is both “cause and consequence of distrust,” creating a self-fulfilling cycle. Aside from the four metrics stated above, concerns about the erosion of civility and weakening social fabric also lead to polarization.
As global events unfold in 2023—including looming worries of a recession—it will be fascinating to see how countries might switch positions in the year to come.
Where does this data come from?
Source: The 2023 Edelman Trust Barometer
Data note: Survey conducted: Nov 1 – Nov 28, 2022. Survey included 32,000+ respondents in 28 countries. Russia was omitted from this year’s survey. See page 2 of the report for more details.


Economy
The Bloc Effect: International Trade with Geopolitical Allies on the Rise
Rising geopolitical tensions are shaping the future of international trade, but what is the effect on trading among G7 and BRICS countries?


The Bloc Effect: International Trade with Allies on the Rise
International trade has become increasingly fragmented over the last five years as countries have shifted to trading more with their geopolitical allies.
This graphic from The Hinrich Foundation, the first in a three-part series covering the future of trade, provides visual context to the growing divide in trade in G7 and pre-expansion BRICS countries, which are used as proxies for geopolitical blocs.
Trade Shifts in G7 and BRICS Countries
This analysis uses IMF data to examine differences in shares of exports within and between trading blocs from 2018 to 2023. For example, we looked at the percentage of China’s exports with other BRICS members as well as with G7 members to see how these proportions shifted in percentage points (pp) over time.
Countries traded nearly $270 billion more with allies in 2023 compared to 2018. This shift came at the expense of trade with rival blocs, which saw a decline of $314 billion.
Country Change in Exports Within Bloc (pp) Change in Exports With Other Bloc (pp)
🇮🇳 India 0.0 3.9
🇷🇺 Russia 0.7 -3.8
🇮🇹 Italy 0.8 -0.7
🇨🇦 Canada 0.9 -0.7
🇫🇷 France 1.0 -1.1
🇪🇺 EU 1.1 -1.5
🇩🇪 Germany 1.4 -2.1
🇿🇦 South Africa 1.5 1.5
🇺🇸 U.S. 1.6 -0.4
🇯🇵 Japan 2.0 -1.7
🇨🇳 China 2.1 -5.2
🇧🇷 Brazil 3.7 -3.3
🇬🇧 UK 10.2 0.5
All shifts reported are in percentage points. For example, the EU saw its share of exports to G7 countries rise from 74.3% in 2018 to 75.4% in 2023, which equates to a 1.1 percentage point increase.
The UK saw the largest uptick in trading with other countries within the G7 (+10.2 percentage points), namely the EU, as the post-Brexit trade slump to the region recovered.
Meanwhile, the U.S.-China trade dispute caused China’s share of exports to the G7 to fall by 5.2 percentage points from 2018 to 2023, the largest decline in our sample set. In fact, partly as a result of the conflict, the U.S. has by far the highest number of harmful tariffs in place.
The Russia-Ukraine War and ensuing sanctions by the West contributed to Russia’s share of exports to the G7 falling by 3.8 percentage points over the same timeframe.
India, South Africa, and the UK bucked the trend and continued to witness advances in exports with the opposing bloc.
Average Trade Shifts of G7 and BRICS Blocs
Though results varied significantly on a country-by-country basis, the broader trend towards favoring geopolitical allies in international trade is clear.
Bloc Change in Exports Within Bloc (pp) Change in Exports With Other Bloc (pp)
Average 2.1 -1.1
BRICS 1.6 -1.4
G7 incl. EU 2.4 -1.0
Overall, BRICS countries saw a larger shift away from exports with the other bloc, while for G7 countries the shift within their own bloc was more pronounced. This implies that though BRICS countries are trading less with the G7, they are relying more on trade partners outside their bloc to make up for the lost G7 share.
A Global Shift in International Trade and Geopolitical Proximity
The movement towards strengthening trade relations based on geopolitical proximity is a global trend.
The United Nations categorizes countries along a scale of geopolitical proximity based on UN voting records.
According to the organization’s analysis, international trade between geopolitically close countries rose from the first quarter of 2022 (when Russia first invaded Ukraine) to the third quarter of 2023 by over 6%. Conversely, trade with geopolitically distant countries declined.
The second piece in this series will explore China’s gradual move away from using the U.S. dollar in trade settlements.
Visit the Hinrich Foundation to learn more about the future of geopolitical trade

-

 Economy3 hours ago
Economic Growth Forecasts for G7 and BRICS Countries in 2024
The IMF has released its economic growth forecasts for 2024. How do the G7 and BRICS countries compare?
-

 United States1 week ago
Ranked: The Largest U.S. Corporations by Number of Employees
We visualized the top U.S. companies by employees, revealing the massive scale of retailers like Walmart, Target, and Home Depot.
-

 Economy2 weeks ago
Where U.S. Inflation Hit the Hardest in March 2024
We visualized product categories that saw the highest % increase in price due to U.S. inflation as of March 2024.
-

 Economy4 weeks ago
G20 Inflation Rates: Feb 2024 vs COVID Peak
We visualize inflation rates across G20 countries as of Feb 2024, in the context of their COVID-19 pandemic peak.
-

 Economy1 month ago
Mapped: Unemployment Claims by State
This visual heatmap of unemployment claims by state highlights New York, California, and Alaska leading the country by a wide margin.
-

 Economy2 months ago
Confidence in the Global Economy, by Country
Will the global economy be stronger in 2024 than in 2023?


-

 Markets1 week ago
U.S. Debt Interest Payments Reach $1 Trillion
-

 Business2 weeks ago
Charted: Big Four Market Share by S&P 500 Audits
-

 Real Estate2 weeks ago
Ranked: The Most Valuable Housing Markets in America
-

 Money2 weeks ago
Which States Have the Highest Minimum Wage in America?
-

 AI2 weeks ago
Ranked: Semiconductor Companies by Industry Revenue Share
-

 Markets2 weeks ago
Ranked: The World’s Top Flight Routes, by Revenue
-

 Demographics2 weeks ago
Population Projections: The World’s 6 Largest Countries in 2075
-

 Markets2 weeks ago
The Top 10 States by Real GDP Growth in 2023