Datastream
Ranked: The World’s 25 Richest Countries by GDP per Capita
The Briefing
- The world GDP per capita continues to grow every year, and is projected to be $13,920 for 2023
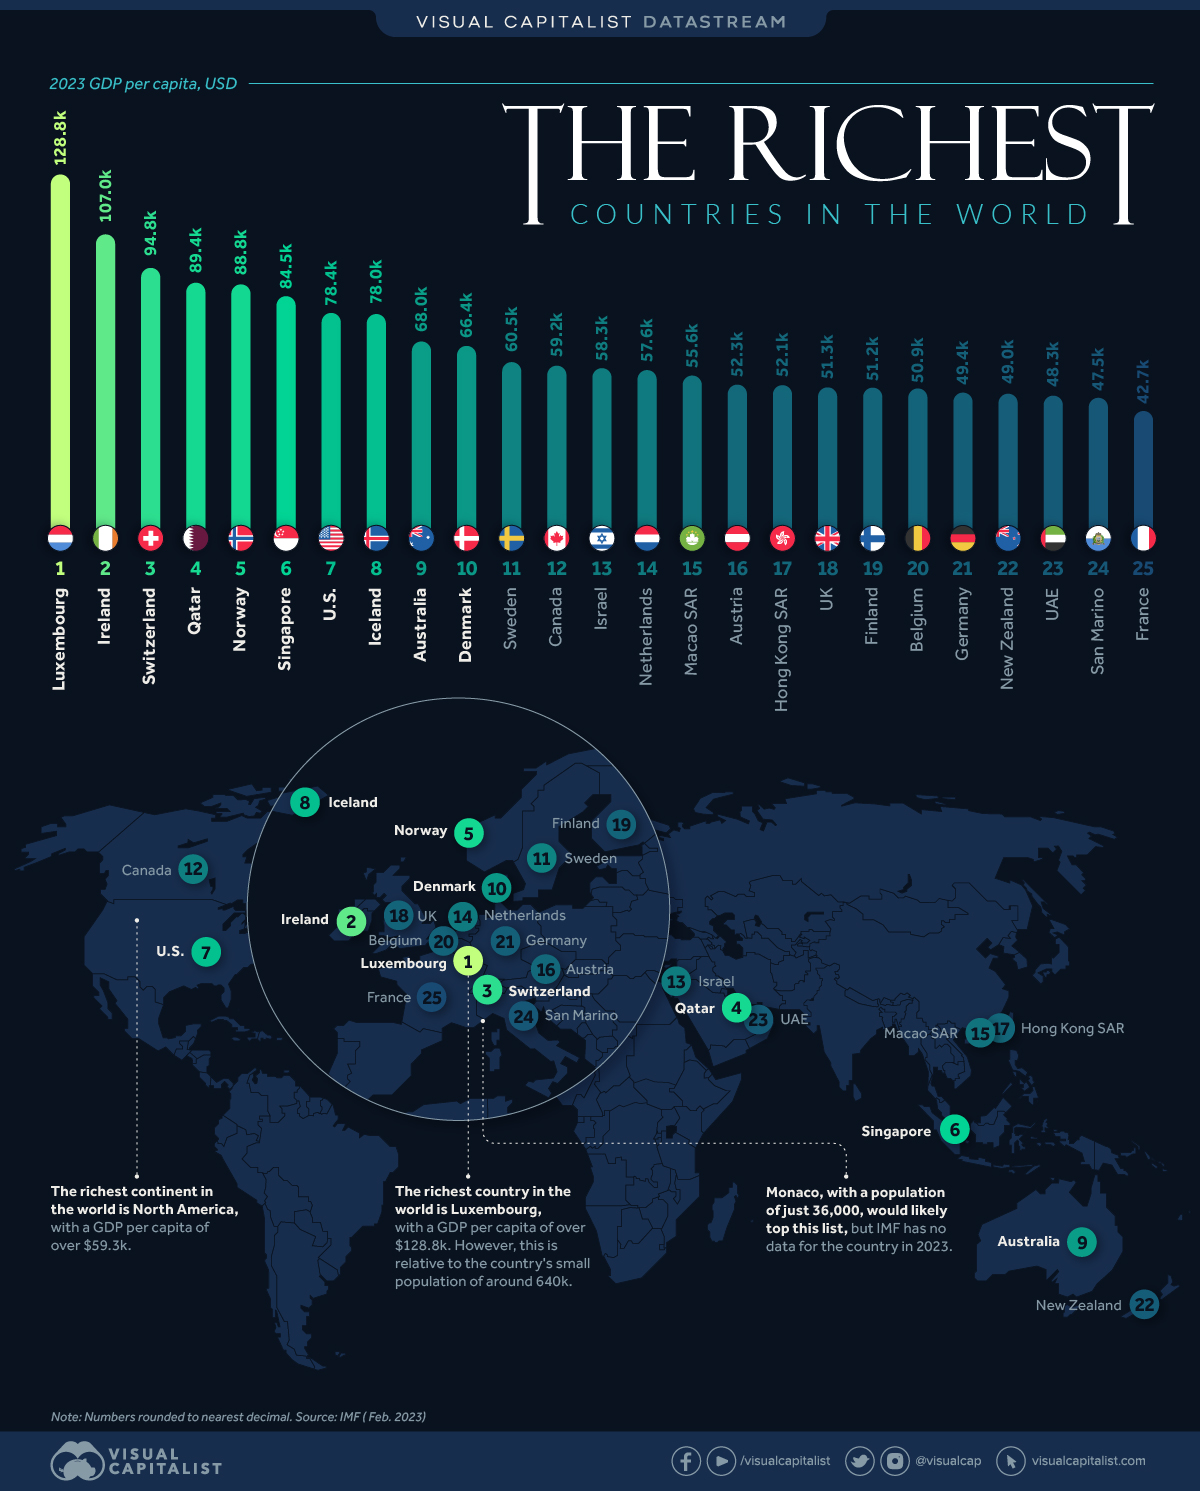
- Luxembourg is the richest country with a GDP per capita of $128,820
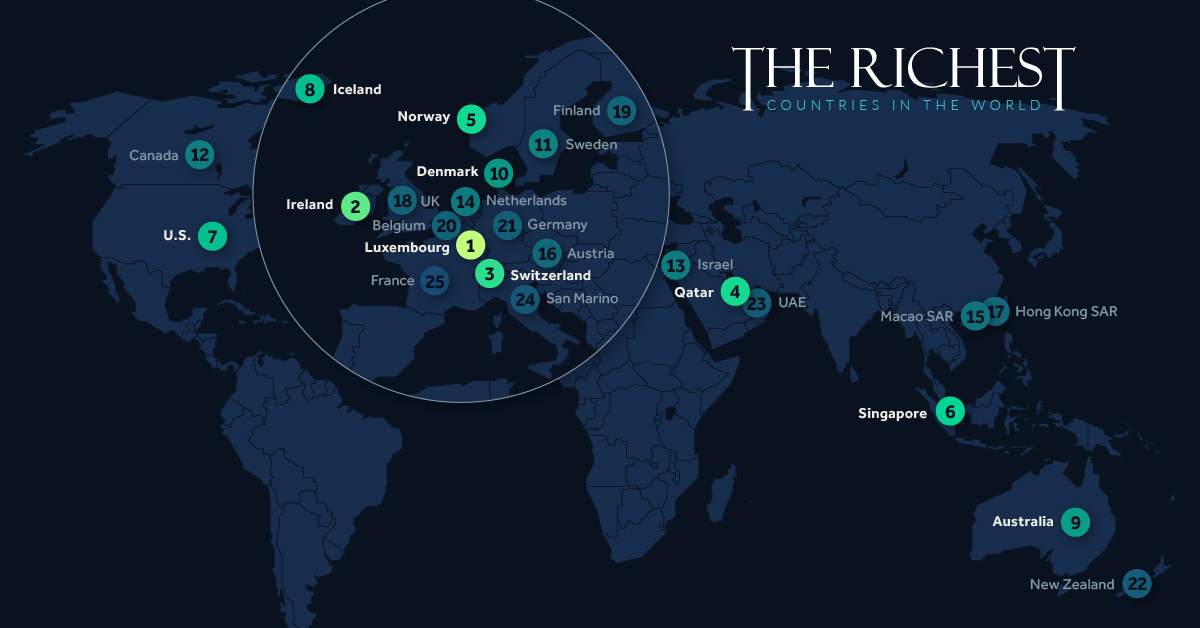
Mapped: Which Are the World’s Richest Countries?
Measuring GDP per capita is a common measure of the economic wealth on a per person basis. This article sorts countries according to the latest International Monetary Fund (IMF) projections on GDP per capita for 2023.
Currently this metric is at $13,920 globally in 2023, up from $13,400 in 2022 and $11,160 in 2020, all nominal figures, not accounting for inflation.
Here is the full ranking of the richest countries in 2023, according to their per capita GDP.
| Country | GDP per capita, USD |
|---|---|
| Luxembourg | $128,820 |
| Ireland | $106,998 |
| Switzerland | $94,835 |
| Qatar | $89,417 |
| Norway | $88,749 |
| Singapore | $84,501 |
| United States | $78,422 |
| Iceland | $77,961 |
| Australia | $68,024 |
| Denmark | $66,394 |
| Sweden | $60,474 |
| Canada | $59,179 |
| Israel | $58,274 |
| Netherlands | $57,629 |
| Macao SAR | $55,645 |
| Austria | $52,317 |
| Hong Kong SAR | $52,133 |
| United Kingdom | $51,287 |
| Finland | $51,178 |
| Belgium | $50,907 |
| Germany | $49,431 |
| New Zealand | $49,009 |
| United Arab Emirates | $48,263 |
| San Marino | $47,485 |
| France | $42,647 |
| Brunei Darussalam | $41,714 |
| Andorra | $40,644 |
| Puerto Rico | $40,361 |
| Taiwan | $36,834 |
| Kuwait | $35,256 |
| Japan | $35,034 |
| South Korea | $34,768 |
| The Bahamas | $34,549 |
| Malta | $33,793 |
| Italy | $33,663 |
| Aruba | $33,483 |
| Estonia | $31,216 |
| Slovenia | $30,841 |
| Cyprus | $30,240 |
| Czech Republic | $29,857 |
| Spain | $29,730 |
| Bahrain | $29,077 |
| Saudi Arabia | $27,009 |
| Lithuania | $25,656 |
| Portugal | $25,487 |
| Iran | $23,620 |
| Oman | $23,194 |
| Latvia | $22,765 |
| Slovak Republic | $22,296 |
| Barbados | $21,637 |
| Greece | $21,372 |
| Seychelles | $21,321 |
| Guyana | $21,163 |
| Trinidad and Tobago | $20,642 |
| Uruguay | $20,464 |
| Saint Kitts and Nevis | $20,393 |
| Hungary | $20,119 |
| Poland | $20,046 |
| Croatia | $18,452 |
| Antigua and Barbuda | $18,265 |
| Chile | $17,282 |
| Panama | $17,154 |
| Maldives | $16,440 |
| Romania | $16,228 |
| Palau | $15,082 |
| Russian Federation | $14,705 |
| Malaysia | $13,943 |
| Costa Rica | $13,806 |
| Argentina | $13,768 |
| China | $13,630 |
| Bulgaria | $13,221 |
| Turkmenistan | $13,021 |
| Kazakhstan | $12,433 |
| Saint Lucia | $11,679 |
| Dominican Republic | $11,406 |
| Mexico | $11,251 |
| Grenada | $11,156 |
| Türkiye, Republic of | $10,864 |
| Montenegro | $10,722 |
| Nauru | $10,097 |
| Equatorial Guinea | $10,087 |
| Serbia | $10,076 |
| Belarus | $9,938 |
| Gabon | $9,850 |
| Mauritius | $9,832 |
| Brazil | $9,572 |
| Saint Vincent and the Grenadines | $9,432 |
| Dominica | $8,840 |
| Thailand | $8,274 |
| Botswana | $7,463 |
| Peru | $7,354 |
| Georgia | $7,270 |
| North Macedonia | $7,263 |
| Bosnia and Herzegovina | $7,082 |
| Colombia | $6,940 |
| Azerbaijan | $6,872 |
| South Africa | $6,813 |
| Albania | $6,592 |
| Ecuador | $6,588 |
| Armenia | $6,568 |
| Libya | $6,392 |
| Belize | $6,382 |
| Iraq | $6,320 |
| Tuvalu | $6,215 |
| Jamaica | $5,985 |
| Paraguay | $5,907 |
| Fiji | $5,869 |
| Moldova | $5,744 |
| Kosovo | $5,560 |
| Tonga | $5,368 |
| Marshall Islands | $5,087 |
| El Salvador | $5,076 |
| Namibia | $5,053 |
| Suriname | $5,037 |
| Guatemala | $5,007 |
| Indonesia | $5,006 |
| Jordan | $4,930 |
| Mongolia | $4,726 |
| Vietnam | $4,683 |
| Egypt | $4,438 |
| Micronesia | $4,309 |
| Eswatini | $4,189 |
| Algeria | $4,163 |
| Samoa | $4,126 |
| Morocco | $4,068 |
| Angola | $3,998 |
| Djibouti | $3,870 |
| Bhutan | $3,856 |
| Bolivia | $3,792 |
| Philippines | $3,764 |
| Tunisia | $3,762 |
| Cabo Verde | $3,709 |
| Papua New Guinea | $3,570 |
| West Bank and Gaza | $3,544 |
| Venezuela | $3,267 |
| Vanuatu | $3,115 |
| Honduras | $3,080 |
| Bangladesh | $2,847 |
| Congo, Republic of | $2,844 |
| India | $2,692 |
| Nigeria | $2,585 |
| Uzbekistan | $2,555 |
| Nicaragua | $2,541 |
| Côte d'Ivoire | $2,497 |
| Mauritania | $2,366 |
| Solomon Islands | $2,330 |
| Zimbabwe | $2,308 |
| São Tomé and Príncipe | $2,302 |
| Kenya | $2,259 |
| Ghana | $2,131 |
| Lao P.D.R. | $1,985 |
| Cambodia | $1,902 |
| Haiti | $1,792 |
| Kiribati | $1,732 |
| Senegal | $1,640 |
| Cameroon | $1,609 |
| Kyrgyz Republic | $1,570 |
| Timor-Leste | $1,495 |
| Guinea | $1,446 |
| Zambia | $1,396 |
| Benin | $1,383 |
| Nepal | $1,372 |
| Tanzania | $1,341 |
| Comoros | $1,303 |
| Ethiopia | $1,227 |
| Lesotho | $1,209 |
| Myanmar | $1,173 |
| Uganda | $1,164 |
| Tajikistan | $1,050 |
| Togo | $1,008 |
| Rwanda | $968 |
| Sudan | $930 |
| Gambia | $883 |
| Mali | $877 |
| Guinea-Bissau | $874 |
| Yemen | $872 |
| Burkina Faso | $832 |
| Liberia | $770 |
| Chad | $755 |
| Congo | $704 |
| Eritrea | $700 |
| Mozambique | $579 |
| Niger | $574 |
| South Sudan | $570 |
| Somalia | $562 |
| Madagascar | $540 |
| Central African Republic | $516 |
| Malawi | $483 |
| Sierra Leone | $472 |
| Burundi | $308 |
Luxembourg, one of the smallest countries in the EU has a population of 634,000 and is the richest country in this ranking with a per capita GDP of nearly $130,000. Formerly known for its steel manufacturing, the country now boasts a large financial services sector, which accounts for the majority of its economic output.
Luxembourg’s per capita GDP is nearly 415 times the per capita GDP of the world’s poorest country, Burundi, at $303.
Ireland is the second-richest country in the world on a GDP per capita basis with $107,000, followed by Switzerland at nearly $94,000. Ireland’s GDP per capita, in particular, has seen a significant increase in recent years due to its pro-business environment, low corporate tax rates, and a highly educated workforce that attracts foreign direct investment.
Most of the richest countries are found in Europe and North America (the top two richest continents), with a per capita GDP of $34,500 and $59,000, respectively. On the other hand, most of the poorest countries in the world are found in Africa.
Both metrics show a continuation of historical trends of regional wealth in the world.
» See a ranking of the poorest countries in the world
Source: International Monetary Fund.
Data note: The IMF dataset does not include data for all countries, and those with missing data for 2023 have not been included in this visualization. Some of the countries not included are: Afghanistan, Bermuda, Cuba, Monaco, Pakistan, Sri Lanka, Syria. For a full list of countries not included, refer to the IMF site. Furthermore, the GDP per capita dataset often updates as currency rates fluctuate, which may lead to slight differences in figures at the time of publishing.


Datastream
Charting the Rise of Cross-Border Money Transfers (2015-2023)
With over 280 million immigrants transferring billions of dollars annually, the remittance industry has become more valuable than ever.
The Briefing
- 79% of remittance payments in 2022 were made to low and middle-income countries.
- Borderless, low-cost money transfer services like those provided by Wise can help immigrants support their families.
The Rise of Cross-Border Money Transfers
The remittance industry has experienced consistent growth recently, solidifying its position as a key component of the global financial landscape. Defined as the transfer of money from one country to another, usually to support a dependent, remittances play a pivotal role in providing food, healthcare, and education.
In this graphic, sponsored by Scottish Mortgage, we delve into the growth of the remittance industry, and the key factors propelling its success.
Powered by Immigration
With over 280 million immigrants worldwide, the remittance industry has an important place in our global society.
By exporting billions of dollars annually back to their starting nations, immigrants can greatly improve the livelihoods of their families and communities.
This is particularly true for low and middle-income countries, who in 2022 received, on average, 79% of remittance payments, according to Knomad, an initiative of the World Bank.
| Year | Low/Middle Income (US$ Billion) | World Total (US$ Billion) |
|---|---|---|
| 2015 | $447B | $602B |
| 2016 | $440B | $596B |
| 2017 | $477B | $638B |
| 2018 | $524B | $694B |
| 2019 | $546B | $722B |
| 2020 | $542B | $711B |
| 2021 | $597B | $781B |
| 2022 | $626B | $794B |
| 2023 | $639B | $815B |
India is one of the global leaders in receiving remittance payments. In 2022 alone, over $100 billion in remittances were sent to India, supporting many families.
Enter Wise
As the global remittance industry continues to grow, it is important to acknowledge the role played by innovative money transfer operators like Wise.
With an inclusive, user-centric platform and competitive exchange rates, Wise makes it easy and cost-effective for millions of individuals to send money home, worldwide.
Connection Without Borders
But Wise doesn’t just offer remittance solutions, the company offers a host of account services and a payment infrastructure that has helped over 6.1 million active customers move over $30 billion in the first quarter of 2023 alone.
Want to invest in transformative companies like Wise?
Discover Scottish Mortgage Investment Trust, a portfolio of some of the world’s most exciting growth companies.

-

 Markets1 week ago
U.S. Debt Interest Payments Reach $1 Trillion
-

 Business2 weeks ago
Charted: Big Four Market Share by S&P 500 Audits
-

 Real Estate2 weeks ago
Ranked: The Most Valuable Housing Markets in America
-

 Money2 weeks ago
Which States Have the Highest Minimum Wage in America?
-

 AI2 weeks ago
Ranked: Semiconductor Companies by Industry Revenue Share
-

 Markets2 weeks ago
Ranked: The World’s Top Flight Routes, by Revenue
-

 Demographics2 weeks ago
Population Projections: The World’s 6 Largest Countries in 2075
-

 Markets2 weeks ago
The Top 10 States by Real GDP Growth in 2023