Mining
Ranked: The World’s Biggest Steel Producers, by Country
![]() Subscribe to the Elements free mailing list for more like this
Subscribe to the Elements free mailing list for more like this
Ranked: The World’s Biggest Steel Producers, by Country
This was originally posted on Elements. Sign up to the free mailing list to get beautiful visualizations on real assets and resource megatrends each week.
Steel is a critical component of modern industry and economy, essential for the construction of buildings, automobiles, and many other appliances and infrastructure used in our daily lives.
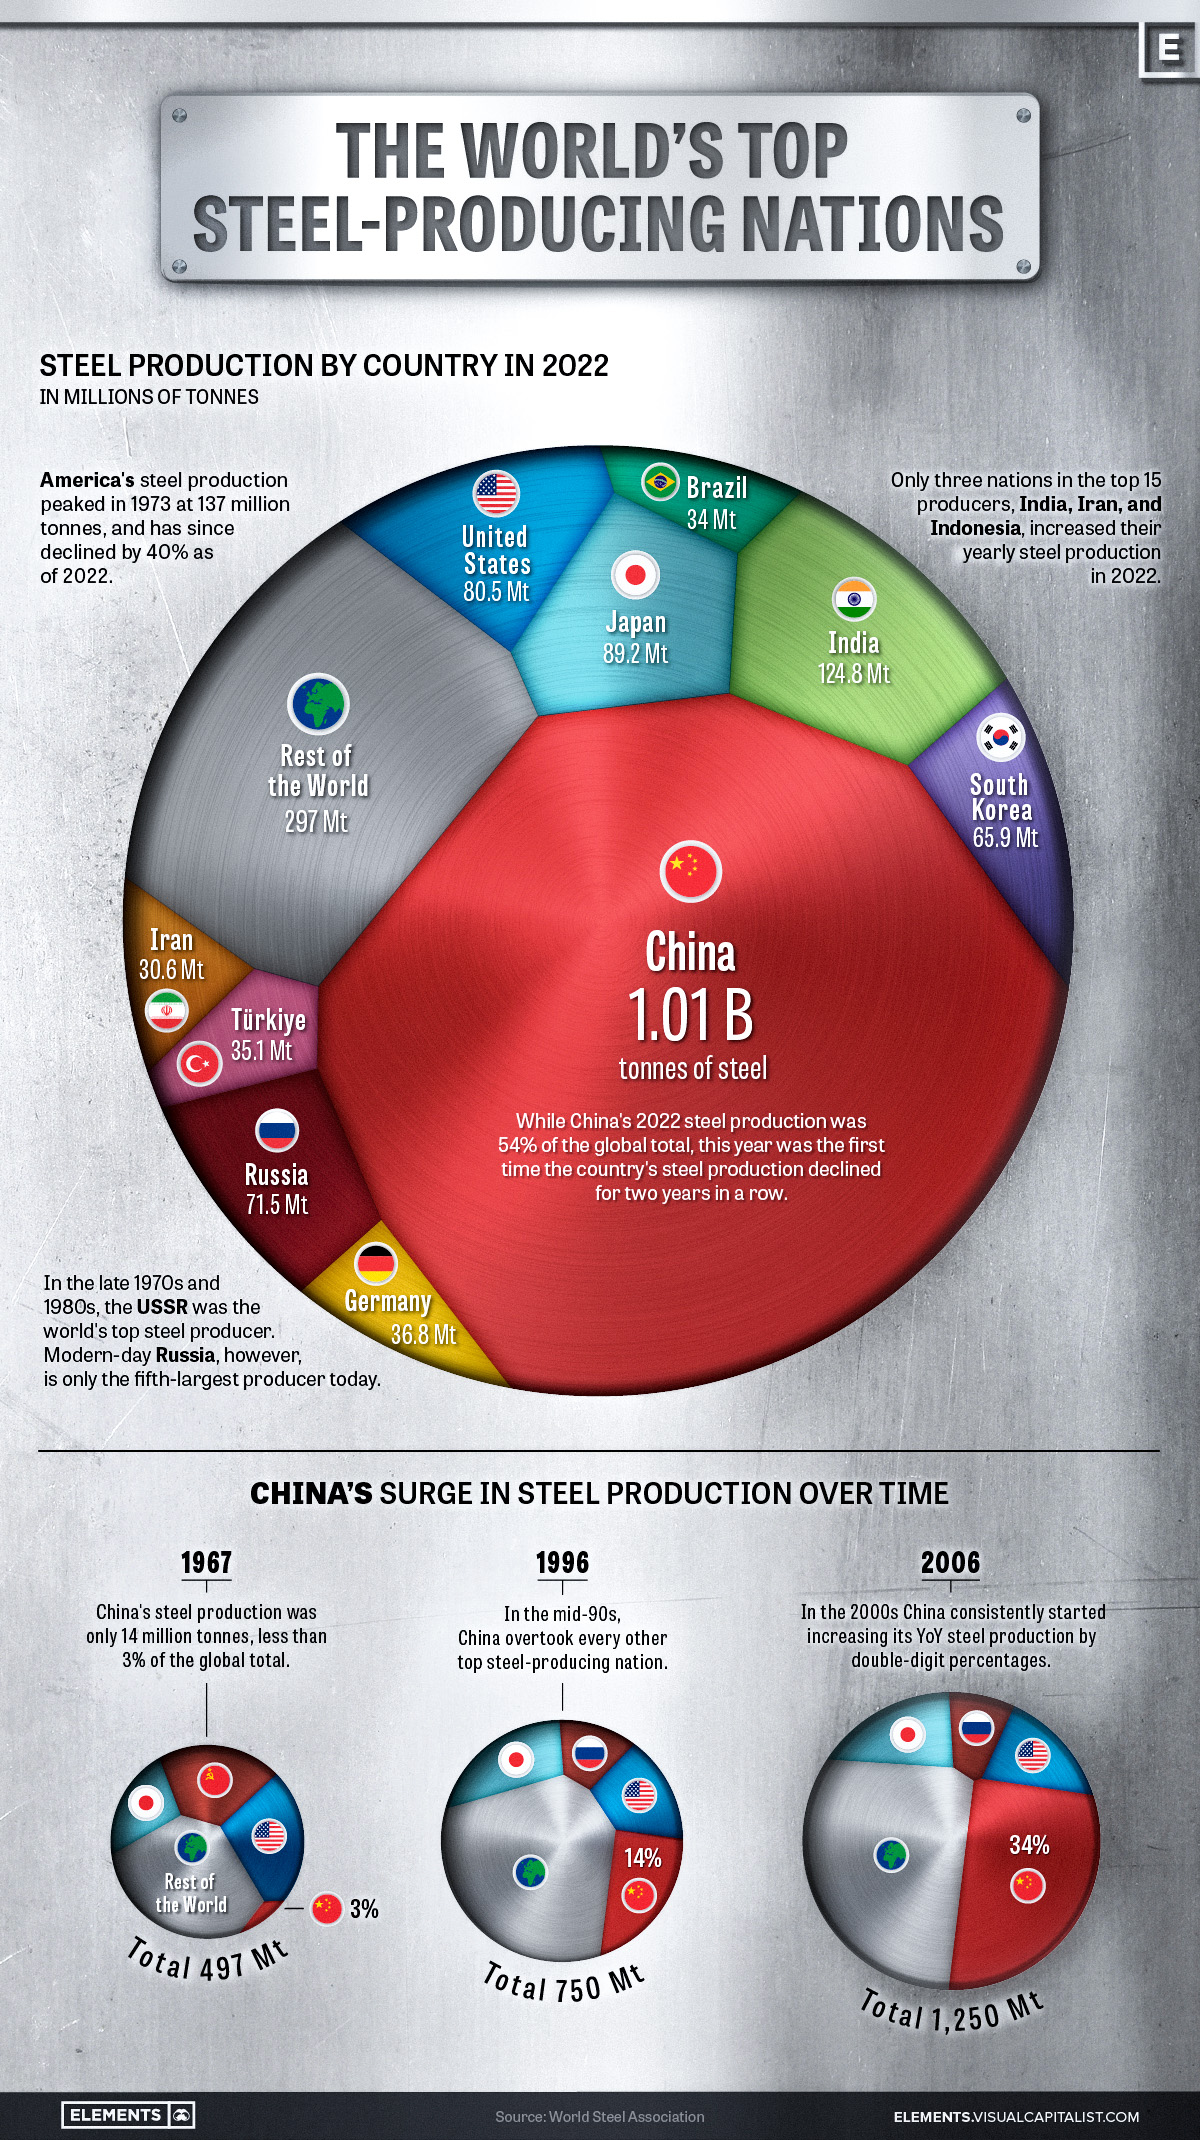
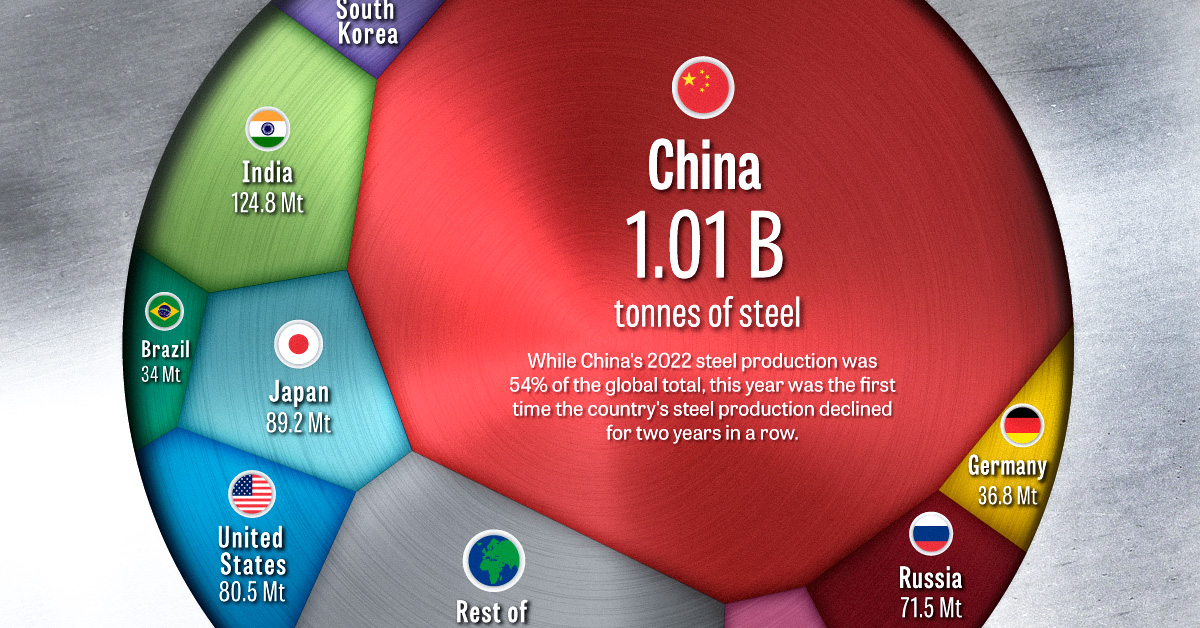
This graphic uses data from the World Steel Association to visualize the world’s top steel-producing countries, and highlights China’s ascent to the top, as it now makes up more than half of the world’s steel production.
The State of Global Steel Production
Global steel production in 2022 reached 1,878 million tonnes, barely surpassing the pre-pandemic production of 1,875 million tonnes in 2019.
| Country | 2022 Production (in million tonnes) | Annual Production Change | Global Share |
|---|---|---|---|
| 🇨🇳 China | 1013.0 | -2.0% | 53.9% |
| 🇮🇳 India | 124.8 | 5.3% | 6.6% |
| 🇯🇵 Japan | 89.2 | -7.9% | 4.8% |
| 🇺🇸 United States | 80.5 | -6.5% | 4.3% |
| 🇷🇺 Russia | 71.5 | -5.8% | 3.8% |
| 🇰🇷 South Korea | 65.9 | -6.9% | 3.5% |
| 🇩🇪 Germany | 36.8 | -8.8% | 2.0% |
| 🇹🇷 Türkiye | 35.1 | -15.0% | 1.9% |
| 🇧🇷 Brazil | 34.0 | -6.5% | 1.8% |
| 🇮🇷 Iran | 30.6 | 6.8% | 1.6% |
| 🇮🇹 Italy | 21.6 | -13.0% | 1.1% |
| 🇹🇼 Taiwan | 20.7 | -12.1% | 1.1% |
| 🇻🇳 Vietnam | 20.0 | -15.0% | 1.1% |
| 🇲🇽 Mexico | 18.2 | -1.9% | 1.0% |
| 🇮🇩 Indonesia | 15.6 | 8.3% | 0.8% |
| Rest of World | 201.0 | -11.2% | 10.7% |
| World Total | 1878.5 | -3.9% | 100.0% |
2022’s steel production marked a significant reduction compared to the post-pandemic rebound of 1,960 million tonnes in 2021, with a year-over-year decline of 4.2%–the largest drop since 2009, and prior to that, 1991.
This decline was spread across many of the world’s top steel producers, with only three of the top fifteen countries, India, Iran, and Indonesia, increasing their yearly production. Most of the other top steel-producing countries saw annual production declines of more than 5%, with Turkey, Italy, Taiwan, and Vietnam’s production all declining by double digits.
Even the world’s top steel-producing nation, China, experienced a modest 2% decline, which due to the country’s large production amounted to a decline of 19.8 million tonnes, more than many other nations produce in a year.
Despite India, the world’s second-largest steel producer, increasing its production by 5.3%, the country’s output still amounts to just over one-tenth of the steel produced by China.
China’s Meteoric Rise in Steel Production
Although China dominates the world’s steel production with more than a 54% share today, this hasn’t always been the case.
In 1967, the World Steel Association’s first recorded year of steel production figures, China only produced an estimated 14 million tonnes, making up barely 3% of global output. At that time, the U.S. and the USSR were competing as the world’s top steel producers at 115 and 102 million tonnes respectively, followed by Japan at 62 million tonnes.
Almost three decades later in 1996, China had successively overtaken Russia, the U.S., and Japan to become the top steel-producing nation with 101 million tonnes of steel produced that year.
The early 2000s marked a period of rapid growth for China, with consistent double-digit percentage increases in steel production each year.
The Recent Decline in China’s Steel Production
Since the early 2000s, China’s average annual growth in steel production has slowed to 3.4% over the last decade (2013-2022), a considerable decline compared to the previous decade’s (2003-2012) 15.2% average annual growth rate.
The past couple of years have seen China’s steel production decline, with 2021 and 2022 marking the first time the country’s production fell for two consecutive years in a row.
While it’s unlikely China will relinquish its position as the top steel-producing nation anytime soon, it remains to be seen whether this recent decline marks the beginning of a new trend or just a brief deviation from the country’s consistent production growth.


Copper
Brass Rods: The Secure Choice
This graphic shows why brass rods are the secure choice for precision-machined and forged parts.


Brass Rods: The Secure Choice
The unique combination of machinability and recyclability makes brass rods the secure choice for manufacturers seeking future-proof raw material solutions.
This infographic, from the Copper Development Association, shows three ways brass rods give manufacturers greater control and a license to grow in the competitive market for precision-machined and forged products.
Future-Proof Investments in New Machine Tools
A material’s machinability directly impacts machine throughput, which typically has the largest impact on machine shop profitability.
The high-speed machining capabilities of brass rods maximize machine tool performance, allowing manufacturers to run the material faster and longer without sacrificing tool life, chip formation, or surface quality.
The high machining efficiency of brass leads to reduced per-part costs, quicker return on investment (ROI) for new machine tools, and expanded production capacity for new projects.
Supply Security Through Closed Loop Recycling
Brass, like its parent element copper, can be infinitely recycled.
In 2022, brass- and wire-rod mills accounted for the majority of the 830,000 tonnes of copper recycled from scrap in the United States.
Given that scrap ratios for machined parts typically range from 60-70% by weight, producing mills benefit from a secure and steady supply of clean scrap returned directly from customers, which is recycled to create new brass rods.
The high residual value of brass scrap creates a strong recycling incentive. Scrap buy back programs give manufacturers greater control over raw material net costs as scrap value is often factored into supplier purchase agreements.
Next Generation Alloys for a Lead-Free Future
Increasingly stringent global regulations continue to pressure manufacturers to minimize the use of materials containing trace amounts of lead and other harmful impurities.
The latest generation of brass-rod alloys is engineered to meet the most demanding criteria for lead leaching in drinking water and other sensitive applications.
Seven brass-rod alloys passed rigorous testing to become the only ‘Acceptable Materials’ against lower lead leaching criteria recently adopted in the national U.S. drinking water quality standard, NSF 61.
Learn more about the advantages of brass rods solutions.

-

 Base Metals1 year ago
Ranked: The World’s Largest Copper Producers
Many new technologies critical to the energy transition rely on copper. Here are the world’s largest copper producers.
-

 Silver2 years ago
Mapped: Solar Power by Country in 2021
In 2020, solar power saw its largest-ever annual capacity expansion at 127 gigawatts. Here’s a snapshot of solar power capacity by country.
-

 Batteries5 years ago
Visualizing Copper’s Role in the Transition to Clean Energy
A clean energy transition is underway as wind, solar, and batteries take center stage. Here’s how copper plays the critical role in these technologies.
-

 Science5 years ago
Everything You Need to Know on VMS Deposits
Deep below the ocean’s waves, VMS deposits spew out massive amounts of minerals like copper, zinc, and gold, making them a key source of the metals…
-
 Copper5 years ago
How Much Copper is in an Electric Vehicle?
Have you ever wondered how much copper is in an electric vehicle? This infographic shows the metal’s properties as well as the quantity of copper used.
-
 Copper6 years ago
Copper: Driving the Green Energy Revolution
Renewable energy is set to fuel a new era of copper demand – here’s how much copper is used in green applications from EVs to photovoltaics.

-

 Maps2 weeks ago
Mapped: Average Wages Across Europe
-

 Money1 week ago
Which States Have the Highest Minimum Wage in America?
-

 Real Estate1 week ago
Ranked: The Most Valuable Housing Markets in America
-

 Markets1 week ago
Charted: Big Four Market Share by S&P 500 Audits
-

 AI1 week ago
The Stock Performance of U.S. Chipmakers So Far in 2024
-

 Automotive2 weeks ago
Almost Every EV Stock is Down After Q1 2024
-

 Money2 weeks ago
Where Does One U.S. Tax Dollar Go?
-

 Green2 weeks ago
Ranked: Top Countries by Total Forest Loss Since 2001