Technology
Visualizing Global Attitudes Towards AI


Comparing Public Sentiment Towards AI, by Country
Artificial intelligence (AI) is one of the fastest growing and most disruptive technologies in the world today. Because it has the potential to drastically impact society, it’s important to measure how people are feeling towards it.
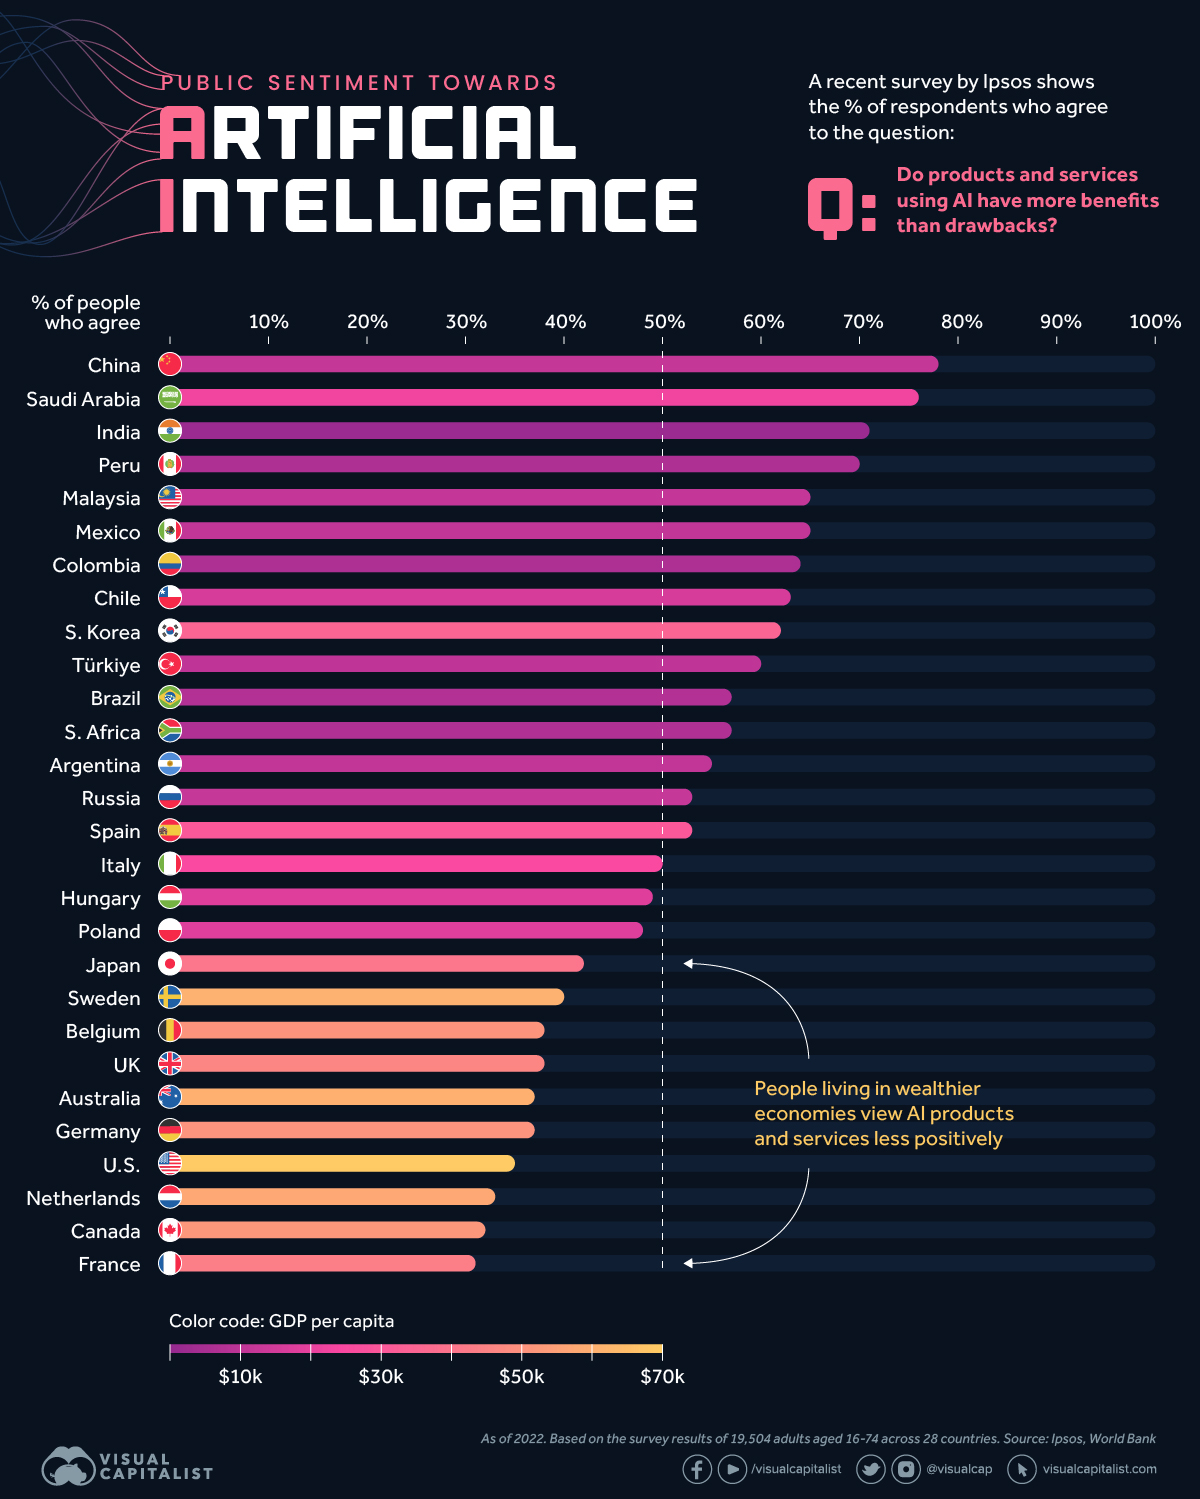
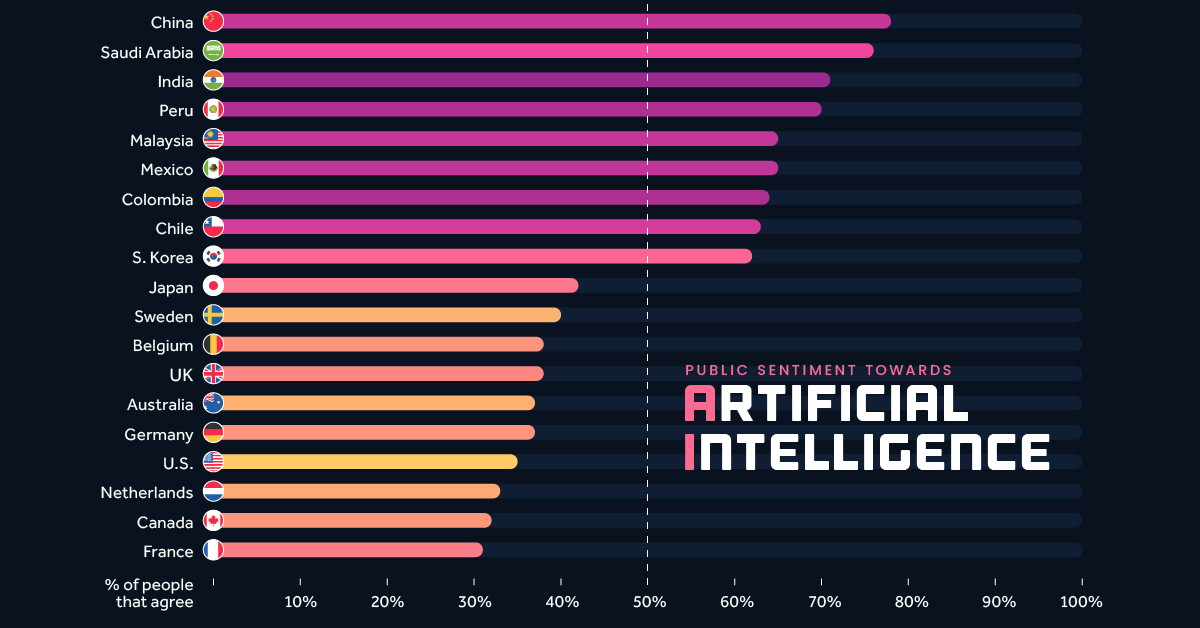
This infographic visualizes survey data from market research firm, Ipsos, to see how attitudes towards AI varies by country. By including each country’s GDP per capita, we can see that wealthier populations are more skeptical about products and services that use the technology.
Data and Methodology
This data is based on a 28-country survey of 19,504 adults aged 18 to 74. Polling took place between November and December 2021, and the results were published in January 2022.
This survey took place before the recent explosion in popularity of generative AI tools such as ChatGPT, DALL-E, and Midjourney, but forms the foundation for how people view this rapidly improving technology.
The table below lists the percentage of respondents who agreed with the following statement:
“Products and services using artificial intelligence have more benefits than drawbacks”
| Country | % Agreeing With Statement | GDP per capita |
|---|---|---|
| China | 78% | $12,556 |
| Saudi Arabia | 76% | $23,186 |
| India | 71% | $2,257 |
| Peru | 70% | $6,622 |
| Malaysia | 65% | $11,109 |
| Mexico | 65% | $10,046 |
| Colombia | 64% | $6,104 |
| Chile | 63% | $16,265 |
| South Korea | 62% | $34,998 |
| Türkiye | 60% | $9,661 |
| Brazil | 57% | $7,507 |
| South Africa | 57% | $7,055 |
| Argentina | 55% | $10,636 |
| Russia | 53% | $12,195 |
| Spain | 53% | $30,104 |
| Italy | 50% | $35,658 |
| Hungary | 49% | $18,728 |
| Poland | 48% | $18,000 |
| Japan | 42% | $39,313 |
| Sweden | 40% | $61,029 |
| Belgium | 38% | $51,247 |
| UK | 38% | $46,510 |
| Australia | 37% | $60,443 |
| Germany | 37% | $51,203 |
| United States | 35% | $70,249 |
| Netherlands | 33% | $57,768 |
| Canada | 32% | $51,988 |
| France | 31% | $43,659 |
GDP per capita as of 2021. Source: World Bank
Ipsos notes that their samples from developing economies like China and India were “more urban, more educated, and more affluent than the general population”. Thus, the results for these countries likely reflect the more tech-savvy segments of their population.
Further Survey Results
Respondents were asked additional questions about AI, which we’ve included in the tables below. Let’s start with this statement:
“Products and services using artificial intelligence make my life easier”
| Country | % Agreeing With Statement | GDP per capita |
|---|---|---|
| China | 87% | $12,556 |
| Saudi Arabia | 80% | $23,186 |
| Peru | 74% | $6,622 |
| South Korea | 74% | $34,998 |
| Mexico | 73% | $10,046 |
| India | 72% | $2,257 |
| Colombia | 71% | $6,104 |
| Malaysia | 71% | $11,109 |
| Türkiye | 71% | $9,661 |
| Chile | 70% | $16,265 |
| South Africa | 67% | $7,055 |
| Brazil | 65% | $7,507 |
| Russia | 64% | $12,195 |
| Argentina | 59% | $10,636 |
| Spain | 59% | $30,104 |
| Poland | 58% | $18,000 |
| Italy | 54% | $35,658 |
| Japan | 52% | $39,313 |
| Hungary | 50% | $18,728 |
| Belgium | 49% | $51,247 |
| Netherlands | 47% | $57,768 |
| Australia | 46% | $60,443 |
| Sweden | 46% | $61,029 |
| Germany | 45% | $51,203 |
| UK | 45% | $46,510 |
| Canada | 44% | $51,988 |
| United States | 41% | $70,249 |
| France | 39% | $43,659 |
As expected, we see a similar trend as in the previous question’s results. It seems that developing countries are embracing AI to greater lengths.
Next, we’ll look at a more forward-looking statement:
“Products and services using AI will profoundly change my daily life in the next 3-5 years”.
| Country | % Agreeing With Statement | GDP per capita |
|---|---|---|
| China | 80% | $12,556 |
| Saudi Arabia | 80% | $23,186 |
| South Korea | 76% | $34,998 |
| India | 74% | $2,257 |
| Türkiye | 73% | $9,661 |
| South Africa | 72% | $7,055 |
| Malaysia | 71% | $11,109 |
| Peru | 71% | $6,622 |
| Chile | 67% | $16,265 |
| Colombia | 65% | $6,104 |
| Mexico | 65% | $10,046 |
| Brazil | 61% | $7,507 |
| Argentina | 60% | $10,636 |
| Russia | 60% | $12,195 |
| Poland | 56% | $18,000 |
| Spain | 56% | $30,104 |
| Hungary | 55% | $18,728 |
| Italy | 53% | $35,658 |
| Japan | 53% | $39,313 |
| Netherlands | 53% | $57,768 |
| Belgium | 52% | $51,247 |
| Australia | 50% | $60,443 |
| Sweden | 50% | $61,029 |
| UK | 46% | $46,510 |
| United States | 46% | $70,249 |
| France | 45% | $43,659 |
| Canada | 44% | $51,988 |
| Germany | 44% | $51,203 |
Once again, populations from wealthier countries are at the lower end of the results. This could be due to societal factors (differing attitudes towards technology), economic structure, or some combination of both.
To elaborate on economic structure, let’s look at the world’s two biggest economies, the U.S. and China. The following table shows the distribution of each country’s workforce across the three major sectors.
| Economic Sector | U.S. | China |
|---|---|---|
| Agriculture | 1% | 25% |
| Industry | 20% | 28% |
| Services | 79% | 47% |
As of 2019. Source: Statista
Developing economies such as China have a larger proportion of agricultural and industrial employment, while advanced economies like the U.S. are typically more services oriented. Structural differences such as these could have an impact on how a population views AI.


Brands
How Tech Logos Have Evolved Over Time
From complete overhauls to more subtle tweaks, these tech logos have had quite a journey. Featuring: Google, Apple, and more.


How Tech Logos Have Evolved Over Time
This was originally posted on our Voronoi app. Download the app for free on iOS or Android and discover incredible data-driven charts from a variety of trusted sources.
One would be hard-pressed to find a company that has never changed its logo. Granted, some brands—like Rolex, IBM, and Coca-Cola—tend to just have more minimalistic updates. But other companies undergo an entire identity change, thus necessitating a full overhaul.
In this graphic, we visualized the evolution of prominent tech companies’ logos over time. All of these brands ranked highly in a Q1 2024 YouGov study of America’s most famous tech brands. The logo changes are sourced from 1000logos.net.
How Many Times Has Google Changed Its Logo?
Google and Facebook share a 98% fame rating according to YouGov. But while Facebook’s rise was captured in The Social Network (2010), Google’s history tends to be a little less lionized in popular culture.
For example, Google was initially called “Backrub” because it analyzed “back links” to understand how important a website was. Since its founding, Google has undergone eight logo changes, finally settling on its current one in 2015.
| Company | Number of Logo Changes |
|---|---|
| 8 | |
| HP | 8 |
| Amazon | 6 |
| Microsoft | 6 |
| Samsung | 6 |
| Apple | 5* |
Note: *Includes color changes. Source: 1000Logos.net
Another fun origin story is Microsoft, which started off as Traf-O-Data, a traffic counter reading company that generated reports for traffic engineers. By 1975, the company was renamed. But it wasn’t until 2012 that Microsoft put the iconic Windows logo—still the most popular desktop operating system—alongside its name.
And then there’s Samsung, which started as a grocery trading store in 1938. Its pivot to electronics started in the 1970s with black and white television sets. For 55 years, the company kept some form of stars from its first logo, until 1993, when the iconic encircled blue Samsung logo debuted.
Finally, Apple’s first logo in 1976 featured Isaac Newton reading under a tree—moments before an apple fell on his head. Two years later, the iconic bitten apple logo would be designed at Steve Jobs’ behest, and it would take another two decades for it to go monochrome.

-

 Travel1 week ago
Airline Incidents: How Do Boeing and Airbus Compare?
-

 Markets2 weeks ago
Visualizing America’s Shortage of Affordable Homes
-

 Green2 weeks ago
Ranked: Top Countries by Total Forest Loss Since 2001
-

 Money2 weeks ago
Where Does One U.S. Tax Dollar Go?
-

 Misc2 weeks ago
Almost Every EV Stock is Down After Q1 2024
-

 AI2 weeks ago
The Stock Performance of U.S. Chipmakers So Far in 2024
-

 Markets2 weeks ago
Charted: Big Four Market Share by S&P 500 Audits
-

 Real Estate2 weeks ago
Ranked: The Most Valuable Housing Markets in America