Economy
The $16 Trillion European Union Economy


The $16 Trillion European Union Economy
The European Union has the third-largest economy in the world, accounting for one-sixth of global trade. All together, 27 member countries make up one internal market allowing free movement of goods, services, capital and people.
But how did this sui generis (a class by itself) political entity come into being?
A Brief History of the EU
After the devastating aftermath of the World War II, Western Europe saw a concerted move towards regional peace and security by promoting democracy and protecting human rights.
Crucially, the Schuman Declaration was presented in 1950. The coal and steel industries of Western Europe were integrated under common management, preventing countries from turning on each other and creating weapons of war. Six countries signed on — the eventual founders of the EU.
Here’s a list of all 27 members of the EU and the year they joined.
| Country | Year of entry |
|---|---|
| 🇧🇪 Belgium | 1958 |
| 🇫🇷 France | 1958 |
| 🇩🇪 Germany | 1958 |
| 🇮🇹 Italy | 1958 |
| 🇱🇺 Luxembourg | 1958 |
| 🇳🇱 Netherlands | 1958 |
| 🇩🇰 Denmark | 1973 |
| 🇮🇪 Ireland | 1973 |
| 🇬🇷 Greece | 1981 |
| 🇵🇹 Portugal | 1986 |
| 🇪🇸 Spain | 1986 |
| 🇦🇹 Austria | 1995 |
| 🇫🇮 Finland | 1995 |
| 🇸🇪 Sweden | 1995 |
| 🇨🇾 Cyprus | 2004 |
| 🇨🇿 Czechia | 2004 |
| 🇪🇪 Estonia | 2004 |
| 🇭🇺 Hungary | 2004 |
| 🇱🇻 Latvia | 2004 |
| 🇱🇹 Lithuania | 2004 |
| 🇲🇹 Malta | 2004 |
| 🇵🇱 Poland | 2004 |
| 🇸🇰 Slovakia | 2004 |
| 🇸🇮 Slovenia | 2004 |
| 🇧🇬 Bulgaria | 2007 |
| 🇷🇴 Romania | 2007 |
| 🇭🇷 Croatia | 2013 |
Greater economic and security cooperation followed over the next four decades, along with the addition of new members. These tighter relationships disincentivized conflict, and Western Europe—after centuries of constant war—has seen unprecedented peace for the last 80 years.
The modern version of the EU can trace its origin to 1993, with the adoption of the name, ‘the European Union,’ the birth of a single market, and the promise to use a single currency—the euro.
Since then the EU has become an economic and political force to reckon with. Its combined gross domestic product (GDP) stood at $16.6 trillion in 2022, after the U.S. ($26 trillion) and China ($19 trillion.)
Front Loading the EU Economy
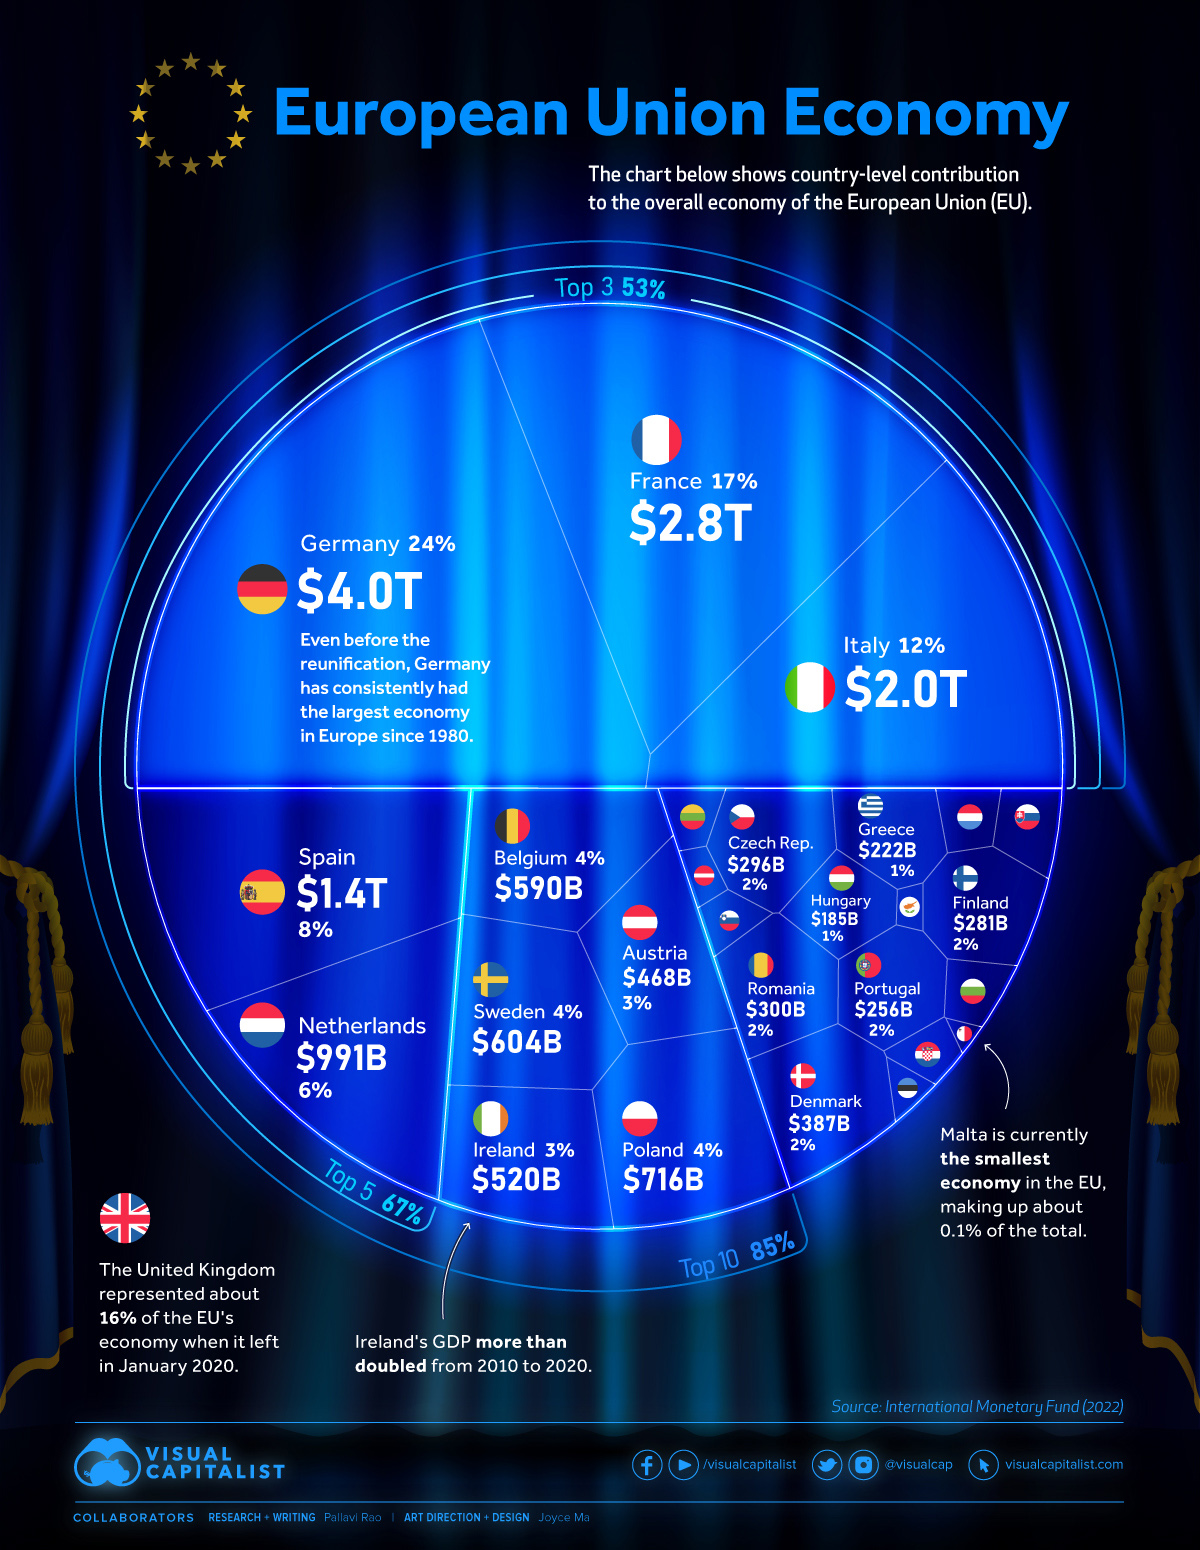
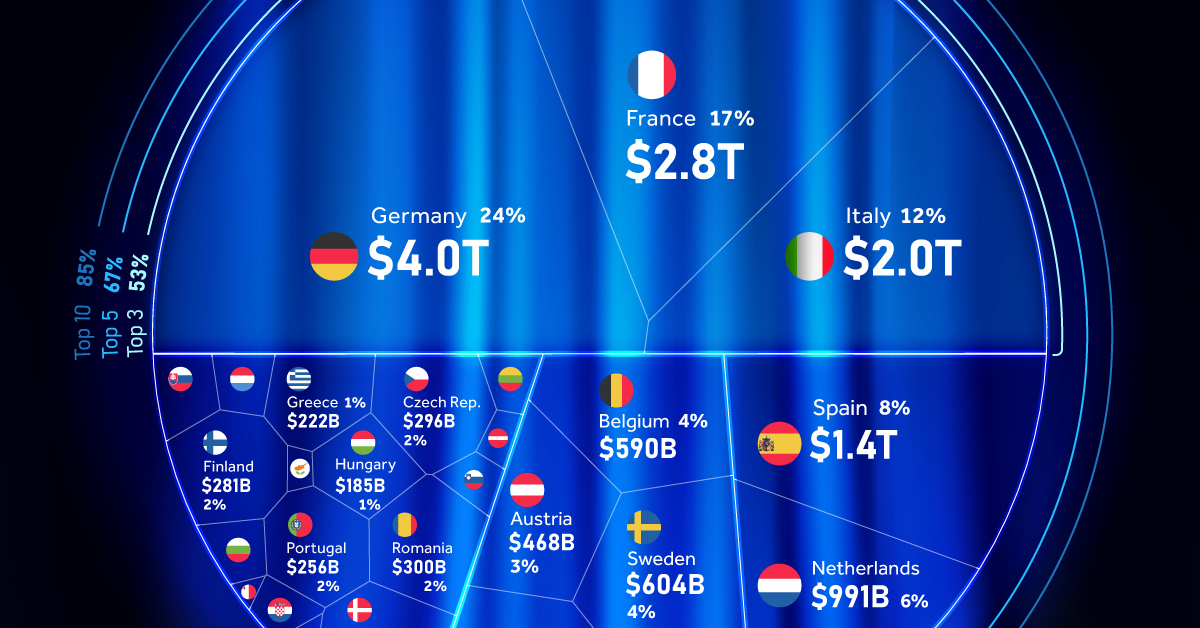
For the impressive numbers it shows however, the European Union’s economic might is held up by three economic giants, per data from the International Monetary Fund. Put together, the GDPs of Germany ($4 trillion), France ($2.7 trillion) and Italy ($1.9 trillion) make up more than half of the EU’s entire economic output.
These three countries are also the most populous in the EU, and together with Spain and Poland, account for 66% of the total population of the EU.
Here’s a table of all 27 member states and the percentage they contribute to the EU’s gross domestic product.
| Rank | Country | GDP (Billion USD) | % of the EU Economy |
|---|---|---|---|
| 1. | 🇩🇪 Germany | 4,031.1 | 24.26% |
| 2. | 🇫🇷 France | 2,778.1 | 16.72% |
| 3. | 🇮🇹 Italy | 1,997.0 | 12.02% |
| 4. | 🇪🇸 Spain | 1,390.0 | 8.37% |
| 5. | 🇳🇱 Netherlands | 990.6 | 5.96% |
| 6. | 🇵🇱 Poland | 716.3 | 4.31% |
| 7. | 🇸🇪 Sweden | 603.9 | 3.64% |
| 8. | 🇧🇪 Belgium | 589.5 | 3.55% |
| 9. | 🇮🇪 Ireland | 519.8 | 3.13% |
| 10. | 🇦🇹 Austria | 468.0 | 2.82% |
| 11. | 🇩🇰 Denmark | 386.7 | 2.33% |
| 12. | 🇷🇴 Romania | 299.9 | 1.81% |
| 13. | 🇨🇿 Czechia | 295.6 | 1.78% |
| 14. | 🇫🇮 Finland | 281.4 | 1.69% |
| 15. | 🇵🇹 Portugal | 255.9 | 1.54% |
| 16. | 🇬🇷 Greece | 222.0 | 1.34% |
| 17. | 🇭🇺 Hungary | 184.7 | 1.11% |
| 18. | 🇸🇰 Slovakia | 112.4 | 0.68% |
| 19. | 🇧🇬 Bulgaria | 85.0 | 0.51% |
| 20. | 🇱🇺 Luxembourg | 82.2 | 0.49% |
| 21. | 🇭🇷 Croatia | 69.4 | 0.42% |
| 22. | 🇱🇹 Lithuania | 68.0 | 0.41% |
| 23. | 🇸🇮 Slovenia | 62.2 | 0.37% |
| 24. | 🇱🇻 Latvia | 40.6 | 0.24% |
| 25. | 🇪🇪 Estonia | 39.1 | 0.24% |
| 26. | 🇨🇾 Cyprus | 26.7 | 0.16% |
| 27. | 🇲🇹 Malta | 17.2 | 0.10% |
| Total | 16,613.1 | 100% |
The top-heaviness continues. By adding Spain ($1.3 trillion) and the Netherlands ($990 billion), the top five make up nearly 70% of the EU’s GDP. That goes up to 85% when the top 10 countries are included.
That means less than half of the 27 member states make up $14 trillion of the $16 trillion EU economy.
Older Members, Larger Share
Aside from the most populous members having bigger economies, another pattern emerges, with the time the country has spent in the EU.
Five of the six founders of the EU—Germany, France, Italy, the Netherlands, Belgium—are in the top 10 biggest economies of the EU. Ireland and Denmark, the next entrants into the union (1973) are ranked 9th and 11th respectively. The bottom 10 countries all joined the EU post-2004.
The UK—which joined the bloc in 1973 and formally left in 2020—would have been the second-largest economy in the region at $3.4 trillion.
Sectoral Analysis of the EU
The EU has four primary sectors of economic output: services, industry, construction, and agriculture (including fishing and forestry.) Below is an analysis of some of these sectors and the countries which contribute the most to it. All figures are from Eurostat.
Services and Tourism
The EU economy relies heavily on the services sector, accounting for more than 70% of the value added to the economy in 2020. It also is the sector with the highest share of employment in the EU, at 73%.
In Luxembourg, which has a large financial services sector, 87% of the country’s gross domestic product came from the services sector.
Tourism economies like Malta and Cyprus also had an above 80% share of services in their GDP.
Industry
Meanwhile 20% of the EU’s gross domestic product came from industry, with Ireland’s economy having the most share (40%) in its GDP. Czechia, Slovenia and Poland also had a significant share of industry output.
Mining coal and lignite in the EU saw a brief rebound in output in 2021, though levels continued to be subdued.
| Rank | Sector | % of the EU Economy |
|---|---|---|
| 1. | Services | 72.4% |
| 2. | Industry | 20.1% |
| 3. | Construction | 5.6% |
| 4. | Agriculture, forestry and fishing | 1.8% |
Agriculture
Less than 2% of the EU’s economy relies on agriculture, forestry and fishing. Romania, Latvia, and Greece feature as contributors to this sector, however the share in total output in each country is less than 5%. Bulgaria has the highest employment (16%) in this sector compared to other EU members.
Energy
The EU imports nearly 60% of its energy requirements. Until the end of 2021, Russia was the biggest exporter of petroleum and natural gas to the region. After the war in Ukraine that share has steadily decreased from nearly 25% to 15% for petroleum liquids and from nearly 40% to 15% for natural gas, per Eurostat.
Headwinds, High Seas
The IMF has a gloomy outlook for Europe heading into 2023. War in Ukraine, spiraling energy costs, high inflation, and stagnant wage growth means that EU leaders are facing “severe trade-offs and tough policy decisions.”
Reforms—to relieve supply constraints in the labor and energy markets—are key to increasing growth and relieving price pressures, according to the international body. The IMF projects that the EU will grow 0.7% in 2023.


Economy
Mapped: Southeast Asia’s GDP Per Capita, by Country
Indonesia, the region’s largest economy, makes the top five in this map exploring Southeast Asia’s GDP per capita levels.
Mapped: Southeast Asia’s GDP Per Capita, by Country
This was originally posted on our Voronoi app. Download the app for free on iOS or Android and discover incredible data-driven charts from a variety of trusted sources.
In 1937, as America navigated the Great Depression, Russian-born economist Simon Kuznets presented a novel idea on measuring a country’s economy. And thus, gross domestic product (GDP) was born.
Nearly eight decades later, measuring GDP, and GDP per capita—which helps make data comparable between populations—has become a benchmark statistic to compare and contrast countries’ economies and productivity.
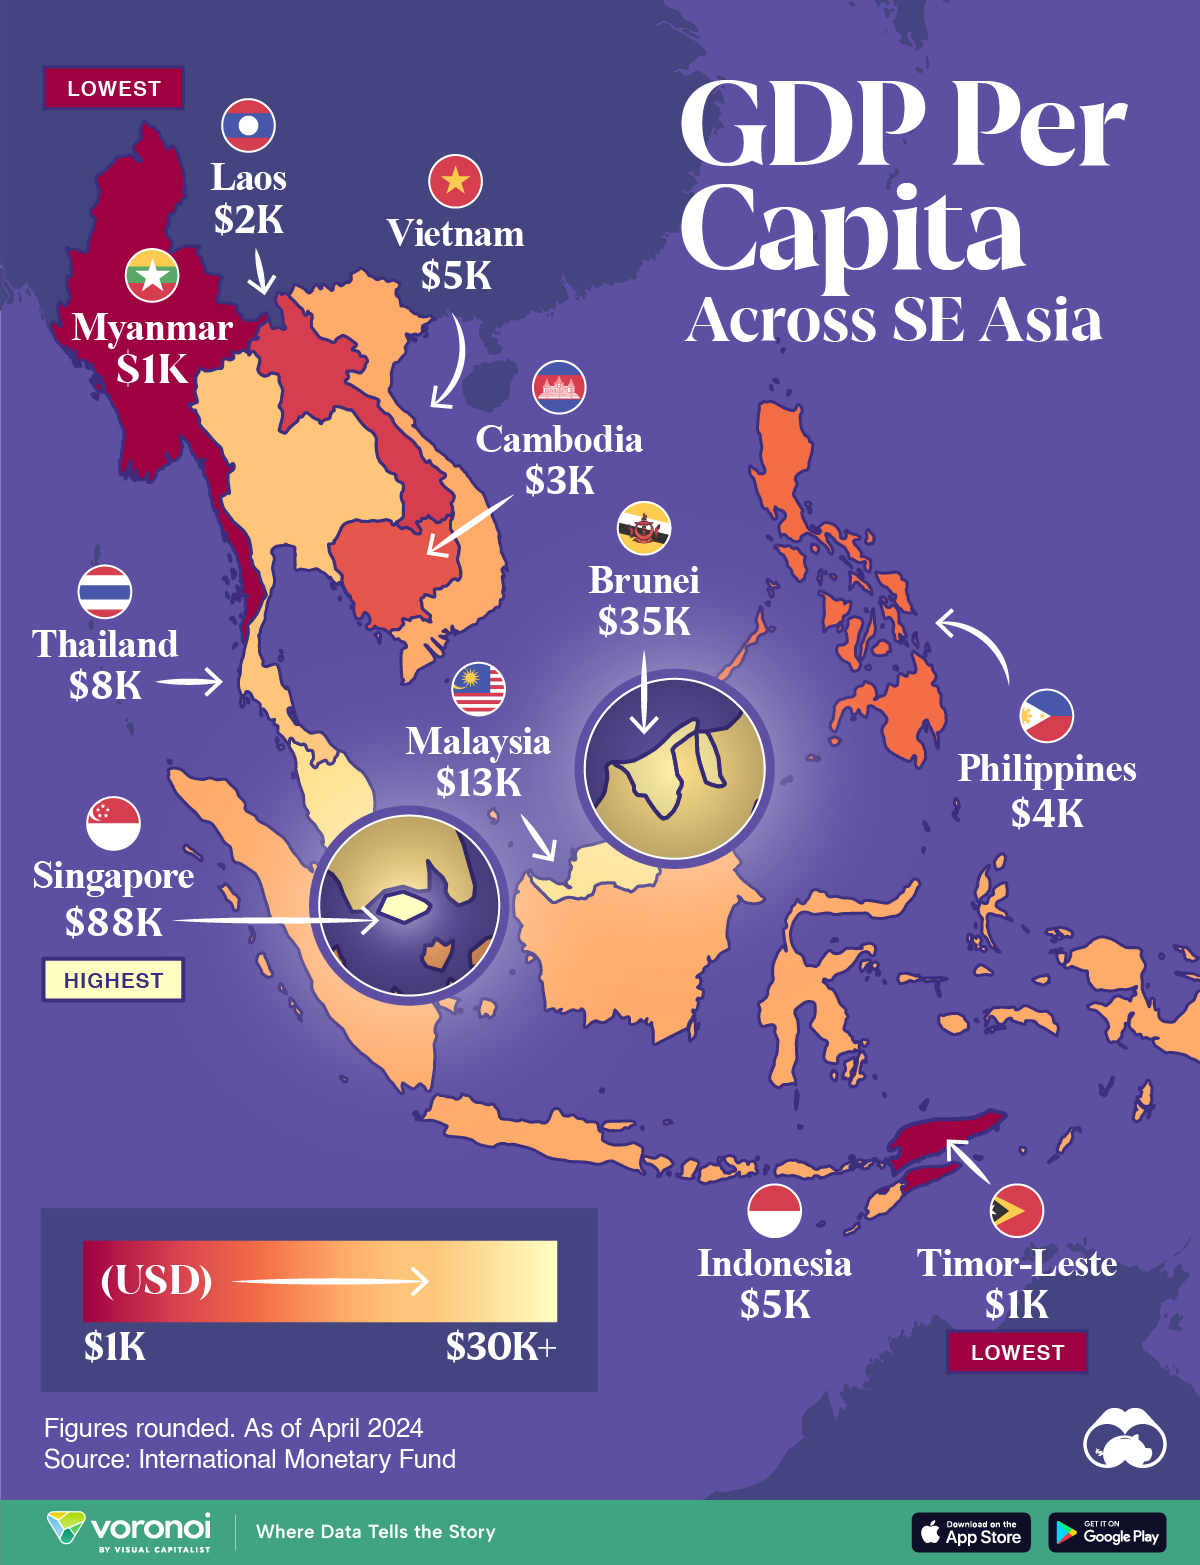
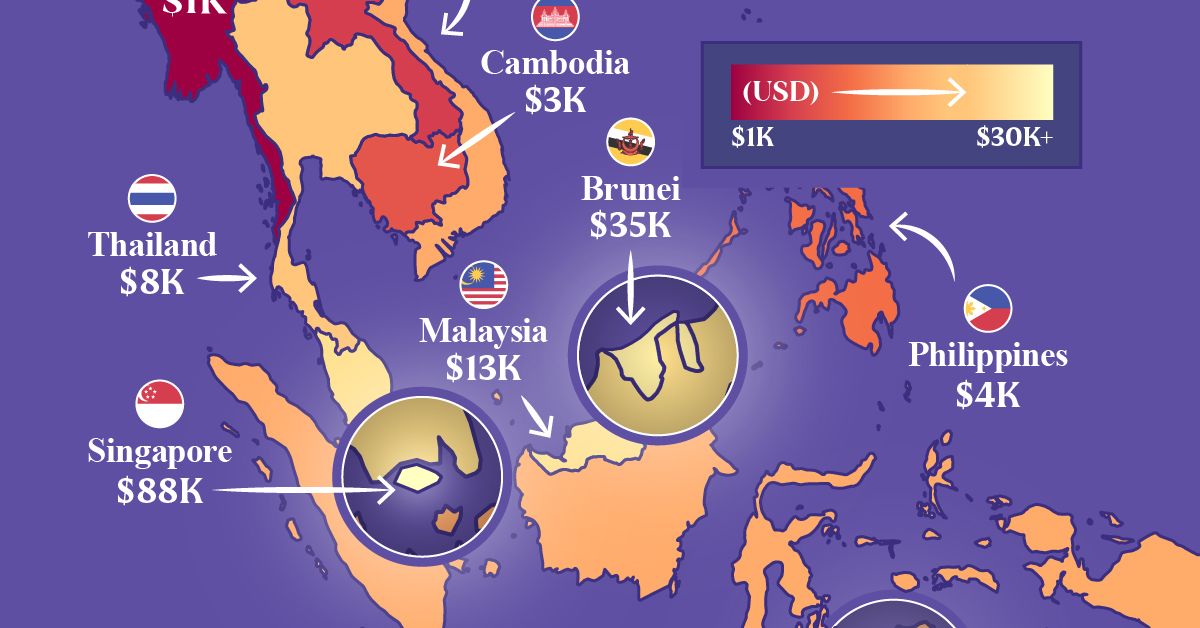
In this map, we compare Southeast Asia’s GDP per capita levels. Data is in current U.S. dollars, sourced from the International Monetary Fund’s DataMapper tool, last updated April 2024.
Ranked: Southeast Asian Countries by GDP Per Capita
Singapore stands head-and-shoulders above the rest of the region with a per capita GDP past $88,000. It is also, incidentally, one of the richest nations in the world by this metric.
The 734 km² country has only 5.6 million residents and very few natural resources. However the country’s strategic location makes it a center for trade and commerce.
| Country | GDP Per Capita |
|---|---|
| 🇸🇬 Singapore | $88,450 |
| 🇧🇳 Brunei | $35,110 |
| 🇲🇾 Malaysia | $13,310 |
| 🇹🇭 Thailand | $7,810 |
| 🇮🇩 Indonesia | $5,270 |
| 🇻🇳 Vietnam | $4,620 |
| 🇵🇭 Philippines | $4,130 |
| 🇰🇭 Cambodia | $2,630 |
| 🇱🇦 Laos | $1,980 |
| 🇹🇱 Timor-Leste | $1,450 |
| 🇲🇲 Myanmar | $1,250 |
Note: Figures are rounded.
This is in sharp contrast to Brunei, Southeast Asia’s next richest country, with a per capita GDP of $35,110.
Oil is a critical part of Brunei’s economy, making it both very wealthy, but landing it in a vulnerable, resource-dependent position. Oil and gas revenues contribute half the country’s entire revenue receipts.
Two countries known for their large tourism sectors, Malaysia and Thailand rank third and fourth, at $13,310 and $7,810 respectively.
Finally, Southeast Asia’s largest economy, and the world’s fourth-most populous country Indonesia, rounds out the top five with a GDP per capita of $5,270.

-

 Politics5 days ago
Charted: What Southeast Asia Thinks About China & the U.S.
-

 Misc2 weeks ago
Visualizing the Most Common Pets in the U.S.
-

 Culture2 weeks ago
The World’s Top Media Franchises by All-Time Revenue
-

 Best of2 weeks ago
Best Visualizations of April on the Voronoi App
-

 Wealth1 week ago
Charted: Which Country Has the Most Billionaires in 2024?
-

 Markets1 week ago
The Top Private Equity Firms by Country
-

 Markets1 week ago
The Best U.S. Companies to Work for According to LinkedIn
-

 Economy1 week ago
Ranked: The Top 20 Countries in Debt to China