China
Charted: Youth Unemployment in the OECD and China


Charted: Youth Unemployment in the OECD and China
In nearly every country in the world, youth unemployment is much higher than general unemployment.
Unfortunately, the pandemic only exacerbated matters. During a crucial stretch of their early careers, young adults were locked out of entry-level jobs, destroying their ability to pick up work experience and potentially impacting their long-term earnings.
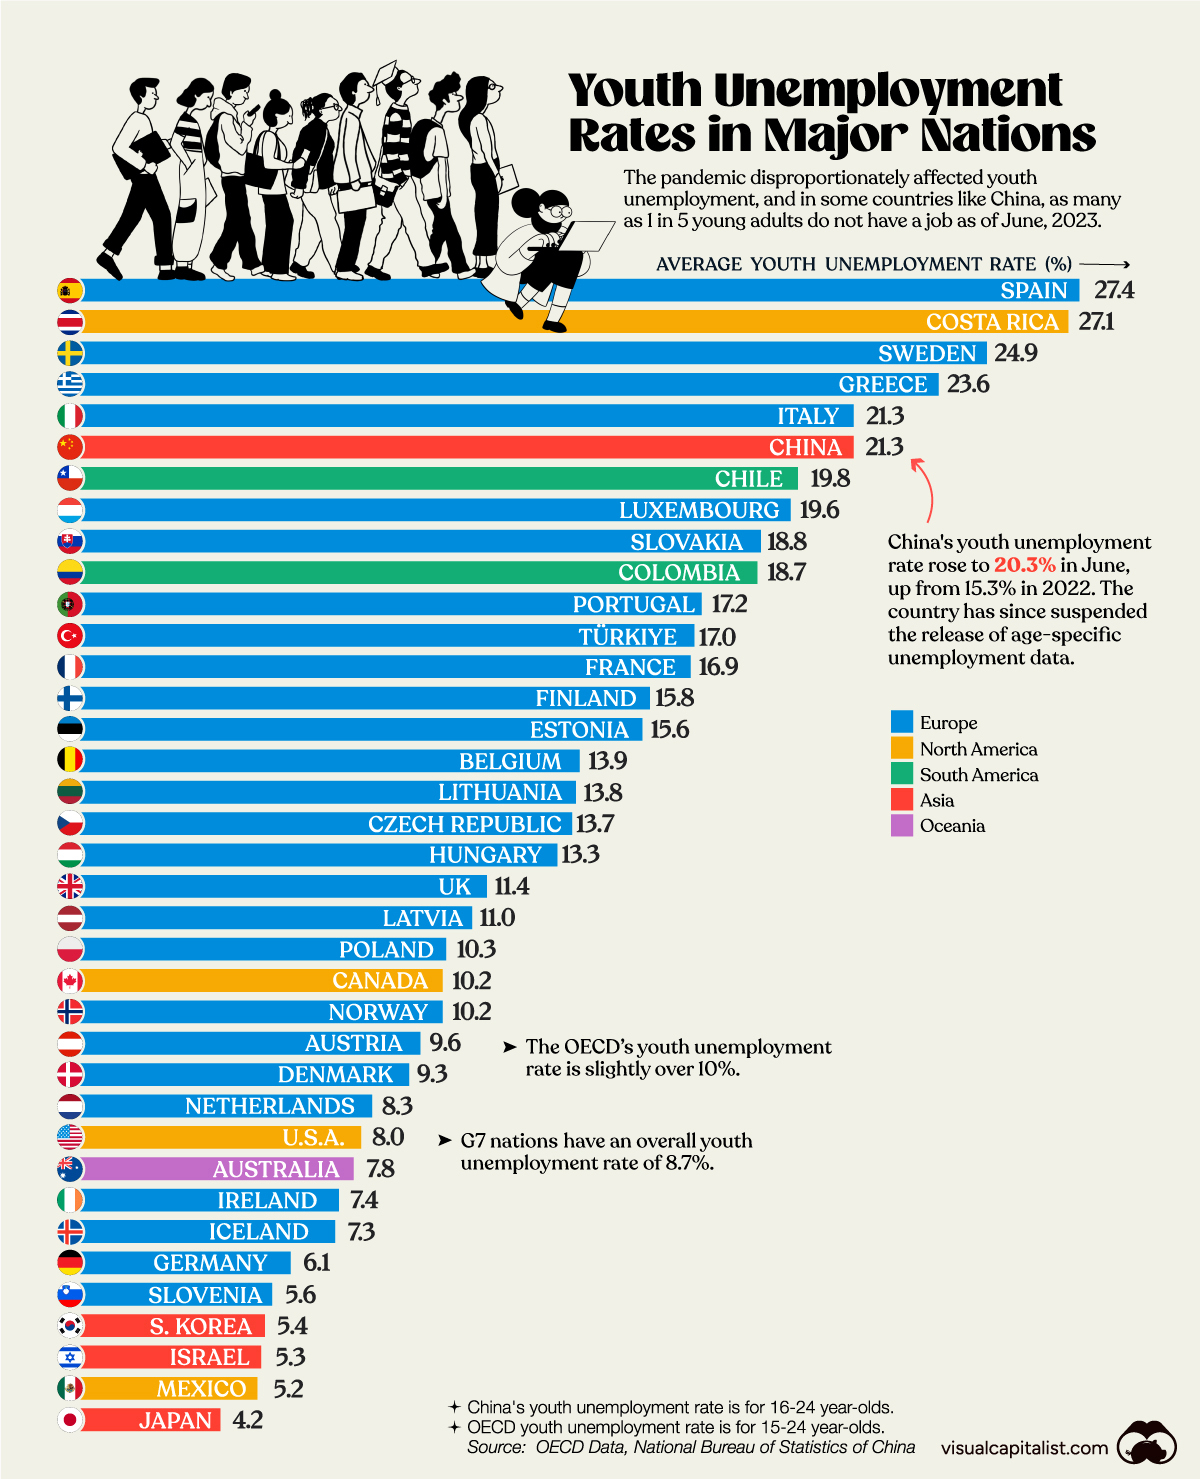
Now, nearly three years after COVID-19 first hit, young adults from some countries, like China, are struggling to find jobs. Using data from the OECD and the National Bureau of Statistics of China, we chart out the youth unemployment rate for 37 countries.
Ranked: Countries With the Highest Youth Unemployment
At the top of the list, Spain has the highest youth unemployment in the OECD, with nearly one in three young adults unable to find a job.
A mismatch between educational qualifications and the labor market has been cited as a significant reason for Spain’s lack of employed adults between the ages of 15–24.
Meanwhile, the country’s reliance on temporary contracts and dependence on seasonal sectors—like tourism—to generate jobs are some of the many reasons for its persistently high reported unemployment across demographic groups.
Listed below is the youth unemployment rate for all the OECD countries, and China, as of the second quarter of 2023.
| Rank | Country | Average Youth Unemployment Rate |
|---|---|---|
| 1 | 🇪🇸 Spain | 27.4% |
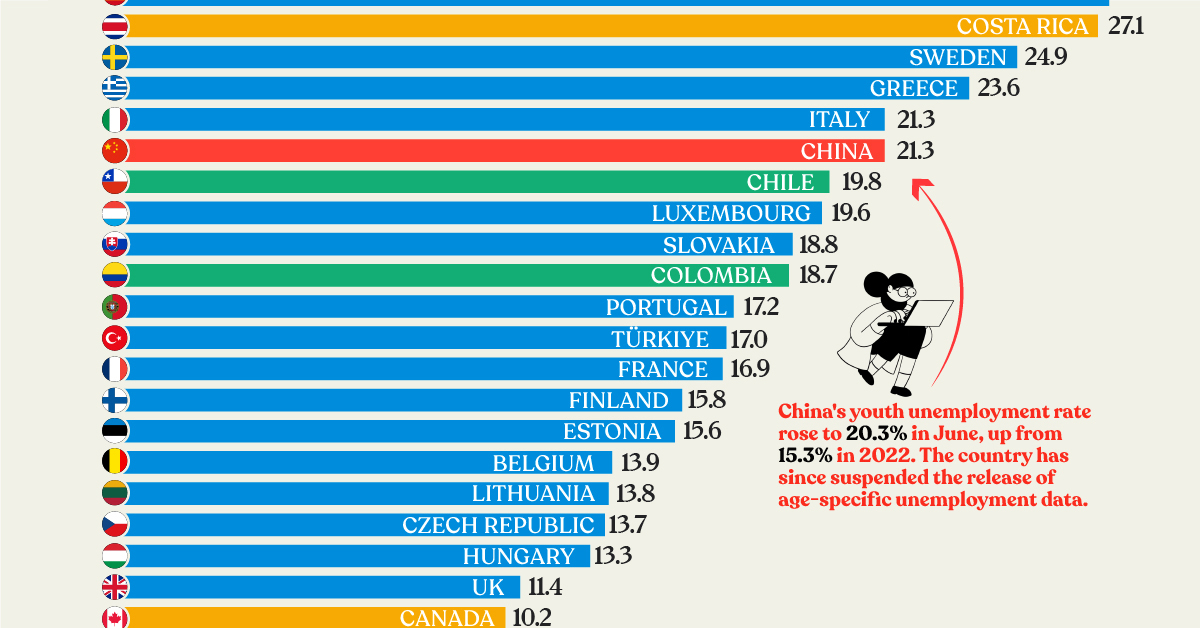
| 2 | 🇨🇷 Costa Rica | 27.1% |
| 3 | 🇸🇪 Sweden | 24.9% |
| 4 | 🇬🇷 Greece | 23.6% |
| 5 | 🇨🇳 China | 21.3% |
| 6 | 🇮🇹 Italy | 21.3% |
| 7 | 🇨🇱 Chile | 19.8% |
| 8 | 🇱🇺 Luxembourg | 19.6% |
| 9 | 🇸🇰 Slovakia | 18.8% |
| 10 | 🇨🇴 Colombia | 18.7% |
| 11 | 🇵🇹 Portugal | 17.2% |
| 12 | 🇹🇷 Türkiye | 17.0% |
| 13 | 🇫🇷 France | 16.9% |
| 14 | 🇫🇮 Finland | 15.8% |
| 15 | 🇪🇪 Estonia | 15.6% |
| 16 | 🇧🇪 Belgium | 13.9% |
| 17 | 🇱🇹 Lithuania | 13.8% |
| 18 | 🇨🇿 Czech Republic | 13.7% |
| 19 | 🇭🇺 Hungary | 13.3% |
| 20 | 🇬🇧 United Kingdom | 11.4% |
| 21 | 🇱🇻 Latvia | 11.0% |
| 22 | 🇵🇱 Poland | 10.3% |
| 23 | 🇳🇴 Norway | 10.2% |
| 24 | 🇨🇦 Canada | 10.2% |
| 25 | 🇦🇹 Austria | 9.6% |
| 26 | 🇩🇰 Denmark | 9.3% |
| 27 | 🇳🇱 Netherlands | 8.3% |
| 28 | 🇺🇸 United States | 8.0% |
| 29 | 🇦🇺 Australia | 7.8% |
| 30 | 🇮🇪 Ireland | 7.4% |
| 31 | 🇮🇸 Iceland | 7.3% |
| 32 | 🇩🇪 Germany | 6.1% |
| 33 | 🇸🇮 Slovenia | 5.6% |
| 34 | 🇰🇷 Korea | 5.4% |
| 35 | 🇮🇱 Israel | 5.3% |
| 36 | 🇲🇽 Mexico | 5.2% |
| 37 | 🇯🇵 Japan | 4.2% |
Announced in June, China’s youth unemployment rate has climbed to 21.3%, a meteoric rise since May 2018, when it was below 10%. The Chinese economy is in the midst of a slowdown and its steadily climbing youth unemployment prompted the government to suspend age-specific unemployment data for the near future.
On the other side of the spectrum, in Japan, only 4.2% of young adults are without a job. A key reason for this is Japan’s shrinking and aging population that’s made for a tight labor market.
Youth Unemployment: Men vs Women
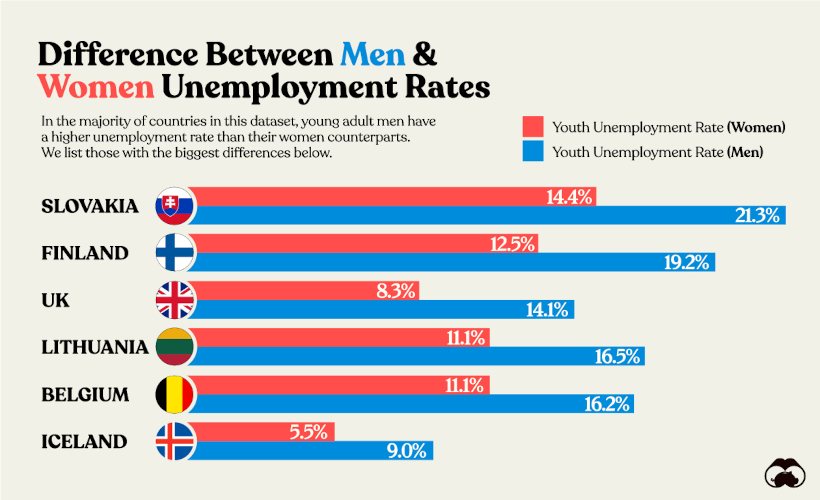
In most OECD countries, it’s common to see young men experiencing a higher unemployment rate compared to young women.
This contrasts with the trend across all age groups in the OECD, where the unemployment rate is 6.3% for women and 6% for men.
We visualize the countries in the dataset with the biggest gaps in youth unemployment below.
There is no singular reason that explains this common gap.
Across the OECD, more young women opt for tertiary education than young men, which may lead to better employment prospects. At the same time women are overrepresented in the health and social welfare sectors—both growing rapidly thanks to an aging population—that may make it easier for them to find jobs.
Why Does Tracking Youth Unemployment Matter?
Aside from being an indicator of general opportunities within a country, youth unemployment is a key metric to track, because it can be a bellwether for future economic prospects.
High rates of youth unemployment also correlate to brain drain within a country, as young adults move elsewhere to find better jobs.
Finally, large increases in unemployed youth have historically led to the potential of civil unrest, which makes it a politically-charged metric to identify and monitor for governments.
Where Does This Data Come From?
Sources: OECD Data and National Bureau of Statistics of China.
Note: China’s youth unemployment rate is for 16–24 year-olds. The OECD youth unemployment rate is for 15–24 year-olds.


Politics
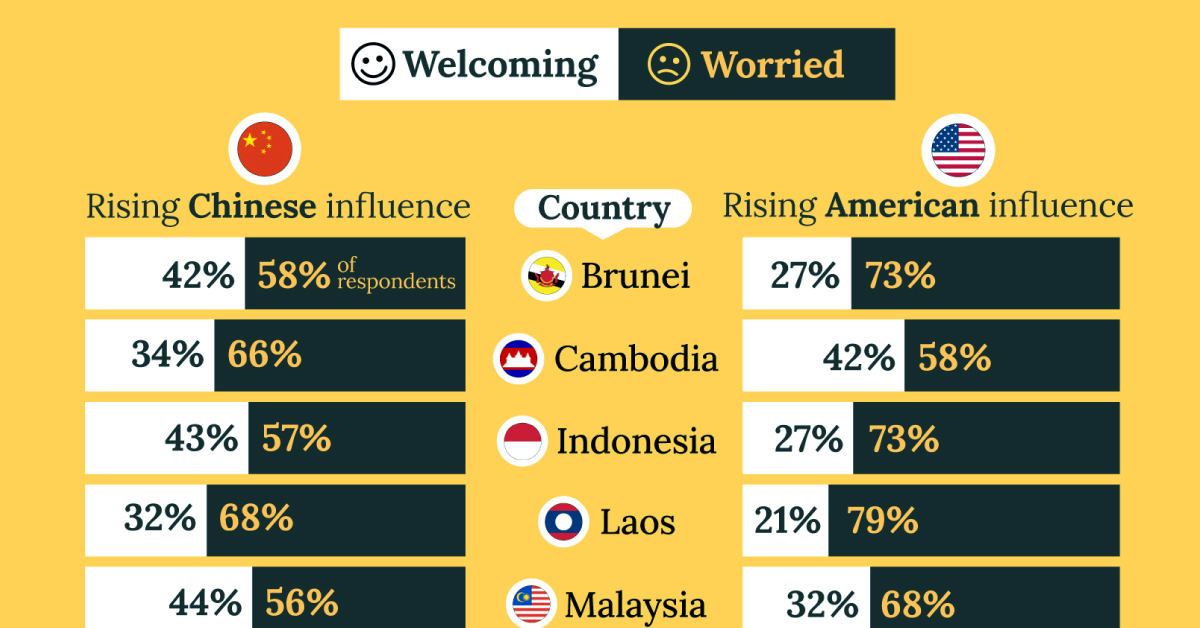
Charted: What Southeast Asia Thinks About China & the U.S.
A significant share of respondents from an ASEAN-focused survey are not happy about rising American and Chinese influence in the region.
What Southeast Asia Thinks About China & the U.S.
This was originally posted on our Voronoi app. Download the app for free on iOS or Android and discover incredible data-driven charts from a variety of trusted sources.
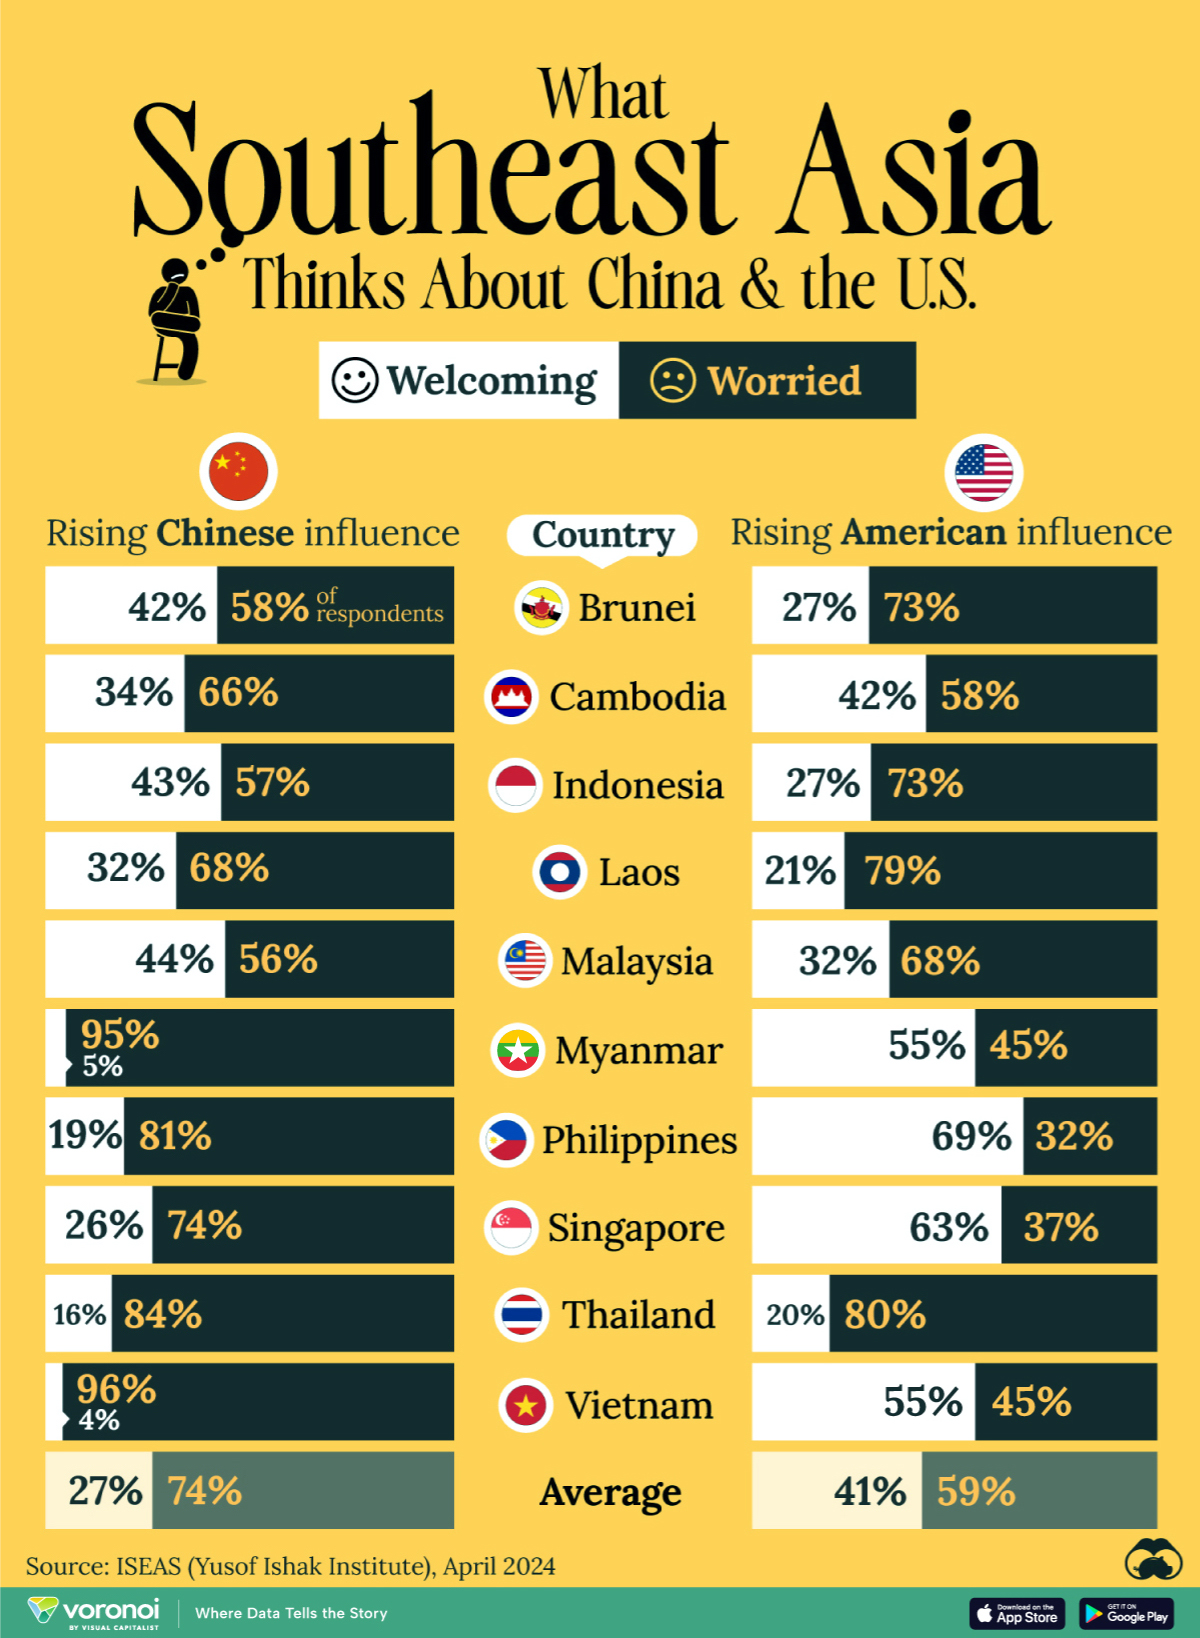
This chart visualizes the results of a 2024 survey conducted by the ASEAN Studies Centre at the ISEAS-Yusof Ishak Institute. Nearly 2,000 respondents were asked if they were worried or welcoming of rising Chinese and American geopolitical influence in their country.
The countries surveyed all belong to the Association of Southeast Asian Nations (ASEAN), a political and economic union of 10 states in Southeast Asia.
Feelings Towards China
On average, a significant share of respondents from all 10 countries are worried about rising influence from both the U.S. and China.
However, overall skepticism is higher for China, at 74% (versus 59% for U.S.).
| Country | Worried About Growing 🇨🇳 Influence | Welcome Growing 🇨🇳 Influence |
|---|---|---|
| 🇧🇳 Brunei | 58% | 42% |
| 🇰🇭 Cambodia | 66% | 34% |
| 🇮🇩 Indonesia | 57% | 43% |
| 🇱🇦 Laos | 68% | 32% |
| 🇲🇾 Malaysia | 56% | 44% |
| 🇲🇲 Myanmar | 95% | 5% |
| 🇵🇭 Philippines | 81% | 19% |
| 🇸🇬 Singapore | 74% | 26% |
| 🇹🇭 Thailand | 84% | 16% |
| 🇻🇳 Vietnam | 96% | 4% |
| Average | 74% | 27% |
The recently-cooled but still active territorial concerns over the South China Sea may play a significant role in these responses, especially in countries which are also claimants over the sea.
For example, in Vietnam over 95% of respondents said they were worried about China’s growing influence.
Feelings Towards America
Conversely, rising American influence is welcomed in two countries with competing claims in the South China Sea, the Philippines (69%) and Vietnam (55%).
| Country | Worried About Growing 🇺🇸 Influence | Welcome Growing 🇺🇸 Influence |
|---|---|---|
| 🇧🇳 Brunei | 73% | 27% |
| 🇰🇭 Cambodia | 58% | 42% |
| 🇮🇩 Indonesia | 73% | 27% |
| 🇱🇦 Laos | 79% | 21% |
| 🇲🇾 Malaysia | 68% | 32% |
| 🇲🇲 Myanmar | 45% | 55% |
| 🇵🇭 Philippines | 32% | 69% |
| 🇸🇬 Singapore | 37% | 63% |
| 🇹🇭 Thailand | 80% | 20% |
| 🇻🇳 Vietnam | 45% | 55% |
| Average | 59% | 41% |
Despite this, on a regional average, more respondents worry about growing American influence (59%) than they welcome it (41%).
Interestingly, it seems almost every ASEAN nation has a clear preference for one superpower over the other.
The only exception is Thailand, where those surveyed were not a fan of either option, with 84% worried about China, and 80% worried about the U.S.

-

 Markets6 days ago
Visualized: Interest Rate Forecasts for Advanced Economies
-

 Markets2 weeks ago
Economic Growth Forecasts for G7 and BRICS Countries in 2024
-

 Wealth2 weeks ago
Charted: Which City Has the Most Billionaires in 2024?
-

 Technology2 weeks ago
All of the Grants Given by the U.S. CHIPS Act
-

 Green2 weeks ago
The Carbon Footprint of Major Travel Methods
-

 United States1 week ago
Visualizing the Most Common Pets in the U.S.
-

 Culture1 week ago
The World’s Top Media Franchises by All-Time Revenue
-

 voronoi1 week ago
Best Visualizations of April on the Voronoi App