Maps
Mapped: The Deadliest Earthquakes of the 21st Century
View the full-size earthquake map
Mapped: The Deadliest Earthquakes of the 21st Century
On September 8, 2023, a powerful earthquake rocked Morocco. With its epicenter located in the Atlas Mountains and structural damage being done to the historical city center of Marrakesh, the 6.8-magnitude quake will likely have a death toll in the thousands.
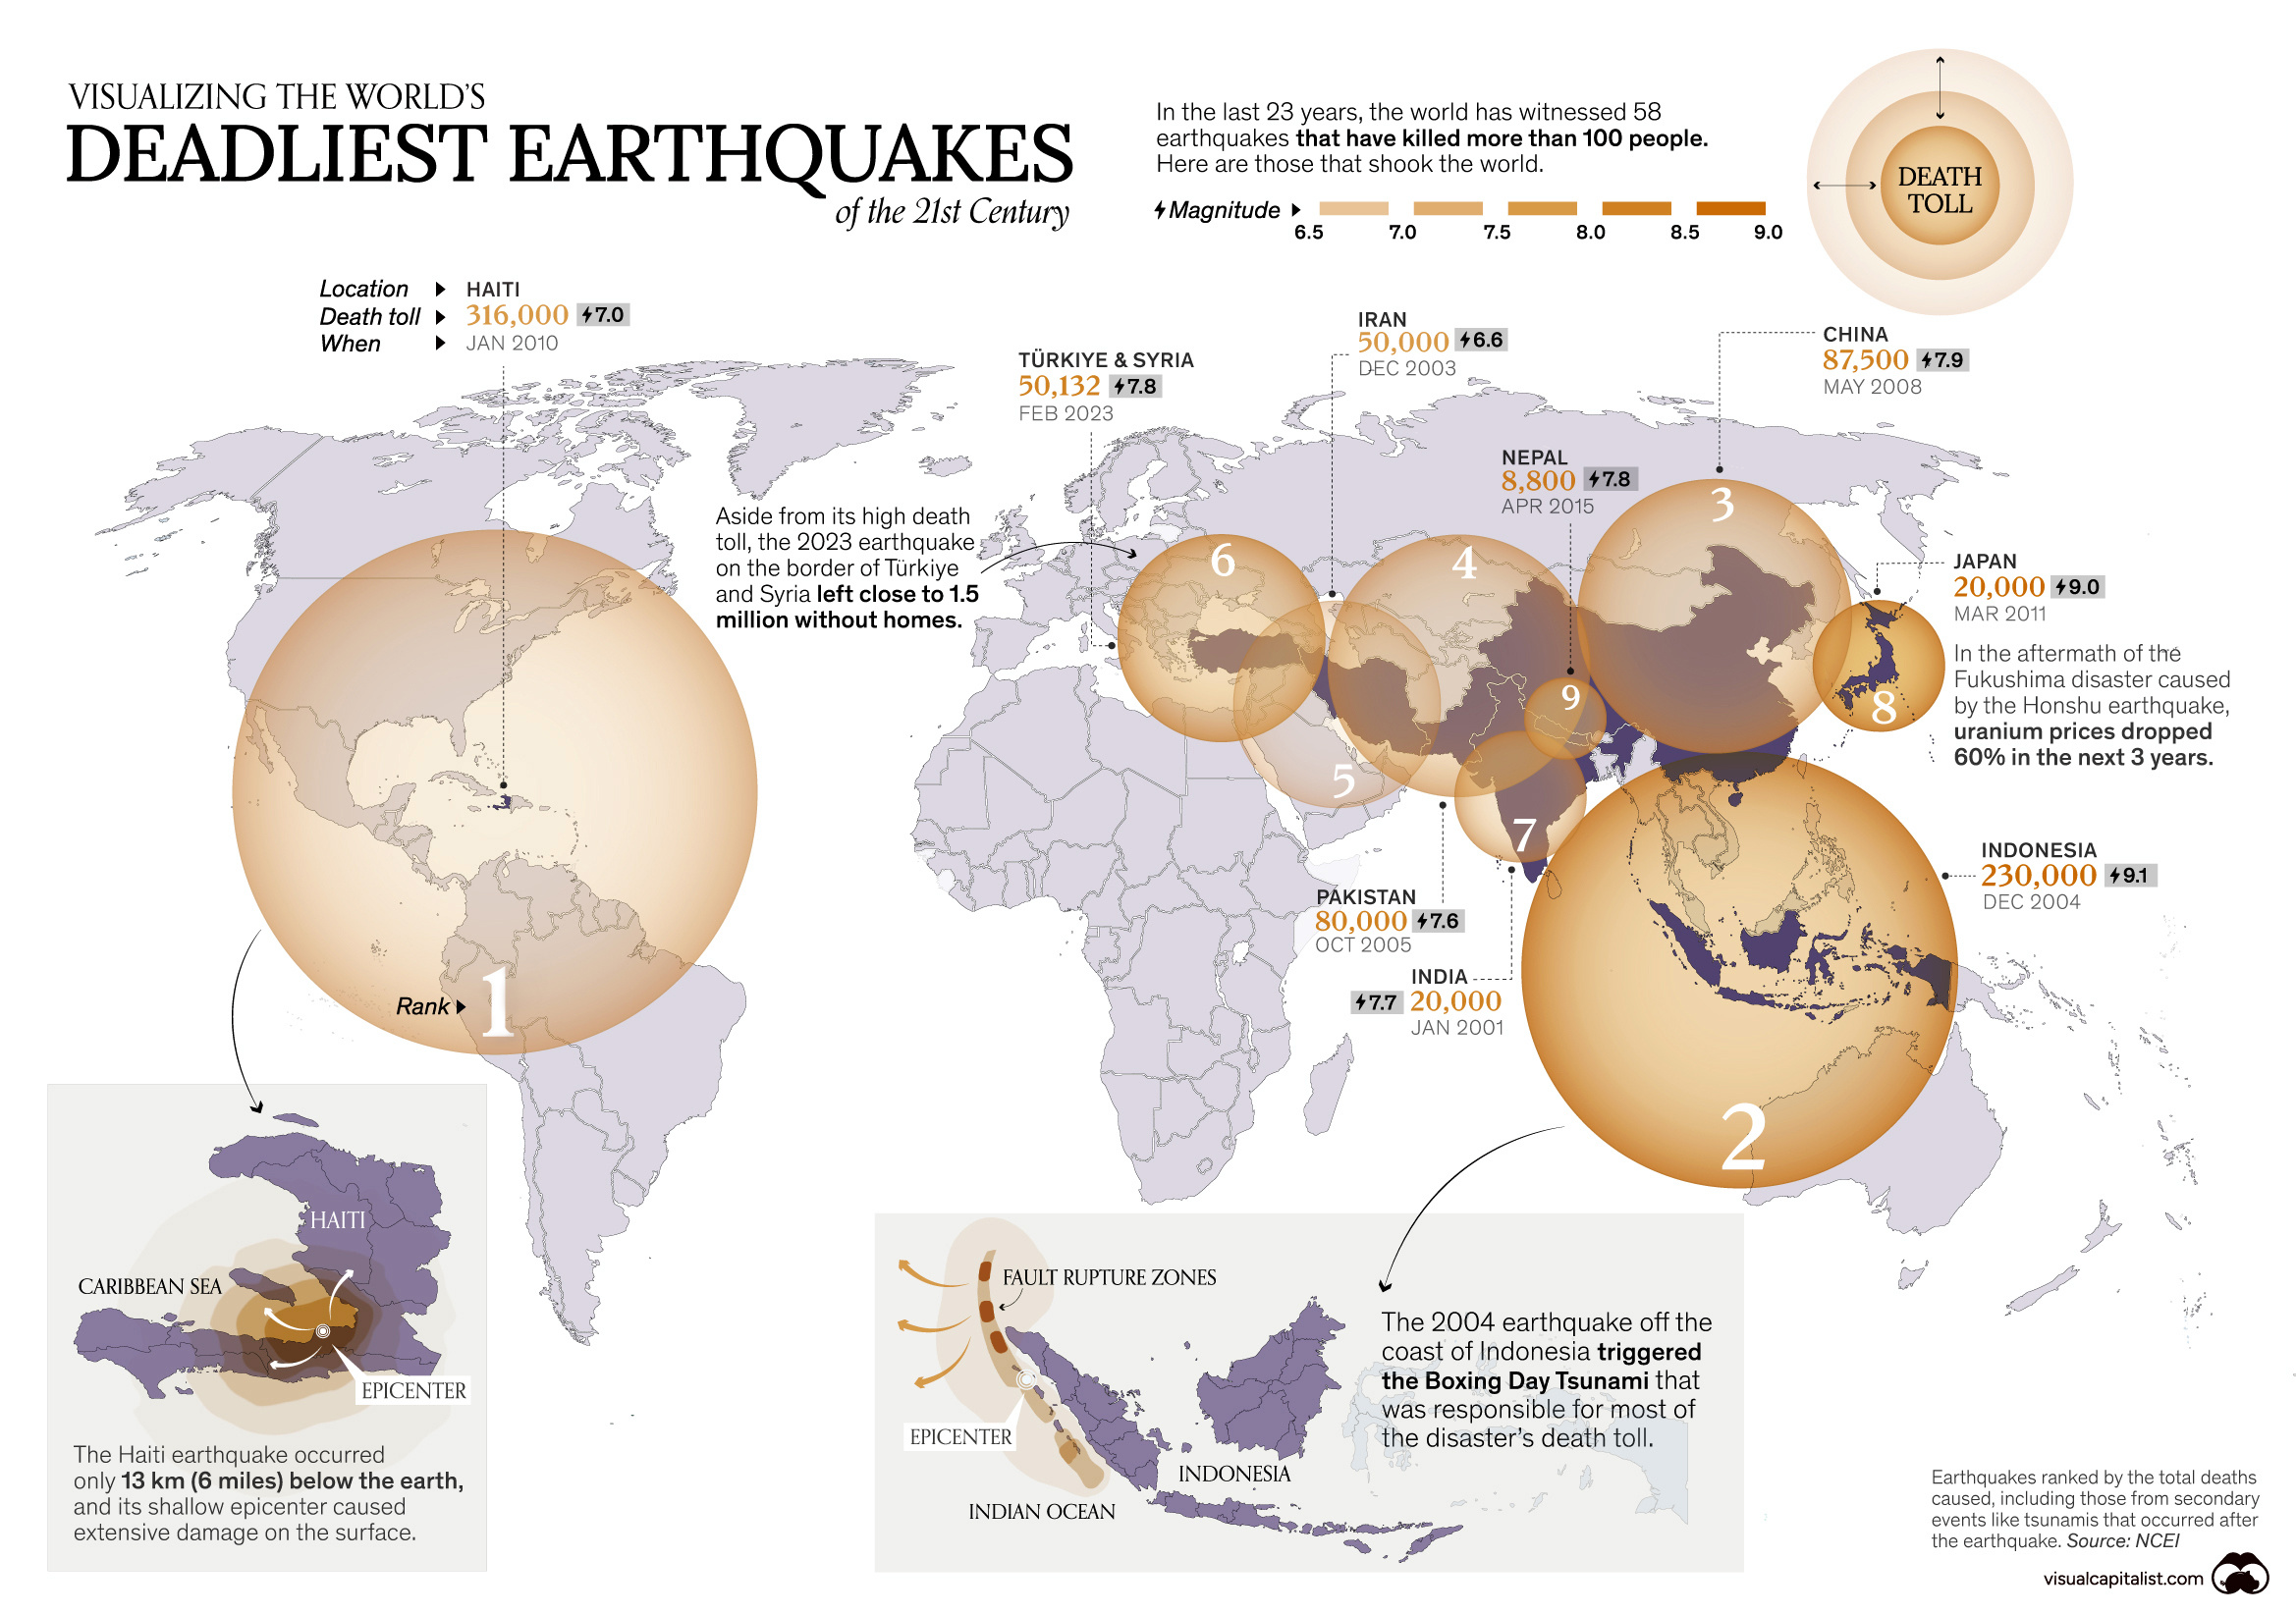
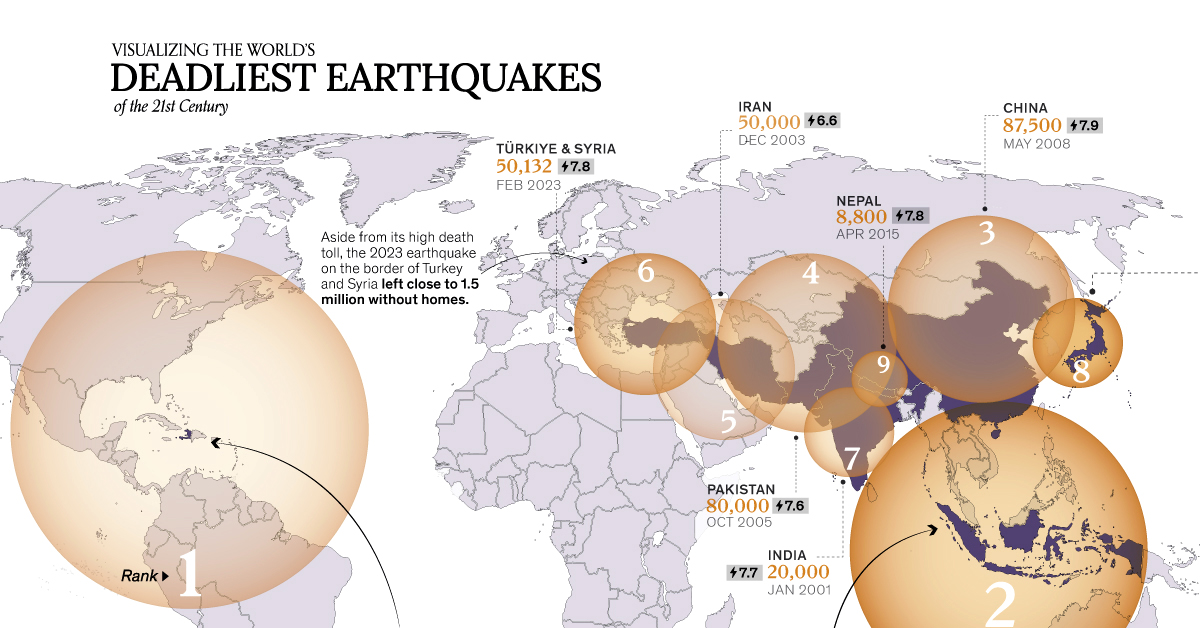
With these recent events in mind, we use data from the National Centers for Environment Information (NCES) to map out the epicenters of the nine deadliest earthquakes in the 21st century so far, by their total death toll. This includes casualties from secondary events—like tsunamis—after each earthquake.
Earthquakes By Death Toll (2000–2023)
We delve into some of the deadliest earthquakes in recent history.
Haiti, 2010
On January 12th, 2010, a 7.0 magnitude earthquake hit the capital Port-au-Prince. The earthquake’s shallow epicenter—only six miles beneath the surface—caused most of the force to be directed close to where people lived. By the end of the month, after 52 aftershocks rocked the island, the disaster had claimed more than 300,000 lives—the deadliest earthquake in the 21st century thus far.
The extensive destruction led to global support, but slow recovery sparked criticism of government inaction. In 2017, the UN reported 2.5 million Haitians still required aid.
Indonesia, 2004
December 26th, 2004: A 9.1 earthquake occurred off the coast of Indonesia, deep under the ocean. It was the strongest earthquake in this century and the third-most powerful since 1900.
It triggered the worst tsunami recorded in history, causing 230,000 deaths mainly in Indonesia, Sri Lanka, Thailand, and India.
Here’s a list of the deadliest earthquakes, by death toll, in the 21st century.
| Rank | Date | Location | Total Deaths | Magnitude |
|---|---|---|---|---|
| 1 | Jan, 2010 | 🇭🇹 Haiti | 316,000 | 7.0 |
| 2 | Dec, 2004 | 🇮🇩 Indonesia | 227,899 | 9.1 |
| 3 | May, 2008 | 🇨🇳 China | 87,652 | 7.9 |
| 4 | Oct, 2005 | 🇵🇰 Pakistan | 76,213 | 7.6 |
| 5 | Feb, 2023 | 🇹🇷 Türkiye | 56,697 | 7.8 |
| 6 | Dec, 2003 | 🇮🇷 Iran | 31,000 | 6.6 |
| 7 | Jan, 2001 | 🇮🇳 India | 20,005 | 7.6 |
| 8 | March, 2011 | 🇯🇵 Japan | 18,428 | 9.1 |
| 9 | April, 2015 | 🇳🇵 Nepal | 8,957 | 7.8 |
| 10 | May, 2006 | 🇮🇩 Indonesia | 5,749 | 6.3 |
| 11 | Sep, 2018 | 🇮🇩 Indonesia | 4,340 | 7.5 |
| 12 | May, 2003 | 🇩🇿 Algeria | 2,287 | 6.8 |
| 13 | Aug, 2021 | 🇭🇹 Haiti | 2,248 | 7.2 |
| 14 | April, 2010 | 🇨🇳 China | 2,220 | 6.9 |
| 15 | March, 2005 | 🇮🇩 Indonesia | 1,313 | 8.6 |
| 16 | Sep, 2009 | 🇮🇩 Indonesia | 1,117 | 7.5 |
| 17 | June, 2022 | 🇦🇫 Afghanistan | 1,039 | 5.9 |
| 18 | March, 2002 | 🇦🇫 Afghanistan | 1,000 | 6.1 |
| 19 | Jan, 2001 | 🇸🇻 El Salvador | 844 | 7.7 |
| 20 | Sep, 2013 | 🇵🇰 Pakistan | 825 | 7.7 |
| 21 | July, 2006 | 🇮🇩 Indonesia | 802 | 7.7 |
| 22 | April, 2016 | 🇪🇨 Ecuador | 663 | 7.8 |
| 23 | Nov, 2022 | 🇮🇩 Indonesia | 635 | 5.6 |
| 24 | Nov, 2017 | 🇮🇷 Iran | 630 | 7.3 |
| 25 | Feb, 2004 | 🇲🇦 Morocco | 628 | 6.4 |
| 26 | Aug, 2014 | 🇨🇳 China | 615 | 6.2 |
| 27 | Feb, 2005 | 🇮🇷 Iran | 612 | 6.4 |
| 28 | Oct, 2011 | 🇹🇷 Turkey | 604 | 7.1 |
| 29 | Aug, 2018 | 🇮🇩 Indonesia | 560 | 6.9 |
| 30 | Feb, 2010 | 🇨🇱 Chile | 558 | 8.8 |
| 31 | Aug, 2007 | 🇵🇪 Peru | 514 | 8.0 |
| 32 | Oct, 2010 | 🇮🇩 Indonesia | 431 | 7.8 |
| 33 | Oct, 2015 | 🇦🇫 Afghanistan | 399 | 7.5 |
| 34 | Sep, 2017 | 🇲🇽 Mexico | 369 | 7.1 |
| 35 | Feb, 2001 | 🇸🇻 El Salvador | 315 | 6.6 |
| 36 | April, 2009 | 🇮🇹 Italy | 309 | 6.3 |
| 37 | Aug, 2012 | 🇮🇷 Iran | 306 | 6.5 |
| 38 | Aug, 2016 | 🇮🇹 Italy | 299 | 6.2 |
| 39 | June, 2002 | 🇮🇷 Iran | 261 | 6.5 |
| 40 | Feb, 2003 | 🇨🇳 China | 261 | 6.3 |
| 41 | Oct, 2013 | 🇵🇭 Philippines | 222 | 7.1 |
| 42 | Oct, 2008 | 🇵🇰 Pakistan | 215 | 6.4 |
| 43 | April, 2013 | 🇨🇳 China | 196 | 6.6 |
| 44 | Sep, 2009 | 🇼🇸 Samoa Islands | 192 | 8.1 |
| 45 | Feb, 2011 | 🇳🇿 New Zealand | 185 | 6.1 |
| 46 | May, 2003 | 🇹🇷 Turkey | 177 | 6.4 |
| 47 | March, 2002 | 🇦🇫 Afghanistan | 166 | 7.4 |
| 48 | Feb, 2018 | 🇵🇬 Papua New Guinea | 145 | 7.5 |
| 49 | Oct, 2020 | 🇬🇷 Greece | 118 | 7.0 |
| 50 | Sep, 2022 | 🇨🇳 China | 118 | 6.6 |
| 51 | May, 2015 | 🇳🇵 Nepal | 117 | 7.3 |
| 52 | Feb, 2016 | 🇹🇼 Taiwan | 117 | 6.4 |
| 53 | Sep, 2011 | 🇮🇳 India | 111 | 6.9 |
| 54 | Jan, 2021 | 🇮🇩 Indonesia | 105 | 6.2 |
| 55 | March, 2011 | 🇲🇲 Myanmar | 104 | 6.8 |
| 56 | Dec, 2016 | 🇮🇩 Indonesia | 104 | 6.5 |
| 57 | June, 2000 | 🇮🇩 Indonesia | 103 | 7.9 |
| 58 | June, 2001 | 🇵🇪 Peru | 103 | 8.4 |
Türkiye and Syria, 2023
February 6, 2023: Two earthquakes, also with shallow epicenters (5 miles deep), hit the border region between Türkiye and Syria, causing widespread damage in both countries and claiming more than 50,000 lives. Bad weather conditions—including snow, ice, and winter storms—inhibited search and rescue efforts.
In Syria, international sanctions prevented foreign charities and families from sending money to the country, which led to the U.S. suspending the sanctions for 180 days.
Japan, 2011
March 11, 2011: Another undersea earthquake—also 9.1 magnitude—occurred off the coast of Japan, triggering a deadly tsunami which flattened parts of the country 30 minutes later.
The high waves also damaged Fukushima’s Nuclear Plant’s emergency diesel generators leading to reactor meltdowns, and a release of radioactive waste. In total, 18,000 people lost their lives from the earthquake and tsunami.
How Does Earthquake Data Help With Disaster Preparedness?
Thanks to the study of plate tectonics, scientists know where earthquakes usually occur, even if they don’t know when precisely. For example countries along the “Ring of Fire”—a hotbed of earthquake and volcanic activity—witness hundreds of earthquakes a year, though most are not strong enough to cause any damage.
However, with deadly earthquakes, other factors, including epicenter depth, location near populous areas, and proximity to secondary events—tsunamis—can play a far bigger role in death tolls.
Disaster preparedness and swift government action can mitigate many secondary casualties as seen comparing the vastly different death tolls of the 2004 and 2011 tsunamis.


Economy
Mapped: Southeast Asia’s GDP Per Capita, by Country
Indonesia, the region’s largest economy, makes the top five in this map exploring Southeast Asia’s GDP per capita levels.
Mapped: Southeast Asia’s GDP Per Capita, by Country
This was originally posted on our Voronoi app. Download the app for free on iOS or Android and discover incredible data-driven charts from a variety of trusted sources.
In 1937, as America navigated the Great Depression, Russian-born economist Simon Kuznets presented a novel idea on measuring a country’s economy. And thus, gross domestic product (GDP) was born.
Nearly eight decades later, measuring GDP, and GDP per capita—which helps make data comparable between populations—has become a benchmark statistic to compare and contrast countries’ economies and productivity.
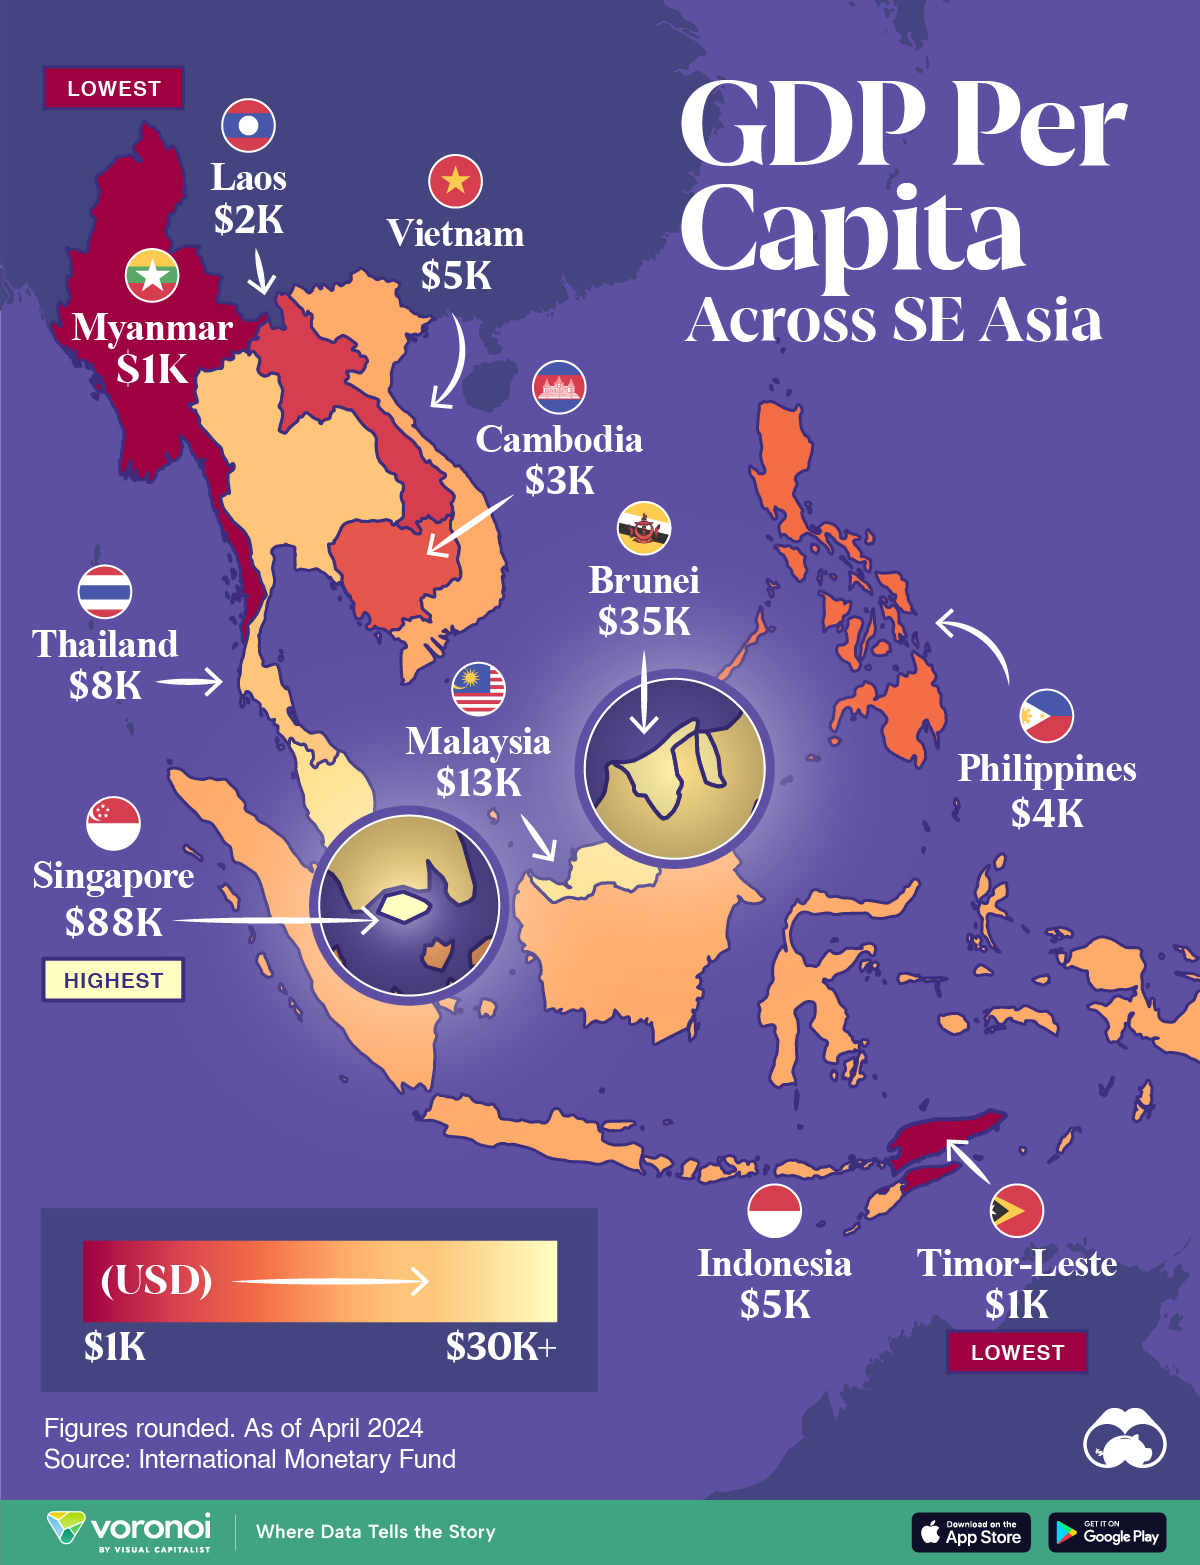
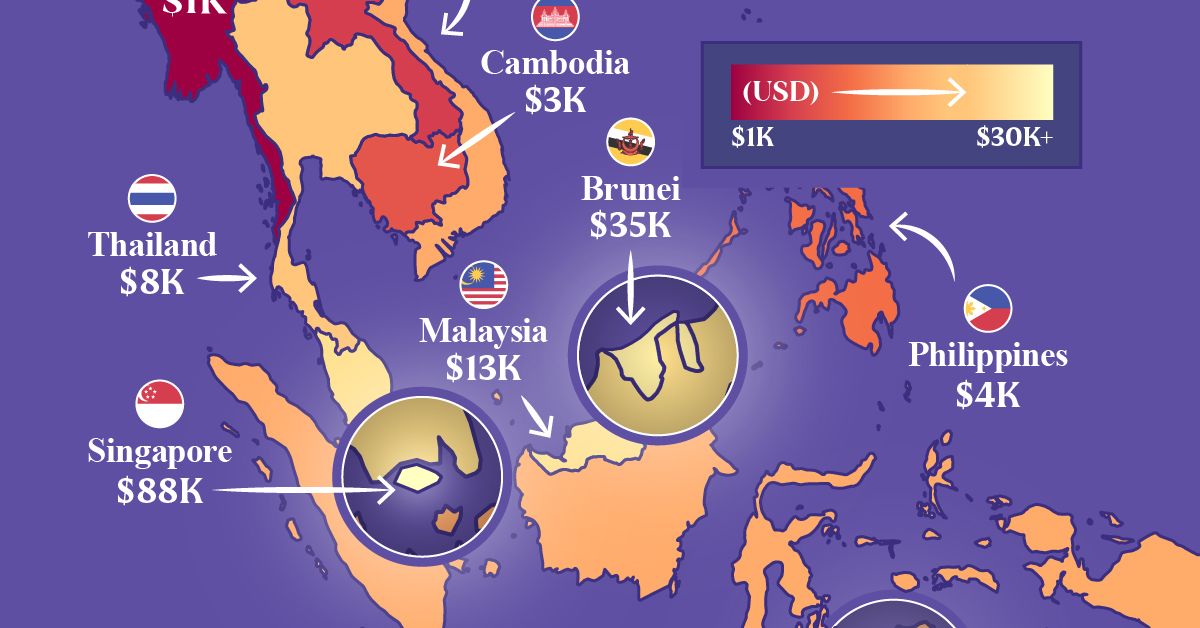
In this map, we compare Southeast Asia’s GDP per capita levels. Data is in current U.S. dollars, sourced from the International Monetary Fund’s DataMapper tool, last updated April 2024.
Ranked: Southeast Asian Countries by GDP Per Capita
Singapore stands head-and-shoulders above the rest of the region with a per capita GDP past $88,000. It is also, incidentally, one of the richest nations in the world by this metric.
The 734 km² country has only 5.6 million residents and very few natural resources. However the country’s strategic location makes it a center for trade and commerce.
| Country | GDP Per Capita |
|---|---|
| 🇸🇬 Singapore | $88,450 |
| 🇧🇳 Brunei | $35,110 |
| 🇲🇾 Malaysia | $13,310 |
| 🇹🇭 Thailand | $7,810 |
| 🇮🇩 Indonesia | $5,270 |
| 🇻🇳 Vietnam | $4,620 |
| 🇵🇭 Philippines | $4,130 |
| 🇰🇭 Cambodia | $2,630 |
| 🇱🇦 Laos | $1,980 |
| 🇹🇱 Timor-Leste | $1,450 |
| 🇲🇲 Myanmar | $1,250 |
Note: Figures are rounded.
This is in sharp contrast to Brunei, Southeast Asia’s next richest country, with a per capita GDP of $35,110.
Oil is a critical part of Brunei’s economy, making it both very wealthy, but landing it in a vulnerable, resource-dependent position. Oil and gas revenues contribute half the country’s entire revenue receipts.
Two countries known for their large tourism sectors, Malaysia and Thailand rank third and fourth, at $13,310 and $7,810 respectively.
Finally, Southeast Asia’s largest economy, and the world’s fourth-most populous country Indonesia, rounds out the top five with a GDP per capita of $5,270.

-

 Brands5 days ago
The Evolution of U.S. Beer Logos
-

 Culture2 weeks ago
The World’s Top Media Franchises by All-Time Revenue
-

 voronoi2 weeks ago
Best Visualizations of April on the Voronoi App
-

 Wealth2 weeks ago
Charted: Which Country Has the Most Billionaires in 2024?
-

 Business1 week ago
The Top Private Equity Firms by Country
-

 Markets1 week ago
The Best U.S. Companies to Work for According to LinkedIn
-

 Economy1 week ago
Ranked: The Top 20 Countries in Debt to China
-

 Politics1 week ago
Charted: Trust in Government Institutions by G7 Countries