Money
Visualizing the World’s Growing Millionaire Population (2012-2022)


Visualizing the World’s Growing Millionaire Population
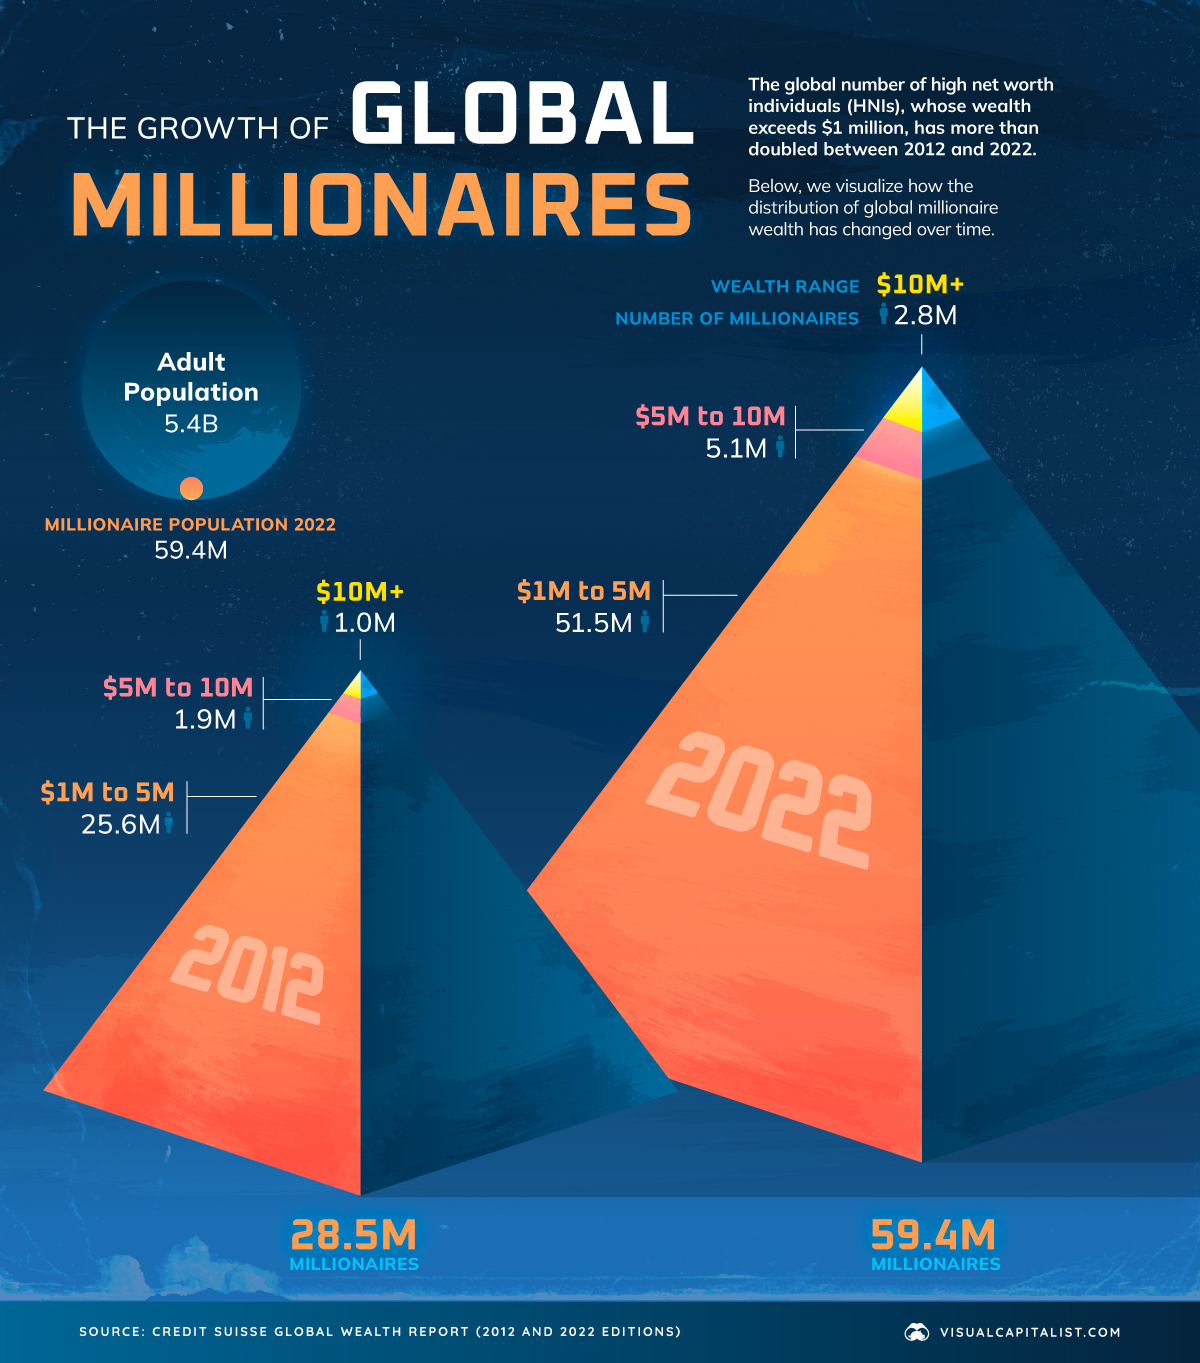
Reaping the rewards of tech revolutions, market booms, and more, the last decade has seen a remarkable increase in the global number of millionaires.
In 2022, 1.1% of all of the world’s adults were millionaires, up from 0.6% in 2012.
In today’s visualization, we dive into the world’s growing millionaire population using data from this year’s Global Wealth Report by Credit Suisse.
The Global Millionaire Population, Then and Now
In 2022, total millionaire wealth stood at $208.3 trillion, accounting for 45.8% of global wealth. That represents a 138% increase from 2011, when millionaires held $87.5 trillion in wealth.
While the rise can be attributed to a number of factors, financial assets have accounted for most of the increase in total wealth since the 2008 Financial Crisis, according to Credit Suisse.
Here’s a look at the explosive growth in the number of millionaires from 2012 to 2022:
| Wealth range | Number of adults (2012) | Number of adults (2022) |
|---|---|---|
| $1-5M | 25.6 million | 51.5 million |
| $5-10M | 1.9 million | 5.1 million |
| >$10M | 1.0 million | 2.8 million |
At the very apex of these pyramids, the number of ultra-high-net-worth individuals (all holding $50 million or more in wealth) has nearly tripled over the last decade.
Where are the world’s millionaires mostly found?
- 42%: North America
- 27%: Europe
- 16%: Asia-Pacific (ex. China and India)
- 10%: China
- 5%: Rest of the World
In total, the world’s millionaire population amounted to 59.4 million adults in 2022.
Despite inflation, interest rates, and current market conditions hampering wealth creation for many in 2022 and 2023, Credit Suisse forecasts that the number of millionaires will still grow to 86 million by 2027, a 45% increase from 2022.
The Outlook for Wealth Inequality
Although wealth inequality fell slightly in 2022, a significant chunk of overall global wealth still belongs to the wealthiest parts of the population.
In stark contrast to millionaires, 52.5% of the world’s adults had less than $10,000 in wealth, and combined for just 1.2% of global wealth.
From a big picture perspective, however, worldwide wealth inequality has trended downward over the last two decades. That is, before the 2020–2021 period when the wealth gap was exacerbated due to the pandemic and the subsequent boom in share and house prices.
Looking ahead to 2027, Credit Suisse forecasts that the share of adults with less than $10,000 in wealth will fall, with more adults moving into the middle and upper income levels. It’ll be interesting to see if global wealth inequality continues its long-term downward trajectory.
Where does this data come from?
Source: Credit Suisse Global Wealth Report (2022 and 2012 versions)


Wealth
Visualizing the Tax Burden of Every U.S. State
Tax burden measures the percent of an individual’s income that is paid towards taxes. See where it’s the highest by state in this graphic.


Visualizing the Tax Burden of Every U.S. State
This was originally posted on our Voronoi app. Download the app for free on iOS or Android and discover incredible data-driven charts from a variety of trusted sources.
This map graphic visualizes the total tax burden in each U.S. state as of March 2024, based on figures compiled by WalletHub.
It’s important to understand that under this methodology, the tax burden measures the percent of an average person’s income that is paid towards state and local taxes. It considers property taxes, income taxes, and sales & excise tax.
Data and Methodology
The figures we used to create this graphic are listed in the table below.
| State | Total Tax Burden |
|---|---|
| New York | 12.0% |
| Hawaii | 11.8% |
| Vermont | 11.1% |
| Maine | 10.7% |
| California | 10.4% |
| Connecticut | 10.1% |
| Minnesota | 10.0% |
| Illinois | 9.7% |
| New Jersey | 9.5% |
| Rhode Island | 9.4% |
| Utah | 9.4% |
| Kansas | 9.3% |
| Maryland | 9.3% |
| Iowa | 9.2% |
| Nebraska | 9.2% |
| Ohio | 8.9% |
| Indiana | 8.9% |
| Arkansas | 8.8% |
| Mississippi | 8.8% |
| Massachusetts | 8.6% |
| Virginia | 8.5% |
| West Virginia | 8.5% |
| Oregon | 8.4% |
| Colorado | 8.4% |
| Pennsylvania | 8.4% |
| Wisconsin | 8.3% |
| Louisiana | 8.3% |
| Kentucky | 8.3% |
| Washington | 8.0% |
| New Mexico | 8.0% |
| Michigan | 8.0% |
| North Carolina | 7.9% |
| Idaho | 7.9% |
| Arizona | 7.8% |
| Missouri | 7.8% |
| Georgia | 7.7% |
| Texas | 7.6% |
| Alabama | 7.5% |
| Montana | 7.5% |
| South Carolina | 7.5% |
| Nevada | 7.4% |
| Oklahoma | 7.0% |
| North Dakota | 6.8% |
| South Dakota | 6.4% |
| Delaware | 6.4% |
| Tennessee | 6.1% |
| Florida | 6.1% |
| Wyoming | 5.7% |
| New Hampshire | 5.6% |
| Alaska | 4.9% |
From this data we can see that New York has the highest total tax burden. Residents in this state will pay, on average, 12% of their income to state and local governments.
Breaking this down into its three components, the average New Yorker pays 4.6% of their income on income taxes, 4.4% on property taxes, and 3% in sales & excise taxes.
At the other end of the spectrum, Alaska has the lowest tax burden of any state, equaling 4.9% of income. This is partly due to the fact that Alaskans do not pay state income tax.
Hate Paying Taxes?
In addition to Alaska, there are several other U.S. states that don’t charge income taxes. These are: Florida, Nevada, South Dakota, Tennessee, Texas, Washington, and Wyoming.
It’s also worth noting that New Hampshire does not have a regular income tax, but does charge a flat 4% on interest and dividend income according to the Tax Foundation.
Learn More About Taxation From Visual Capitalist
If you enjoyed this post, be sure to check out this graphic which ranks the countries with the lowest corporate tax rates, from 1980 to today.

-

 Markets5 days ago
Visualizing Global Inflation Forecasts (2024-2026)
-

 Green2 weeks ago
The Carbon Footprint of Major Travel Methods
-

 United States2 weeks ago
Visualizing the Most Common Pets in the U.S.
-

 Culture2 weeks ago
The World’s Top Media Franchises by All-Time Revenue
-

 voronoi1 week ago
Best Visualizations of April on the Voronoi App
-

 Wealth1 week ago
Charted: Which Country Has the Most Billionaires in 2024?
-

 Business1 week ago
The Top Private Equity Firms by Country
-

 Markets1 week ago
The Best U.S. Companies to Work for According to LinkedIn