Energy
Mapped: The Top Middle East Exports by Country


Mapped: The Top Middle East Exports by Country
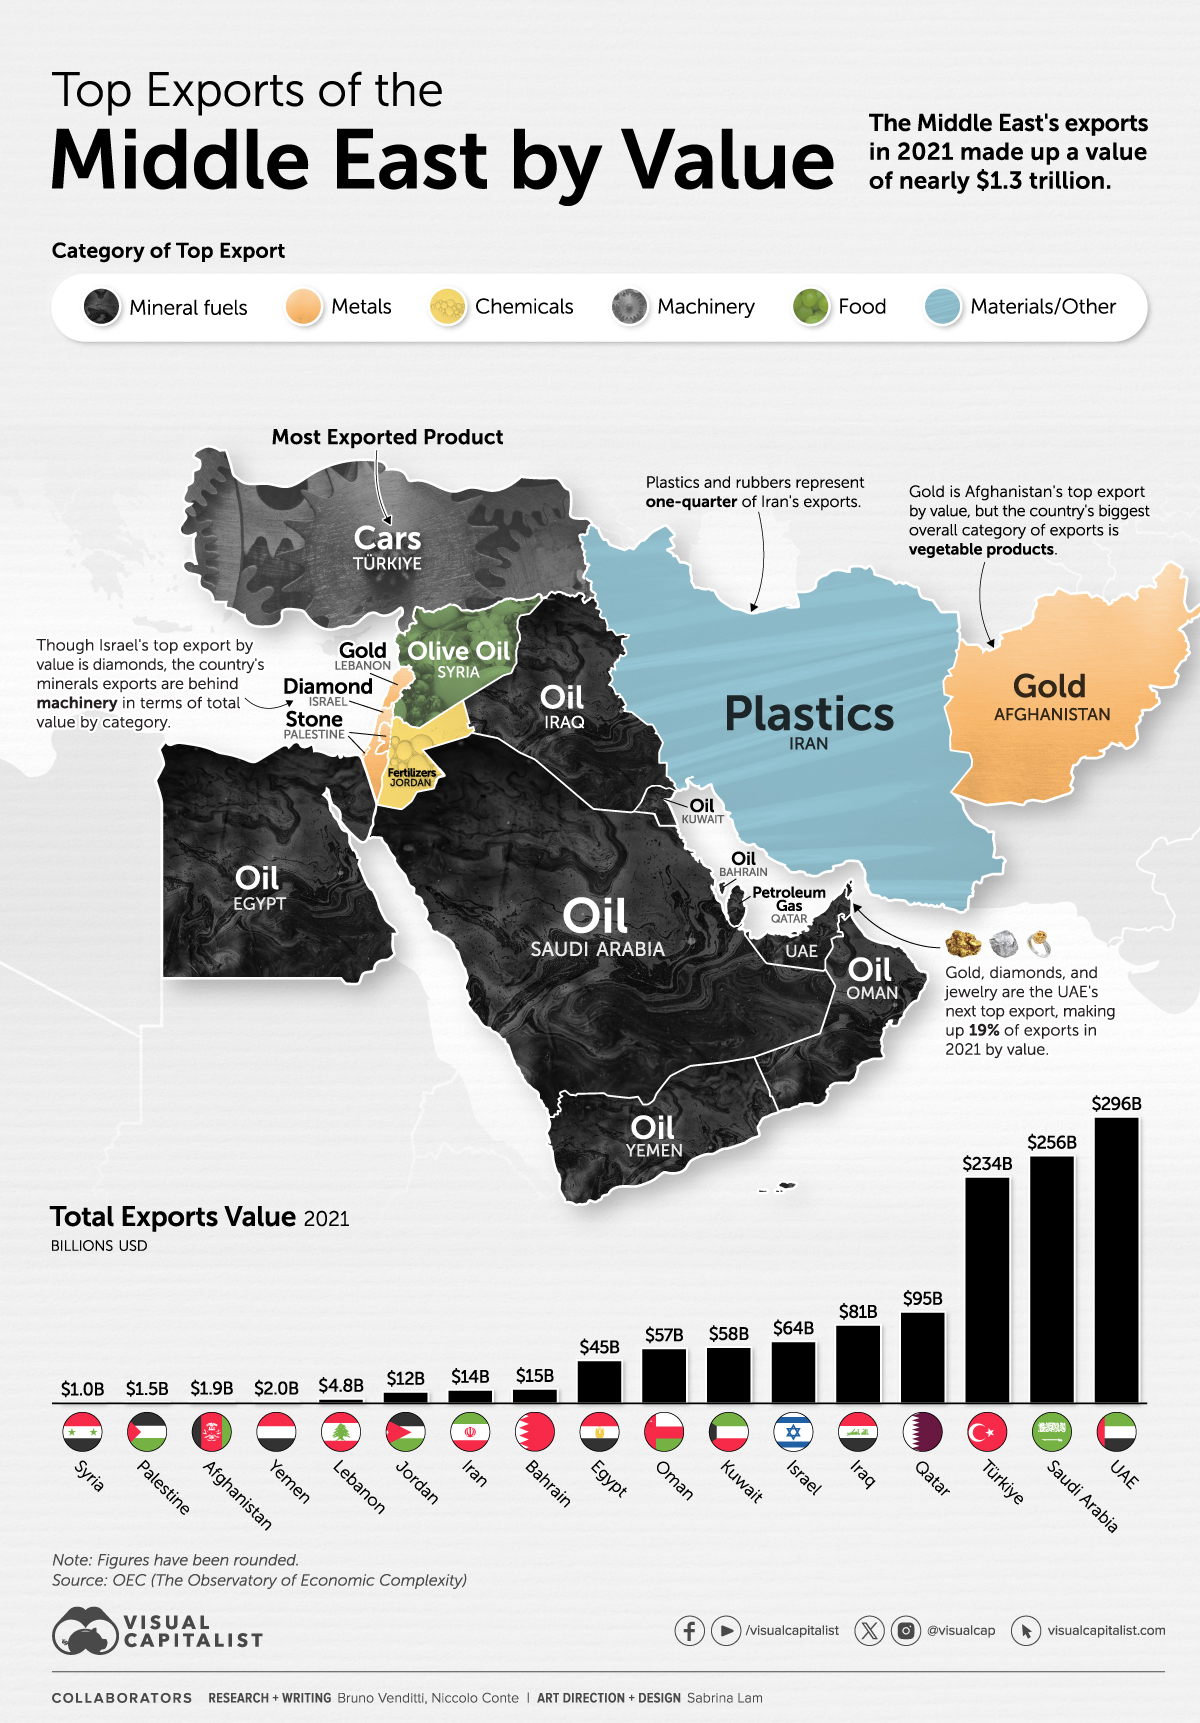
The Middle East is widely recognized for its significant role in the global energy market. However, countries in the region also foster other substantial industries, including metals, chemicals, and agriculture.
The graphic above uses 2021 exports data from The Observatory of Economic Complexity to help explain the economy of the Middle East.
Top Exports by Middle-Eastern Countries in 2021
In 2021, the Middle East’s exports reached a total value of $1.27 trillion. While the region lags behind Asia, Europe, and North America in global exports, it outpaces Africa and South America.
Despite many countries undertaking efforts to diversify their economies and reduce their oil dependence, most of the exports still come from fossil fuels.
| Country | Top Export (2021) | Top Export Value | Total Exports Value |
|---|---|---|---|
| 🇦🇪 UAE | Crude petroleum | $58.5B | $296.0B |
| 🇸🇦 Saudi Arabia | Crude petroleum | $138.0B | $256.0B |
| 🇹🇷 Turkey | Cars | $10.0B | $234.0B |
| 🇶🇦 Qatar | Petroleum gas | $57.2B | $94.7B |
| 🇮🇶 Iraq | Crude petroleum | $72.0B | $81.1B |
| 🇮🇱 Israel | Diamonds | $9.1B | $64.1B |
| 🇰🇼 Kuwait | Crude petroleum | $40.1B | $58.2B |
| 🇴🇲 Oman | Crude petroleum | $24.2B | $56.9B |
| 🇪🇬 Egypt | Refined petroleum | $4.8B | $44.5B |
| 🇧🇭 Bahrain | Refined petroleum | $4.3B | $15.0B |
| 🇮🇷 Iran | Ethylene polymers | $3.2B | $14.0B |
| 🇯🇴 Jordan | Potassic fertilizers | $1.2B | $12.0B |
| 🇱🇧 Lebanon | Gold | $0.4B | $4.8B |
| 🇾🇪 Yemen | Crude petroleum | $1.1B | $2.0B |
| 🇦🇫 Afghanistan | Grapes | $0.4B | $1.9B |
| 🇵🇸 Palestine | Building stone | $0.2B | $1.5B |
| 🇸🇾 Syria | Pure olive oil | $0.1B | $1.0B |
The Middle East accounts for one-third of global oil production, producing over 30 million barrels per day. Five of the world’s top 10 oil producers are located in the region.
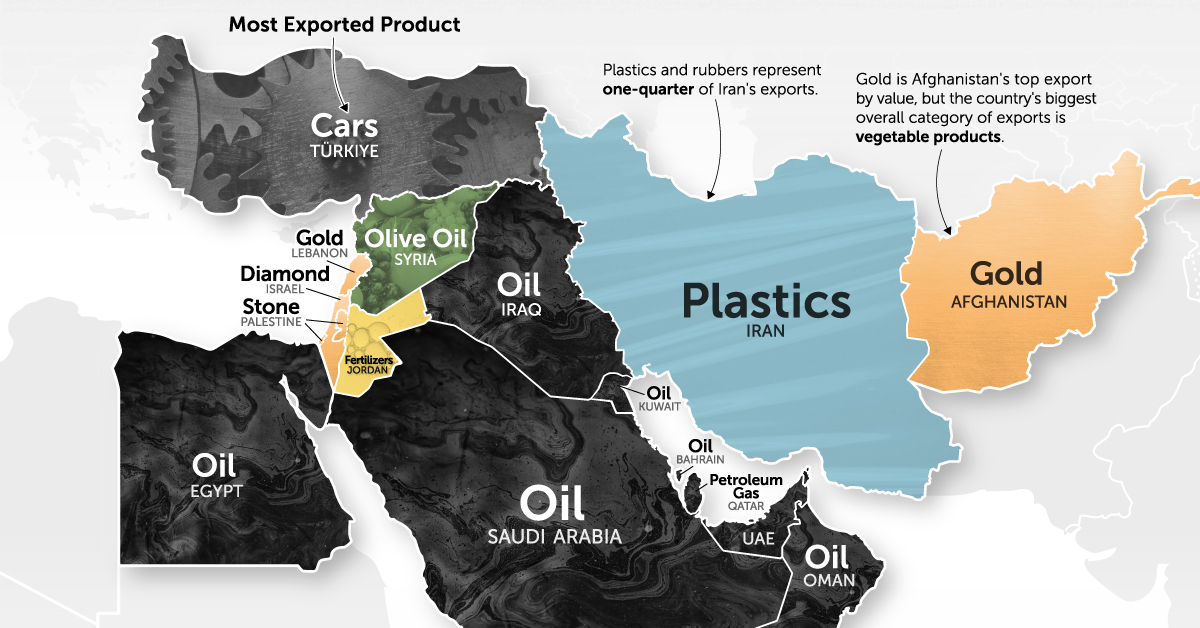
But some countries like Türkiye show off more diverse economies. The country’s exports range from minerals to machinery and textiles, with cars as its top export. The country is actually one of the world’s top automotive exporters.
Israel is another of the Middle East’s most diverse economies. The country’s major exports encompass electronics, software, and refined petroleum, but cut diamonds rank as the country’s largest single export by value.
Iran has tapped into its ample reserves of oil and natural gas in a different way, becoming a significant producer of plastics. Presently, plastics and rubbers constitute one-quarter of Iran’s exports.
How the Middle East Impacts the Global Economy
Given that the oil sector is one of the most significant in the global economy in terms of both volume and transaction value, many Middle Eastern countries are substantial players in international politics.
Nations such as Saudi Arabia and the UAE have direct impact on the oil market and play a pivotal role in determining the price of the commodity.
Due to the region’s massive exports (and imports of goods), and the importance of oil and gas in goods manufacturing worldwide, regional conflicts by Middle Eastern countries also impact global markets directly.


Who’s Building the Most Solar Energy?
This was originally posted on our Voronoi app. Download the app for free on iOS or Android and discover incredible data-driven charts from a variety of trusted sources.
In 2023, solar energy accounted for three-quarters of renewable capacity additions worldwide. Most of this growth occurred in Asia, the EU, and the U.S., continuing a trend observed over the past decade.
In this graphic, we illustrate the rise in installed solar photovoltaic (PV) capacity in China, the EU, and the U.S. between 2010 and 2022, measured in gigawatts (GW). Bruegel compiled the data..
Chinese Dominance
As of 2022, China’s total installed capacity stands at 393 GW, nearly double that of the EU’s 205 GW and surpassing the USA’s total of 113 GW by more than threefold in absolute terms.
| Installed solar capacity (GW) | China | EU27 | U.S. |
|---|---|---|---|
| 2022 | 393.0 | 205.5 | 113.0 |
| 2021 | 307.0 | 162.7 | 95.4 |
| 2020 | 254.0 | 136.9 | 76.4 |
| 2019 | 205.0 | 120.1 | 61.6 |
| 2018 | 175.3 | 104.0 | 52.0 |
| 2017 | 130.8 | 96.2 | 43.8 |
| 2016 | 77.8 | 91.5 | 35.4 |
| 2015 | 43.6 | 87.7 | 24.2 |
| 2014 | 28.4 | 83.6 | 18.1 |
| 2013 | 17.8 | 79.7 | 13.3 |
| 2012 | 6.7 | 71.1 | 8.6 |
| 2011 | 3.1 | 53.3 | 5.6 |
| 2010 | 1.0 | 30.6 | 3.4 |
Since 2017, China has shown a compound annual growth rate (CAGR) of approximately 25% in installed PV capacity, while the USA has seen a CAGR of 21%, and the EU of 16%.
Additionally, China dominates the production of solar power components, currently controlling around 80% of the world’s solar panel supply chain.
In 2022, China’s solar industry employed 2.76 million individuals, with manufacturing roles representing approximately 1.8 million and the remaining 918,000 jobs in construction, installation, and operations and maintenance.
The EU industry employed 648,000 individuals, while the U.S. reached 264,000 jobs.
According to the IEA, China accounts for almost 60% of new renewable capacity expected to become operational globally by 2028.
Despite the phasing out of national subsidies in 2020 and 2021, deployment of solar PV in China is accelerating. The country is expected to reach its national 2030 target for wind and solar PV installations in 2024, six years ahead of schedule.

-

 Markets5 days ago
Visualizing Global Inflation Forecasts (2024-2026)
-

 Green2 weeks ago
The Carbon Footprint of Major Travel Methods
-

 United States2 weeks ago
Visualizing the Most Common Pets in the U.S.
-

 Culture2 weeks ago
The World’s Top Media Franchises by All-Time Revenue
-

 voronoi1 week ago
Best Visualizations of April on the Voronoi App
-

 Wealth1 week ago
Charted: Which Country Has the Most Billionaires in 2024?
-

 Business1 week ago
The Top Private Equity Firms by Country
-

 Markets1 week ago
The Best U.S. Companies to Work for According to LinkedIn