Markets
The Top 50 Largest Importers in the World
The Top 50 Largest Importers in the World
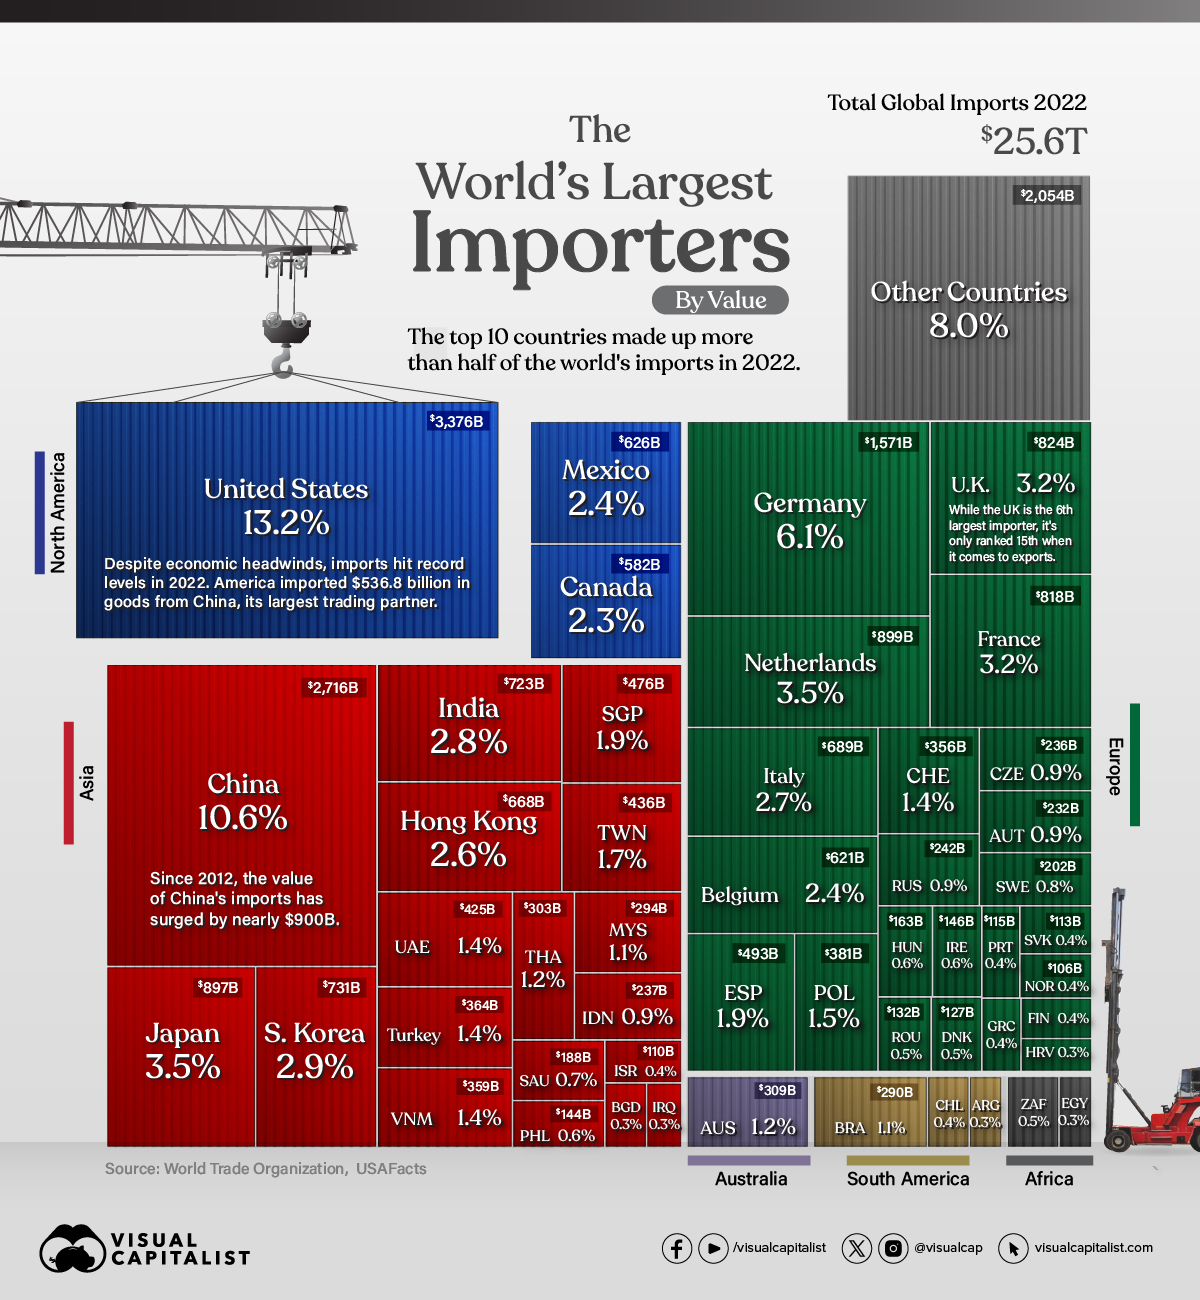
In 2022, global imports climbed to $25.6 trillion in value, or about the size of the U.S. GDP.
As an engine of growth, global trade broadens consumer choices and can lower the cost of goods. For businesses, it can improve the quality of inputs and strengthen competitiveness.
This graphic shows the 50 largest importers, with data from the World Trade Organization.
Which Countries Import the Most Goods?
With $3.4 trillion in imports in 2022, the U.S. is the largest importer globally.
Even though higher inflation and market uncertainty loomed over the economy, U.S. imports increased 15% annually, with China as its top goods importing partner.
| Country | Value 2022 | Share | Annual % Change |
|---|---|---|---|
| 🇺🇸 U.S. | $3,376B | 13.2% | 15.0% |
| 🇨🇳 China | $2,716B | 10.6% | 1.0% |
| 🇩🇪 Germany | $1,571B | 6.1% | 11.0% |
| 🇳🇱 Netherlands | $899B | 3.5% | 19.0% |
| 🇯🇵 Japan | $897B | 3.5% | 17.0% |
| 🇬🇧 UK | $824B | 3.2% | 19.0% |
| 🇫🇷 France | $818B | 3.2% | 14.0% |
| 🇰🇷 South Korea | $731B | 2.9% | 19.0% |
| 🇮🇳 India | $723B | 2.8% | 26.0% |
| 🇮🇹 Italy | $689B | 2.7% | 22.0% |
| 🇭🇰 Hong Kong SAR | $668B | 2.6% | -6.0% |
| 🇲🇽 Mexico | $626B | 2.4% | 20.0% |
| 🇧🇪 Belgium | $621B | 2.4% | 18.0% |
| 🇨🇦 Canada | $582B | 2.3% | 15.0% |
| 🇪🇸 Spain | $493B | 1.9% | 18.0% |
| 🇸🇬 Singapore | $476B | 1.9% | 17.0% |
| 🇹🇼 Taiwan | $436B | 1.7% | 14.0% |
| 🇦🇪 UAE | $425B | 1.4% | 12.0% |
| 🇵🇱 Poland | $381B | 1.5% | 11.0% |
| 🇹🇷 Turkey | $364B | 1.4% | 34.0% |
| 🇻🇳 Viet Nam | $359B | 1.4% | 8.0% |
| 🇨🇭 Switzerland | $356B | 1.4% | 10.0% |
| 🇦🇺 Australia | $309B | 1.2% | 18.0% |
| 🇹🇭 Thailand | $303B | 1.2% | 14.0% |
| 🇲🇾 Malaysia | $294B | 1.1% | 24.0% |
| 🇧🇷 Brazil | $290B | 1.1% | 25.0% |
| 🇷🇺 Russia | $242B | 0.9% | -21.0% |
| 🇮🇩 Indonesia | $237B | 0.9% | 21.0% |
| 🇨🇿 Czech Republic | $236B | 0.9% | 11.0% |
| 🇦🇹 Austria | $232B | 0.9% | 6.0% |
| 🇸🇪 Sweden | $202B | 0.8% | 8.0% |
| 🇸🇦 Saudi Arabia | $188B | 0.7% | 23.0% |
| 🇭🇺 Hungary | $163B | 0.6% | 14.0% |
| 🇮🇪 Ireland | $146B | 0.6% | 21.0% |
| 🇵🇭 Philippines | $144B | 0.6% | 26.0% |
| 🇿🇦 South Africa | $136B | 0.5% | 19.0% |
| 🇷🇴 Romania | $132B | 0.5% | 14.0% |
| 🇩🇰 Denmark | $127B | 0.5% | 5.0% |
| 🇵🇹 Portugal | $115B | 0.4% | 17.0% |
| 🇸🇰 Slovak Republic | $113B | 0.4% | 9.0% |
| 🇮🇱 Israel | $110B | 0.4% | 16.0% |
| 🇳🇴 Norway | $106B | 0.4% | 8.0% |
| 🇨🇱 Chile | $104B | 0.4% | 13.0% |
| 🇬🇷 Greece | $98B | 0.4% | 27.0% |
| 🇫🇮 Finland | $97B | 0.4% | 13.0% |
| 🇧🇩 Bangladesh | $89B | 0.3% | 10.0% |
| 🇪🇬 Egypt | $86B | 0.3% | 27.0% |
| 🇦🇷 Argentina | $82B | 0.3% | 19.0% |
| 🇮🇶 Iraq | $78B | 0.3% | 18.0% |
| 🇭🇷 Croatia | $77B | 0.3% | 27.0% |
| Rest of World | $2,054B | 8.0% | |
| 🌎 World | $25,621B | 100.0% | 13.0% |
As the world’s second-largest economy, China’s imports hit $2.7 trillion in value, although growth slowed in 2022.
Taiwan, China’s top trading partner for imports, is a major provider of electronics products, including semiconductor chips. However, the China-Taiwan trade relationship remains complicated given geopolitical tensions sparking unexpected import bans.
A handful of European countries also fell in the top 10 importers, led by Germany and the Netherlands. Overall, the European Union is the largest importer of agricultural products, fuels and mining products, and automotive products globally.
Global Trade Fragmentation
In 2023, the World Trade Organization projects that import volumes will contract as much as 1.2% across North and South America, Asia, and Europe.
In part, this is being driven by slower demand in manufacturing economies.
Whether or not this weaker volume is also being impacted by trade fragmentation remains unclear. One indicator may be seen in the trade of intermediate goods, which are products like wood and steel that are used in the production of a final good.
In the first half of 2023, the share of intermediate goods in world trade dropped to 48.5%, down from its three-year average of 51%. On the one hand, this may suggest that supply chains are contracting. Yet it may also be due to the influence of higher commodity prices, which have a bigger impact on the cost of intermediate goods than on final goods.
Still, other factors have an impact on the flow of trade. These include subsidies, export bans, and legislative policy, such as the $52.7 billion U.S. CHIPS Act, that incentivizes local production of semiconductors.
Considering these factors, broader trends of global de-globalization remain to be seen.


Markets
Mapped: Europe’s GDP Per Capita, by Country
Which European economies are richest on a GDP per capita basis? This map shows the results for 44 countries across the continent.


Mapped: Europe’s GDP Per Capita, by Country (2024)
This was originally posted on our Voronoi app. Download the app for free on iOS or Android and discover incredible data-driven charts from a variety of trusted sources.
Europe is home to some of the largest and most sophisticated economies in the world. But how do countries in the region compare with each other on a per capita productivity basis?
In this map, we show Europe’s GDP per capita levels across 44 nations in current U.S. dollars. Data for this visualization and article is sourced from the International Monetary Fund (IMF) via their DataMapper tool, updated April 2024.
Europe’s Richest and Poorest Nations, By GDP Per Capita
Luxembourg, Ireland, and Switzerland, lead the list of Europe’s richest nations by GDP per capita, all above $100,000.
| Rank | Country | GDP Per Capita (2024) |
|---|---|---|
| 1 | 🇱🇺 Luxembourg | $131,380 |
| 2 | 🇮🇪 Ireland | $106,060 |
| 3 | 🇨🇭 Switzerland | $105,670 |
| 4 | 🇳🇴 Norway | $94,660 |
| 5 | 🇮🇸 Iceland | $84,590 |
| 6 | 🇩🇰 Denmark | $68,900 |
| 7 | 🇳🇱 Netherlands | $63,750 |
| 8 | 🇸🇲 San Marino | $59,410 |
| 9 | 🇦🇹 Austria | $59,230 |
| 10 | 🇸🇪 Sweden | $58,530 |
| 11 | 🇧🇪 Belgium | $55,540 |
| 12 | 🇫🇮 Finland | $55,130 |
| 13 | 🇩🇪 Germany | $54,290 |
| 14 | 🇬🇧 UK | $51,070 |
| 15 | 🇫🇷 France | $47,360 |
| 16 | 🇦🇩 Andorra | $44,900 |
| 17 | 🇲🇹 Malta | $41,740 |
| 18 | 🇮🇹 Italy | $39,580 |
| 19 | 🇨🇾 Cyprus | $37,150 |
| 20 | 🇪🇸 Spain | $34,050 |
| 21 | 🇸🇮 Slovenia | $34,030 |
| 22 | 🇪🇪 Estonia | $31,850 |
| 23 | 🇨🇿 Czech Republic | $29,800 |
| 24 | 🇵🇹 Portugal | $28,970 |
| 25 | 🇱🇹 Lithuania | $28,410 |
| 26 | 🇸🇰 Slovakia | $25,930 |
| 27 | 🇱🇻 Latvia | $24,190 |
| 28 | 🇬🇷 Greece | $23,970 |
| 29 | 🇭🇺 Hungary | $23,320 |
| 30 | 🇵🇱 Poland | $23,010 |
| 31 | 🇭🇷 Croatia | $22,970 |
| 32 | 🇷🇴 Romania | $19,530 |
| 33 | 🇧🇬 Bulgaria | $16,940 |
| 34 | 🇷🇺 Russia | $14,390 |
| 35 | 🇹🇷 Türkiye | $12,760 |
| 36 | 🇲🇪 Montenegro | $12,650 |
| 37 | 🇷🇸 Serbia | $12,380 |
| 38 | 🇦🇱 Albania | $8,920 |
| 39 | 🇧🇦 Bosnia & Herzegovina | $8,420 |
| 40 | 🇲🇰 North Macedonia | $7,690 |
| 41 | 🇧🇾 Belarus | $7,560 |
| 42 | 🇲🇩 Moldova | $7,490 |
| 43 | 🇽🇰 Kosovo | $6,390 |
| 44 | 🇺🇦 Ukraine | $5,660 |
| N/A | 🇪🇺 EU Average | $44,200 |
Note: Figures are rounded.
Three Nordic countries (Norway, Iceland, Denmark) also place highly, between $70,000-90,000. Other Nordic peers, Sweden and Finland rank just outside the top 10, between $55,000-60,000.
Meanwhile, Europe’s biggest economies in absolute terms, Germany, UK, and France, rank closer to the middle of the top 20, with GDP per capitas around $50,000.
Finally, at the end of the scale, Eastern Europe as a whole tends to have much lower per capita GDPs. In that group, Ukraine ranks last, at $5,660.
A Closer Look at Ukraine
For a broader comparison, Ukraine’s per capita GDP is similar to Iran ($5,310), El Salvador ($5,540), and Guatemala ($5,680).
According to experts, Ukraine’s economy has historically underperformed to expectations. After the fall of the Berlin Wall, the economy contracted for five straight years. Its transition to a Western, liberalized economic structure was overshadowed by widespread corruption, a limited taxpool, and few revenue sources.
Politically, its transformation from authoritarian regime to civil democracy has proved difficult, especially when it comes to institution building.
Finally, after the 2022 invasion of the country, Ukraine’s GDP contracted by 30% in a single year—the largest loss since independence. Large scale emigration—to the tune of six million refugees—is also playing a role.
Despite these challenges, the country’s economic growth has somewhat stabilized while fighting continues.

-

 Brands5 days ago
The Evolution of U.S. Beer Logos
-

 Culture2 weeks ago
The World’s Top Media Franchises by All-Time Revenue
-

 voronoi2 weeks ago
Best Visualizations of April on the Voronoi App
-

 Wealth2 weeks ago
Charted: Which Country Has the Most Billionaires in 2024?
-

 Business1 week ago
The Top Private Equity Firms by Country
-

 Markets1 week ago
The Best U.S. Companies to Work for According to LinkedIn
-

 Economy1 week ago
Ranked: The Top 20 Countries in Debt to China
-

 Politics1 week ago
Charted: Trust in Government Institutions by G7 Countries