Economy
The World’s Largest Consumer Markets in 2030
![]() See this visualization first on the Voronoi app.
See this visualization first on the Voronoi app.
Forecast: The World’s Largest Consumer Markets in 2030
This was originally posted on our Voronoi app. Download the app for free on iOS or Android and discover incredible data-driven charts from a variety of trusted sources.
Consumers are the lifeblood of the global economy, the driving force behind market dynamics, and the ultimate arbiters of demand.
But where are the biggest congregations of consumers, and are they growing?
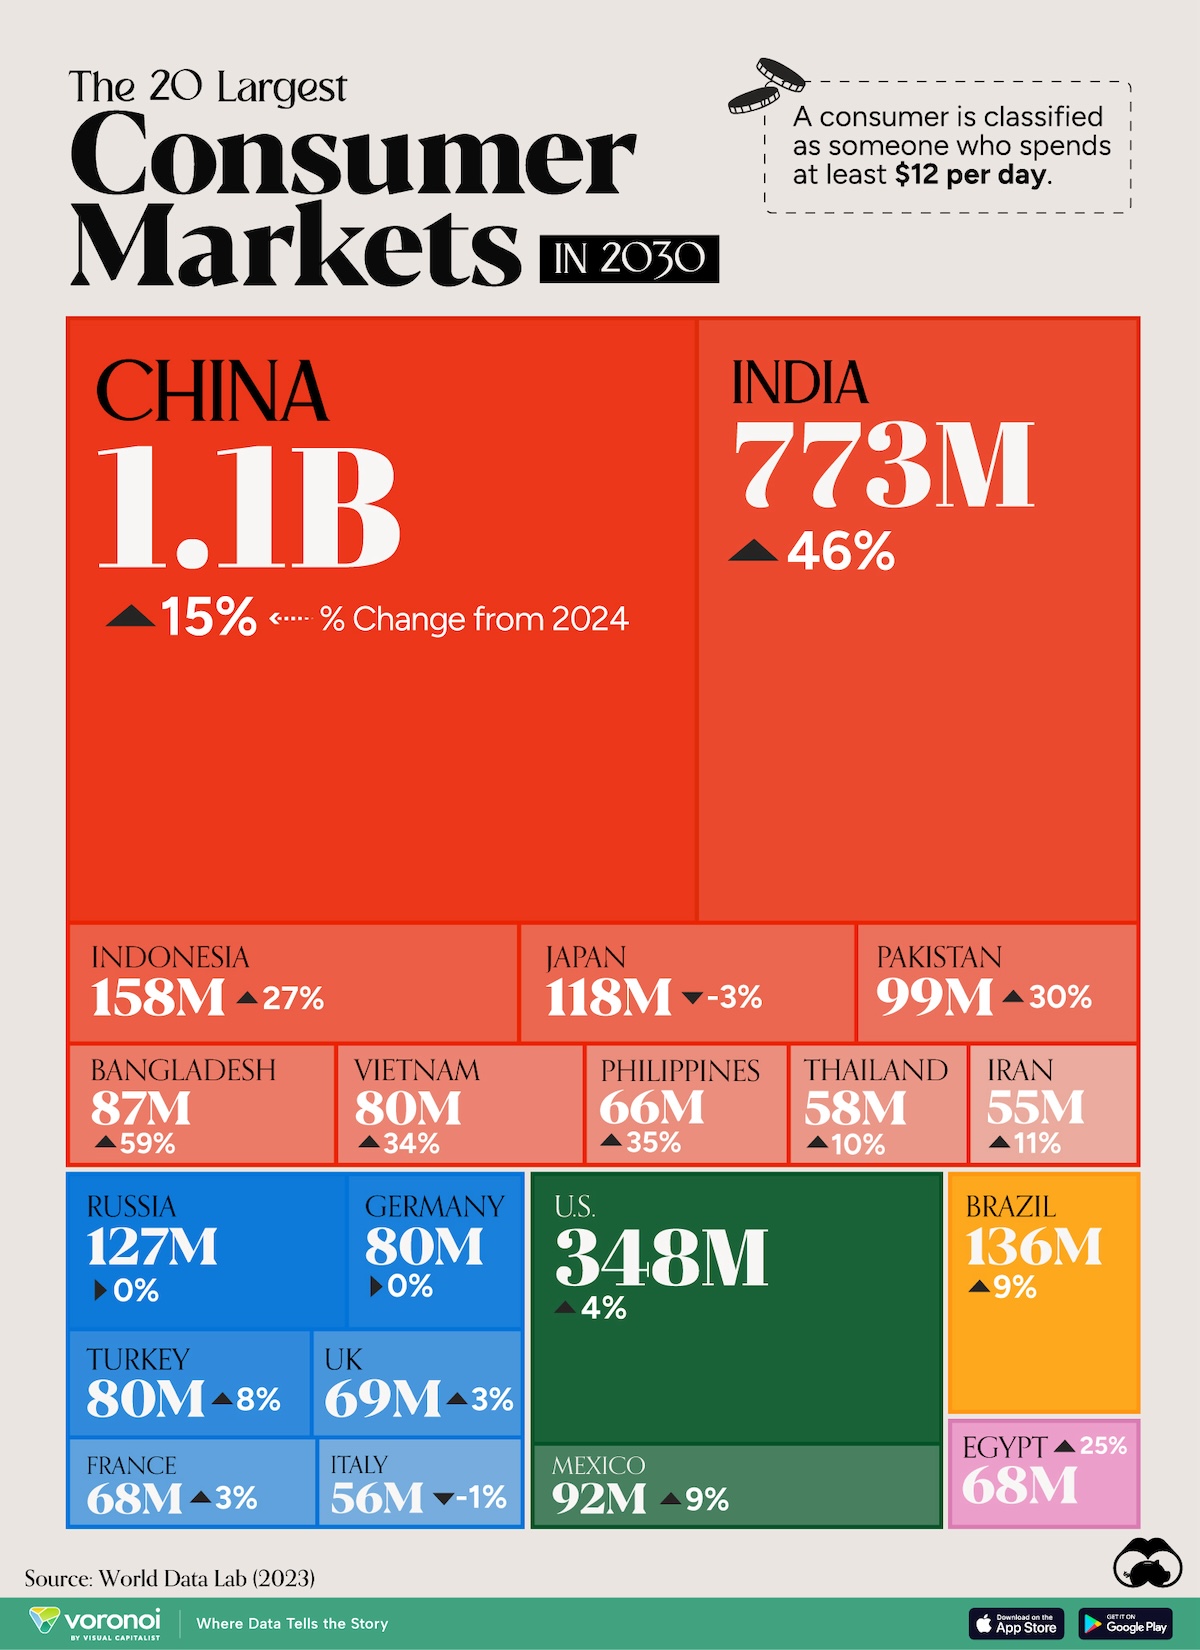
We visualize the 20 largest consumer markets in the world, based on 2030 projections from World Data Lab, an enterprise focused on creating estimates on global consumer spending.
In this dataset, a consumer is classified as someone who spends at least $12 per day. Sources for the data include the World Bank, UN, Eurostat, and OECD databases.
Ranked: Largest Consumer Markets in 2030
Ranked first, China is expected to have slightly more than 1 billion consumers by 2030, a 15% increase from 2024. Just across the Himalayas, at second place, India will have 773 million consumers, up from 529 million today, a staggering 46% increase.
The rise of the global middle class, thanks to expanding economies and wealth, is expected to boom in this region, in turn increasing local spending ability.
This nearly 2 billion-strong consumer market in India and China could have wide-ranging effects on the global economy. Businesses may shift their focus to cater to these markets, offering more customized products and employing different marketing strategies. This could also require businesses to realign their supply chains and build new distribution networks closer to these markets.
| Rank | Country | Consumer Market (2030 Projections) | % Change (from 2024) |
|---|---|---|---|
| 1 | 🇨🇳 China | 1,062,294,436 | +15% |
| 2 | 🇮🇳 India | 772,929,623 | +46% |
| 3 | 🇺🇸 U.S. | 348,393,863 | +4% |
| 4 | 🇮🇩 Indonesia | 158,448,996 | +27% |
| 5 | 🇧🇷 Brazil | 135,902,978 | +9% |
| 6 | 🇷🇺 Russia | 127,324,784 | 0% |
| 7 | 🇯🇵 Japan | 118,264,539 | -3% |
| 8 | 🇵🇰 Pakistan | 99,263,255 | +30% |
| 9 | 🇲🇽 Mexico | 91,698,269 | +9% |
| 10 | 🇧🇩 Bangladesh | 87,183,060 | +59% |
| 11 | 🇻🇳 Vietnam | 80,383,445 | +34% |
| 12 | 🇩🇪 Germany | 80,370,656 | 0% |
| 13 | 🇹🇷 Turkey | 79,955,332 | +8% |
| 14 | 🇬🇧 UK | 69,179,607 | +3% |
| 15 | 🇫🇷 France | 67,980,532 | +3% |
| 16 | 🇪🇬 Egypt | 67,710,385 | +25% |
| 17 | 🇵🇭 Philippines | 65,545,279 | +35% |
| 18 | 🇹🇭 Thailand | 58,237,555 | +10% |
| 19 | 🇮🇹 Italy | 55,596,017 | -1% |
| 20 | 🇮🇷 Iran | 55,219,774 | +11% |
Following current population rankings, the U.S. (348 million consumers), and Indonesia (158 million consumers) rank third and fourth respectively. Brazil, the sixth-most populated country, will have the fifth-largest consumers class by 2030, close to 136 million people.
At the same time, not all countries will see a growing consumer base. Russia and Germany are expected to stagnate, while Japan and Italy could even see a decline, a direct representation of plateauing population growth within these countries.


United States
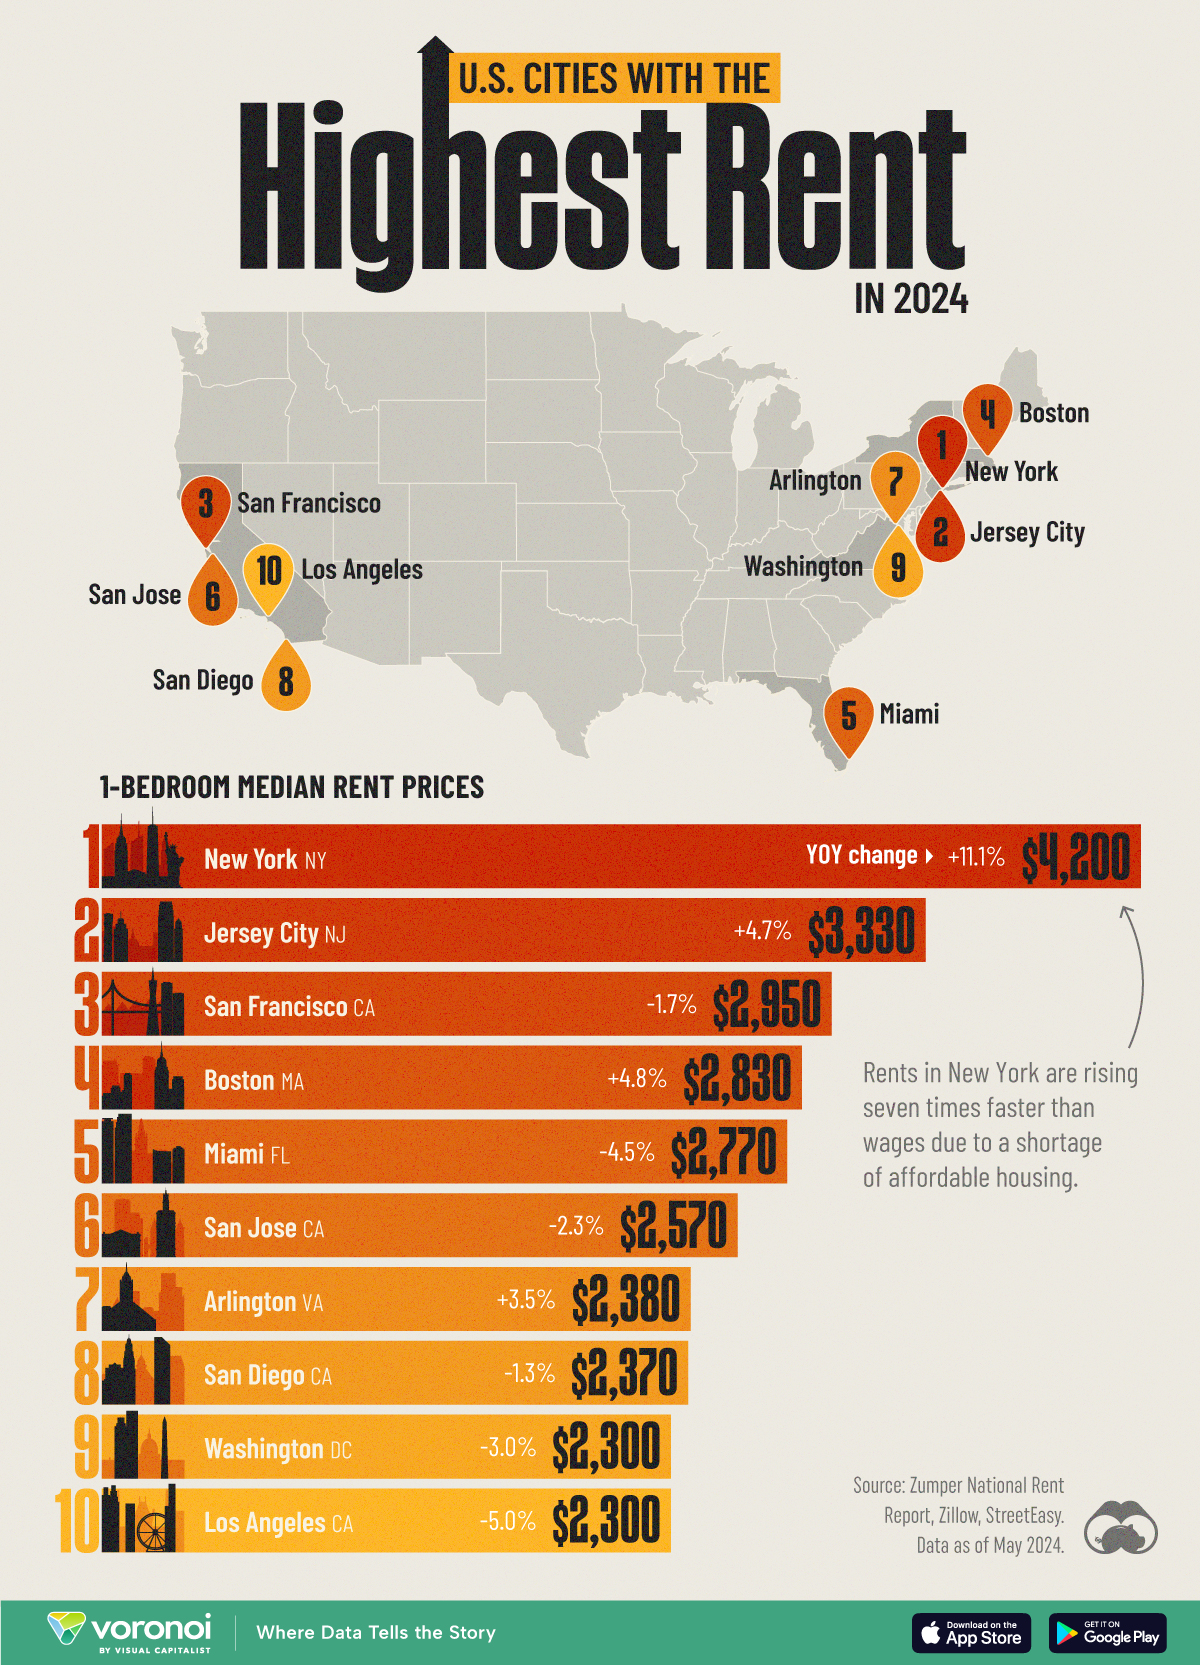
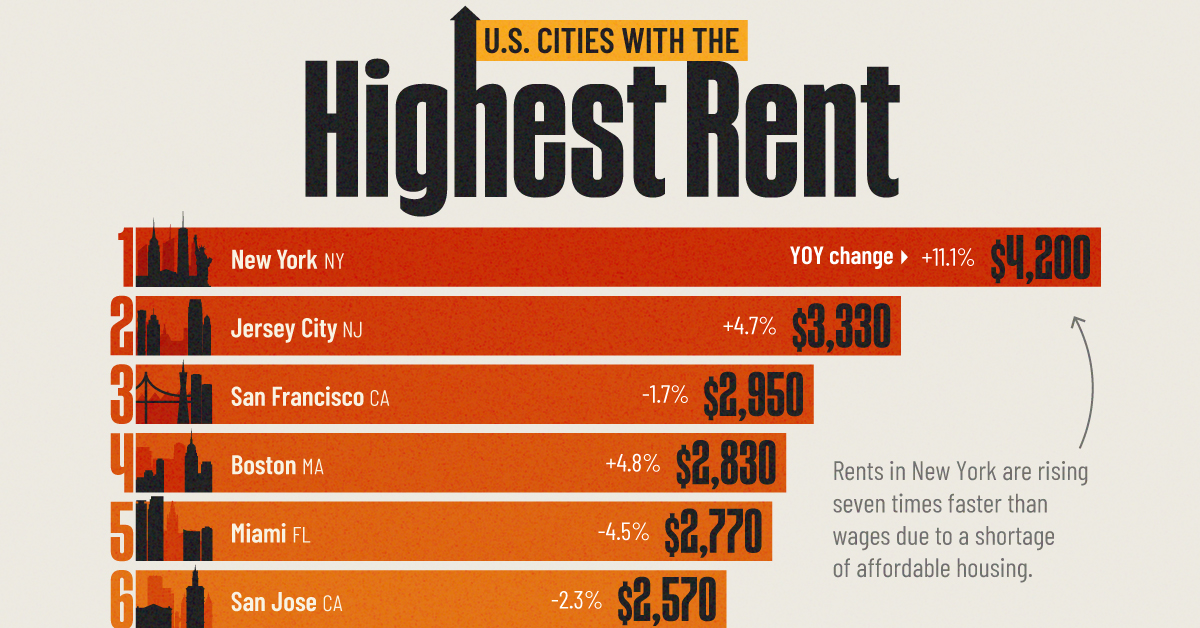
Ranked: U.S. Cities with the Highest Rent in 2024
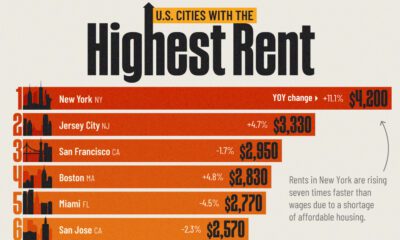
NYC tops the list with an average monthly cost of $4,200 for a one-bedroom apartment.
Ranked: U.S. Cities with the Highest Rent in 2024
This was originally posted on our Voronoi app. Download the app for free on iOS or Android and discover incredible data-driven charts from a variety of trusted sources.
Rental prices have surged in several American cities in recent years. Factors such as inflation, a limited housing inventory, a changing workforce, and barriers to homeownership have all contributed to the increase in rent costs.
This graphic shows the top 10 American cities with the highest rental costs as of May 2024, according to the Zumper National Rent Index. Prices are for 1-bedroom units.
NYC Prices: $4,200 for One-Bedroom
New York tops the list with an average monthly cost of $4,200 for a one-bedroom apartment. Not only is it expensive, but due to high demand, living in the Big Apple can be competitive.
While half of all renters in the U.S. spend more than 30% of their income on rent, residents in New York can spend more than 40% of their income renting a place.
| Ranking | City | Price in 2024 | Price in 2023 | YOY change |
|---|---|---|---|---|
| 1 | New York, NY | $4,200 | $3,780 | 11.1% |
| 2 | Jersey City, NJ | $3,330 | $3,181 | 4.7% |
| 3 | San Francisco, CA | $2,950 | $3,001 | -1.7% |
| 4 | Boston, MA | $2,830 | $2,700 | 4.8% |
| 5 | Miami, FL | $2,770 | $2,900 | -4.5% |
| 6 | San Jose, CA | $2,570 | $2,630 | -2.3% |
| 7 | Arlington, VA | $2,380 | $2,299 | 3.5% |
| 8 | San Diego, CA | $2,370 | $2,401 | -1.3% |
| 9 | Washington, DC | $2,300 | $2,371 | -3.0% |
| 9 | Los Angeles, CA | $2,300 | $2,421 | -5.0% |
Across the Hudson River, Jersey City ranks second, with one-bedroom suites priced at $3,330.
On the West Coast, San Francisco leads with $2,950 for a one-bedroom unit. Four of the 10 most expensive cities to rent are in California.
According to a study by Harvard University, the pandemic has intensified the housing affordability crisis in the United States. While high-end market supply may offer some relief to middle and higher-income renters, lower-income households will continue to struggle due to high construction costs and market dynamics.
What are the most valuable housing markets in the United States? We ranked housing markets in this chart to find out.

-

 Globalization6 days ago
Charted: Countries Offering Digital Nomad Visas
-
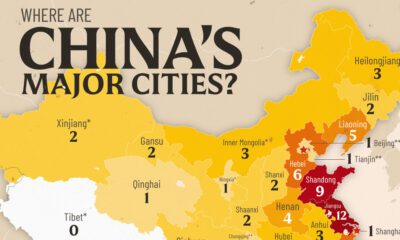
 Maps2 weeks ago
Mapped: Chinese Provinces With Cities Over 1 Million People
-

 Best of2 weeks ago
Best Visualizations of May on the Voronoi App
-
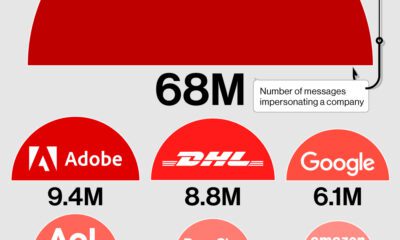
 Crime2 weeks ago
Visualizing the Companies Online Scammers Impersonate the Most
-

 Markets2 weeks ago
Comparing Saudi Aramco’s $1.9T Valuation to Its Rivals
-
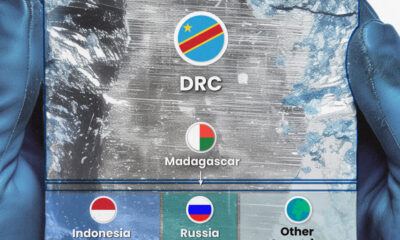
 Mining2 weeks ago
Visualizing Cobalt Production by Country in 2023
-
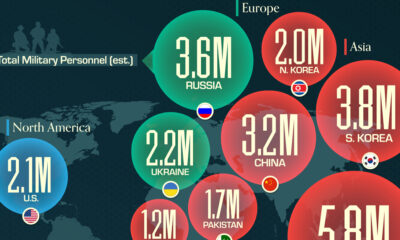
 War1 week ago
Mapped: The World’s Largest Armies in 2024
-
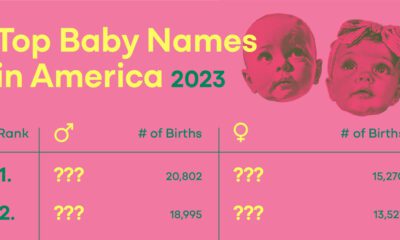
 Demographics1 week ago
Charted: America’s Most Popular Baby Names in 2023