Culture
Ranked: Which Countries Drink the Most Beer?
Visualizing Global Beer Consumption
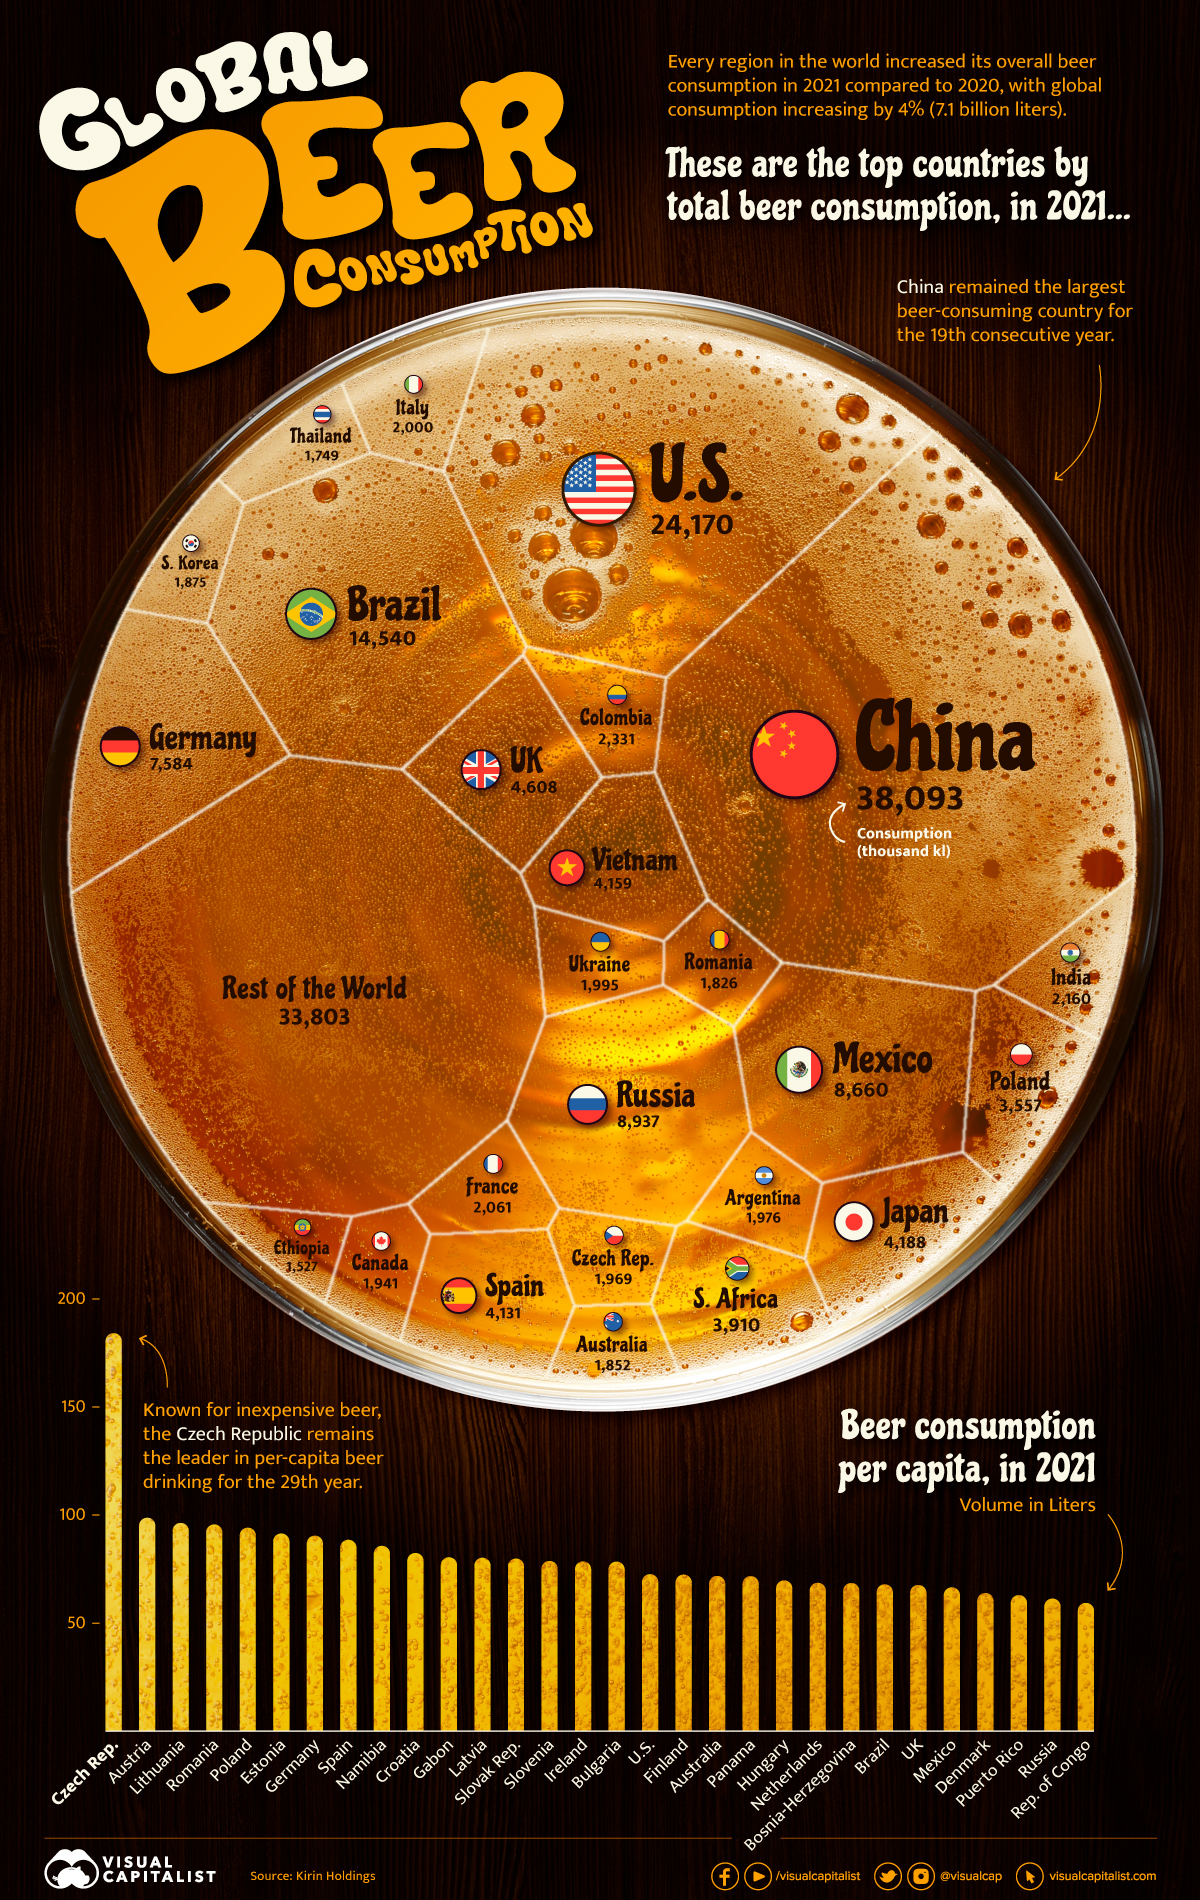
Global beer consumption exceeded 185 million kiloliters in 2021, enough to fill more than 74,000 Olympic-sized swimming pools.
So, which countries drink the most beer?
This graphic uses data from Kirin Holdings to compare global beer consumption by country. The Japanese company has been tracking beer consumption around the world since 1975.
Which Countries Drink the Most Beer?
Every region in the world increased its overall beer consumption in 2021 compared to 2020, with global consumption rising by 4%.
Asia holds a 31% share of the global beer market, remaining the world’s largest beer-consuming region over the last 14 years.
| Rank | Country | Total Consumption (thousand kl) | Market Share |
|---|---|---|---|
| 1 | 🇨🇳 China | 38,093 | 20.5% |
| 2 | 🇺🇸 U.S. | 24,170 | 13.0% |
| 3 | 🇧🇷 Brazil | 14,540 | 7.8% |
| 4 | 🇷🇺 Russia | 8,937 | 4.8% |
| 5 | 🇲🇽 Mexico | 8,660 | 4.7% |
| 6 | 🇩🇪 Germany | 7,584 | 4.1% |
| 7 | 🇬🇧 United Kingdom | 4,608 | 2.5% |
| 8 | 🇯🇵 Japan | 4,188 | 2.3% |
| 9 | 🇻🇳 Vietnam | 4,159 | 2.2% |
| 10 | 🇪🇸 Spain | 4,131 | 2.2% |
China was the largest beer-consuming country for the 19th consecutive year.
The tradition of brewing and enjoying beer in China spans approximately nine millennia. Recent archaeological discoveries have revealed that as far back as 7000 BC, ancient Chinese communities were engaged in producing beer-like alcoholic beverages, primarily on a small and localized basis.
China was also the leading producer of beer in 2022, followed by the United States.
Beer Consumption Per Capita
When examining per capita beer consumption, Asia falls behind Europe. In fact, nine of the top 10 consumers of beer per capita are European nations.
The Czech Republic remains the leader in per capita beer drinking for the 29th year. In 2021, the average Czech drank more than 184 liters of beer.
| Rank | Country | Per Capita Beer Consumption (volume in liters) | Total Consumption (thousand kl) |
|---|---|---|---|
| 1 | 🇨🇿 Czech Republic | 184.1 | 1,969 |
| 2 | 🇦🇹 Austria | 98.7 | 888 |
| 3 | 🇱🇹 Lithuania | 96.3 | 260 |
| 4 | 🇷🇴 Romania | 95.6 | 1,826 |
| 5 | 🇵🇱 Poland | 94.1 | 3,557 |
| 6 | 🇪🇪 Estonia | 91.4 | 119 |
| 7 | 🇩🇪 Germany | 90.4 | 7,584 |
| 8 | 🇪🇸 Spain | 88.5 | 4,131 |
| 9 | 🇳🇦 Namibia | 85.7 | 223 |
| 10 | 🇭🇷 Croatia | 82.4 | 338 |
The Czech Republic is known for its affordable beer. In some parts of the country, beer can even cost less than bottled water.
Small Brewers and Technology
Beer production is expected to rise over the next decade, boosted by new smaller brewers, particularly in Western countries.
Investments have also been made in new technology to expedite the brewing process, including the utilization of ‘BeerBots’ capable of accelerating the fermentation process.
According to Future Market Insights, the global beer market is projected to be valued at $690 billion in 2023, rising to $996 billion by 2033.


Automotive
How People Get Around in America, Europe, and Asia
Examining how people get around using cars, public transit, and walking or biking, and the regional differences in usage.


How People Get Around in America, Europe, and Asia
This was originally posted on our Voronoi app. Download the app for free on iOS or Android and discover incredible data-driven charts from a variety of trusted sources.
This chart highlights the popularity of different transportation types in the Americas, Europe, and Asia, calculated by modal share.
Data for this article and visualization is sourced from ‘The ABC of Mobility’, a research paper by Rafael Prieto-Curiel (Complexity Science Hub) and Juan P. Ospina (EAFIT University), accessed through ScienceDirect.
The authors gathered their modal share data through travel surveys, which focused on the primary mode of transportation a person employs for each weekday trip. Information from 800 cities across 61 countries was collected for this study.
North American Car Culture Contrasts with the Rest of the World
In the U.S. and Canada, people heavily rely on cars to get around, no matter the size of the city. There are a few exceptions of course, such as New York, Toronto, and smaller college towns across the United States.
| Region | 🚗 Cars | 🚌 Public Transport | 🚶 Walking/Biking |
|---|---|---|---|
| North America* | 92% | 5% | 4% |
| Central America | 23% | 42% | 35% |
| South America | 29% | 40% | 31% |
| Northern Europe | 48% | 29% | 24% |
| Western Europe | 43% | 24% | 34% |
| Southern Europe | 50% | 24% | 25% |
| Eastern Europe | 35% | 40% | 25% |
| Southeastern Asia | 44% | 43% | 13% |
| Western Asia | 43% | 28% | 29% |
| Southern Asia | 22% | 39% | 39% |
| Eastern Asia | 19% | 46% | 35% |
| World | 51% | 26% | 22% |
Note: *Excluding Mexico. Percentages are rounded.
As a result, North America’s share of public transport and active mobility (walking and biking) is the lowest amongst all surveyed regions by a significant amount.
On the other hand, public transport reigns supreme in South and Central America as well as Southern and Eastern Asia. It ties with cars in Southeastern Asia, and is eclipsed by cars in Western Asia.
As outlined in the paper, Europe sees more city-level differences in transport popularity.
For example, Utrecht, Netherlands prefers walking and biking. People in Paris and London like using their extensive transit systems. And in Manchester and Rome, roughly two out of three journeys are by car.

-

 Markets5 days ago
Visualizing Global Inflation Forecasts (2024-2026)
-

 Green2 weeks ago
The Carbon Footprint of Major Travel Methods
-

 United States2 weeks ago
Visualizing the Most Common Pets in the U.S.
-

 Culture2 weeks ago
The World’s Top Media Franchises by All-Time Revenue
-

 voronoi1 week ago
Best Visualizations of April on the Voronoi App
-

 Wealth1 week ago
Charted: Which Country Has the Most Billionaires in 2024?
-

 Business1 week ago
The Top Private Equity Firms by Country
-

 Markets1 week ago
The Best U.S. Companies to Work for According to LinkedIn