Misc
A Visual Guide to Human Emotion
A Visual Guide to Human Emotion
Despite vast differences in culture around the world, humanity’s DNA is 99.9% similar.
There are few attributes more central and universal to the human experience than our emotions. Of course, the broad spectrum of emotions we’re capable of experiencing can be difficult to articulate. That’s where this brilliant visualization by the Junto Institute comes in.
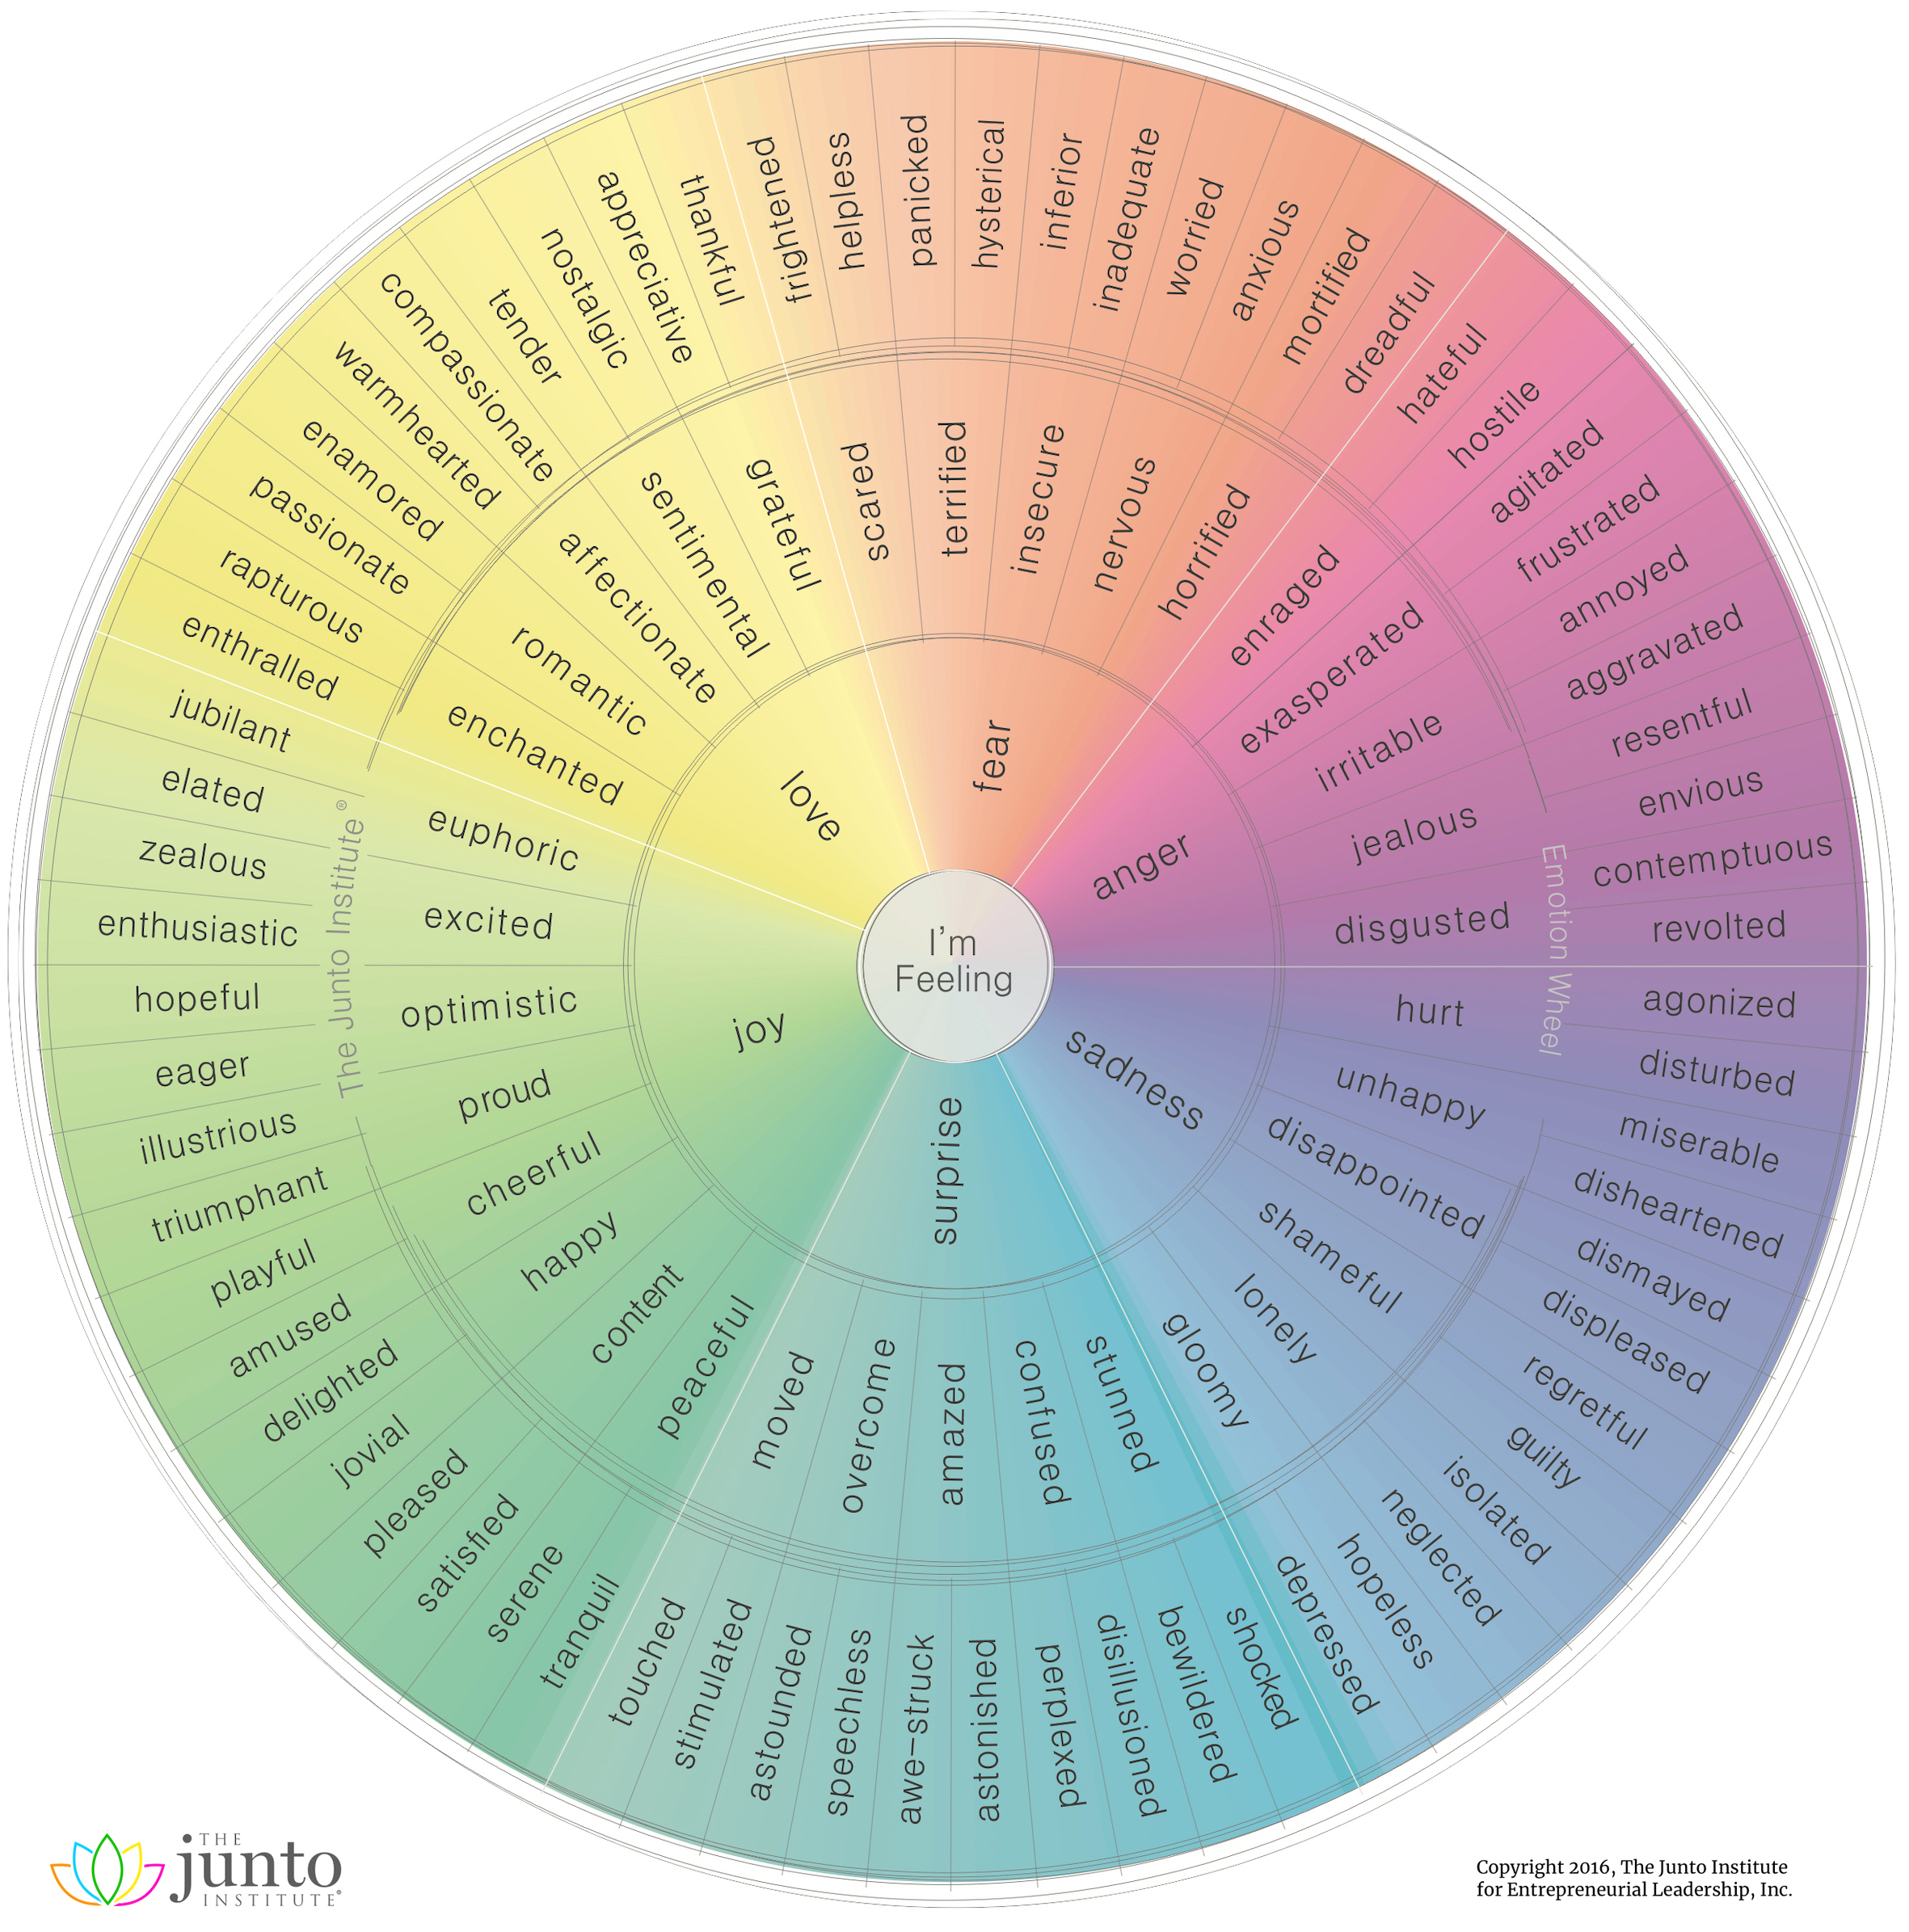
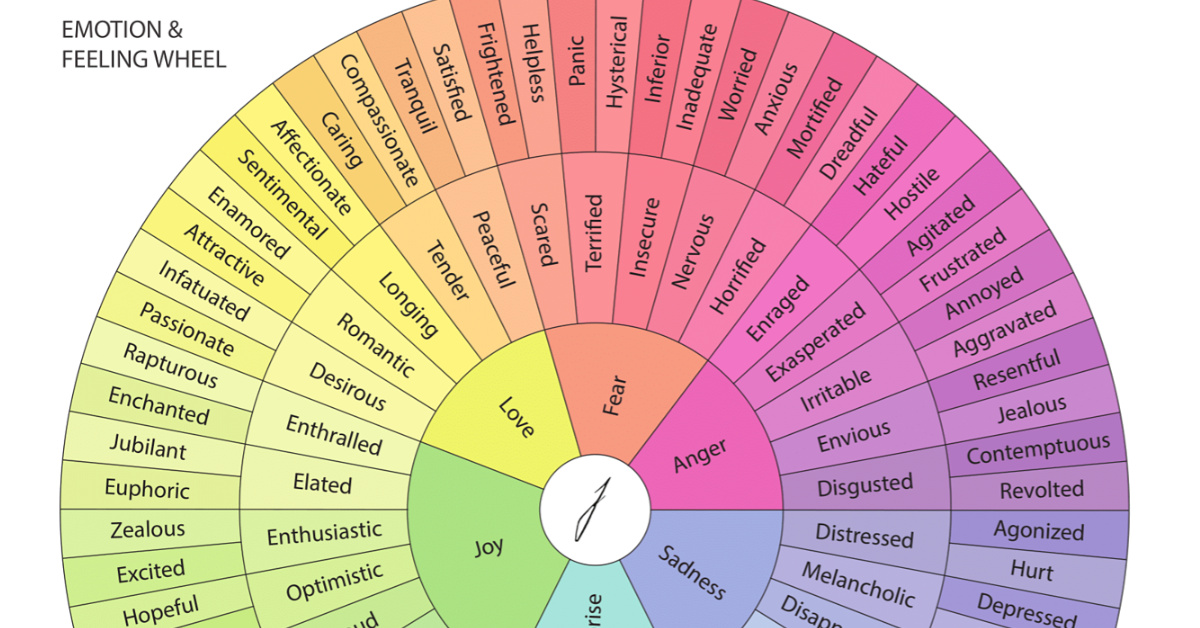
This circular visualization is the latest in an ongoing attempt to neatly categorize the full range of emotions in a logical way.
A Taxonomy of Human Emotion
Our understanding has come a long way since William James proposed four basic emotions – fear, grief, love, and rage—though these core emotions still form much of the foundation for current frameworks.
The wheel visualization above identifies six root emotions:
- Fear
- Anger
- Sadness
- Surprise
- Joy
- Love
From these six emotions, more nuanced descriptions emerge, such as jealousy as a subset of anger, and awe-struck as a subset of surprise. In total, there are 102 second- and third-order emotions listed on this emotion wheel.
Reinventing the Feeling Wheel
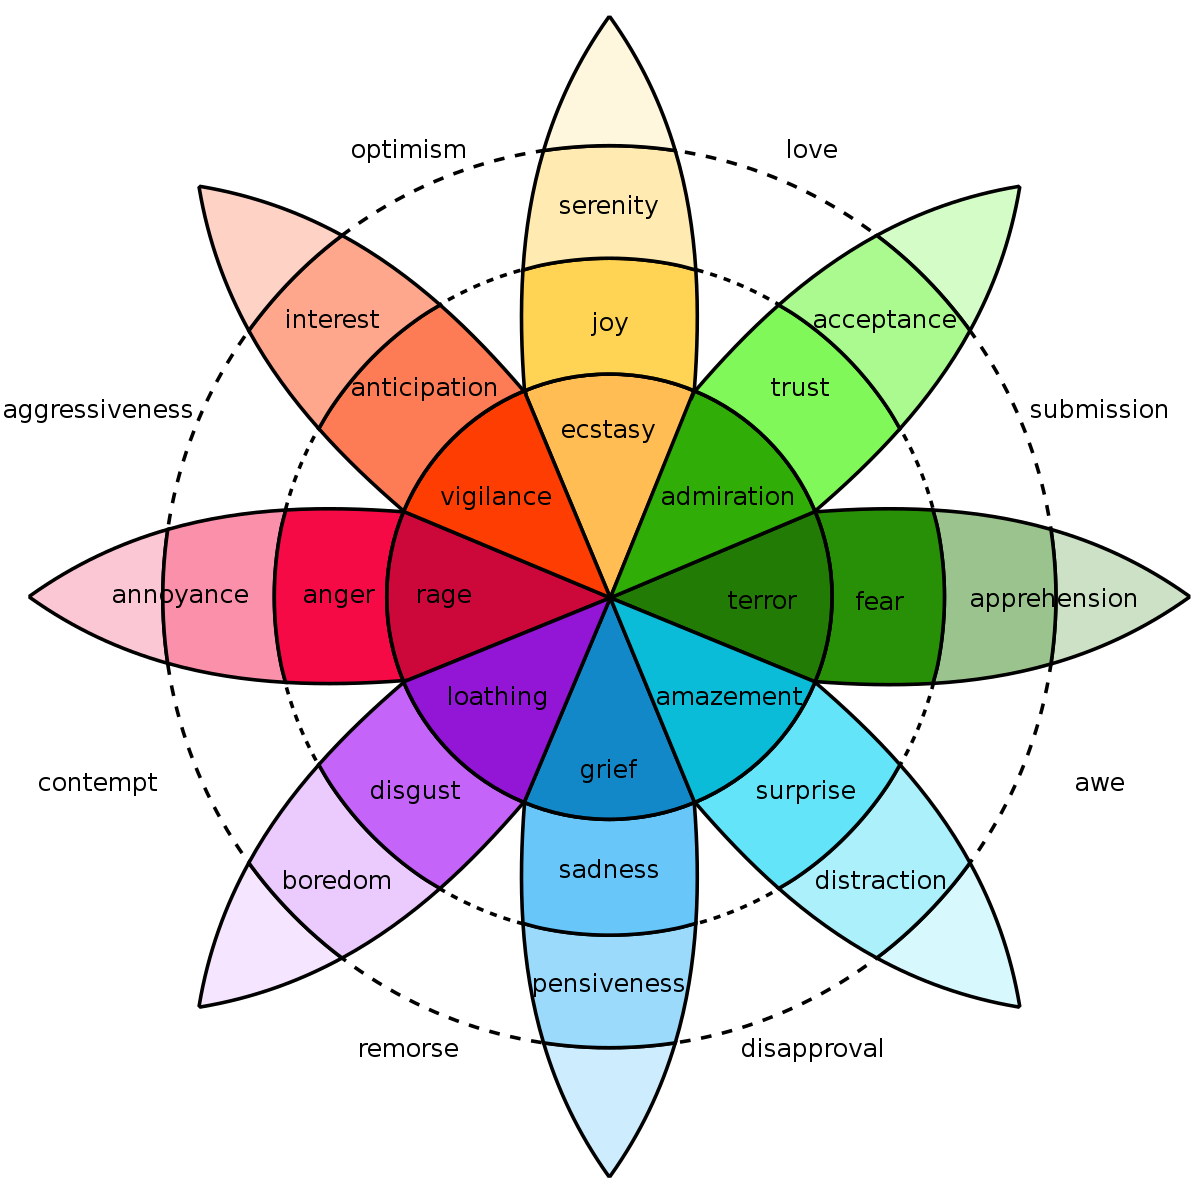
The concept of mapping the range of human emotions on a wheel picked up traction in the 1980s, and has evolved ever since.
One of these original concepts was developed by American psychologist Robert Plutchik, who mapped eight primary emotions—anger, fear, sadness, disgust, surprise, anticipation, trust, and joy. These “high survival value” emotions were believed to be the most useful in keeping our ancient ancestors alive.
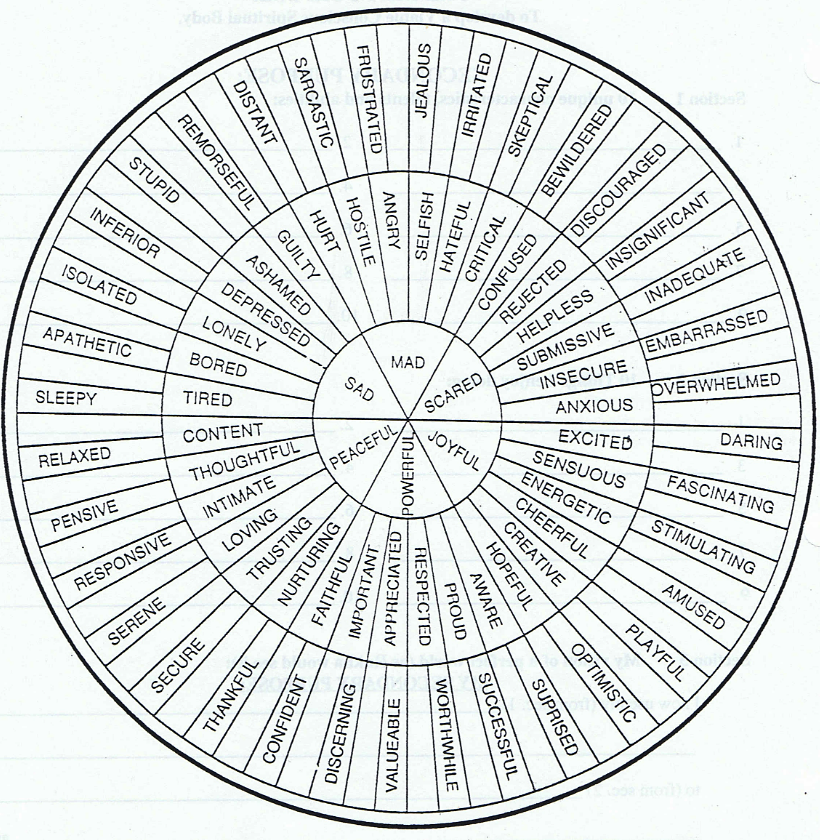
Another seminal graphic concept was developed by author Dr. Gloria Willcox. This version of the emotions wheel has spawned dozens of similar designs, as people continue to try to improve on the concept.
Further Exploration
The more we research human emotion, the more nuanced our understanding becomes in terms of how we react to the world around us.
Researchers at UC Berkeley used 2,185 short video clips to elicit emotions from study participants. Study participants rated the videos using 27 dimensions of self-reported emotional experience, and the results were mapped in an incredible interactive visualization. It is interesting to note that some video clips garnered a wide array of responses, while other clips elicit a near unanimous emotional response.
Here are some example videos and the distribution of responses:

The data visualization clusters these types of videos together, giving us a unique perspective on how people respond to certain types of stimuli.
Much like emotion itself, our desire to understand and classify the world around us is powerful and uniquely human.
Economy
Mapped: Southeast Asia’s GDP Per Capita, by Country
Indonesia, the region’s largest economy, makes the top five in this map exploring Southeast Asia’s GDP per capita levels.
Mapped: Southeast Asia’s GDP Per Capita, by Country
This was originally posted on our Voronoi app. Download the app for free on iOS or Android and discover incredible data-driven charts from a variety of trusted sources.
In 1937, as America navigated the Great Depression, Russian-born economist Simon Kuznets presented a novel idea on measuring a country’s economy. And thus, gross domestic product (GDP) was born.
Nearly eight decades later, measuring GDP, and GDP per capita—which helps make data comparable between populations—has become a benchmark statistic to compare and contrast countries’ economies and productivity.
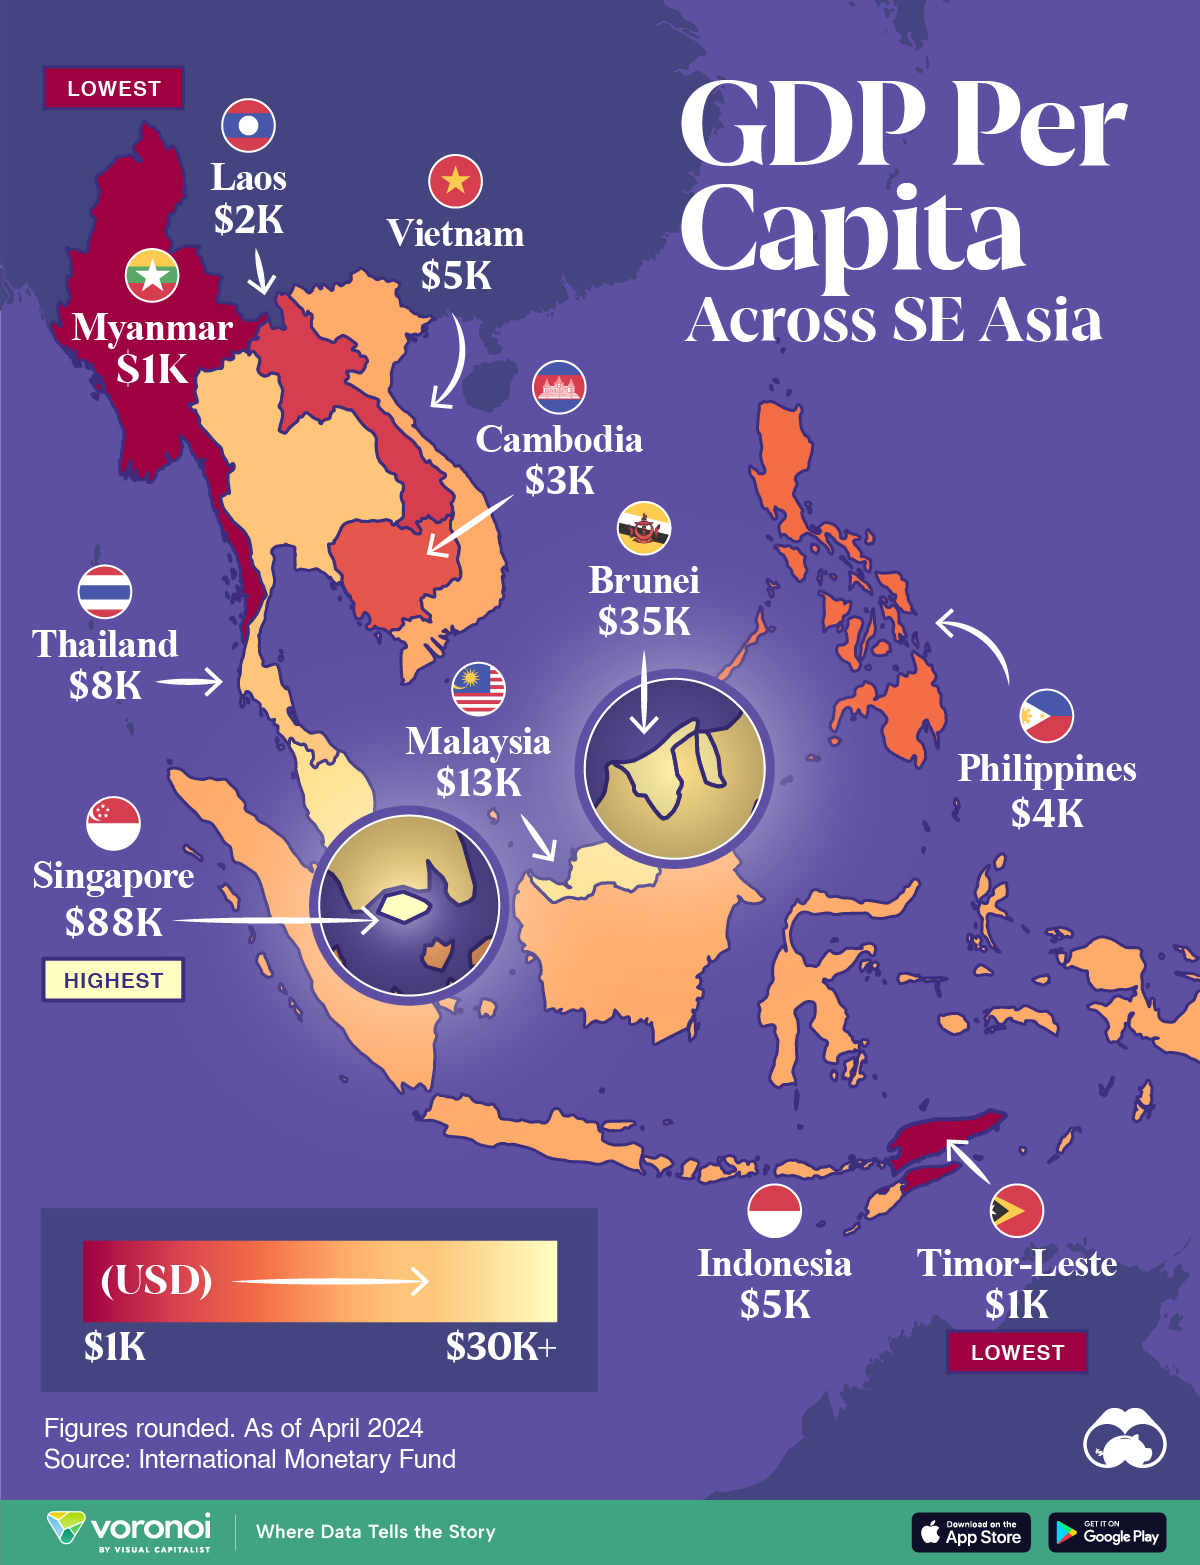
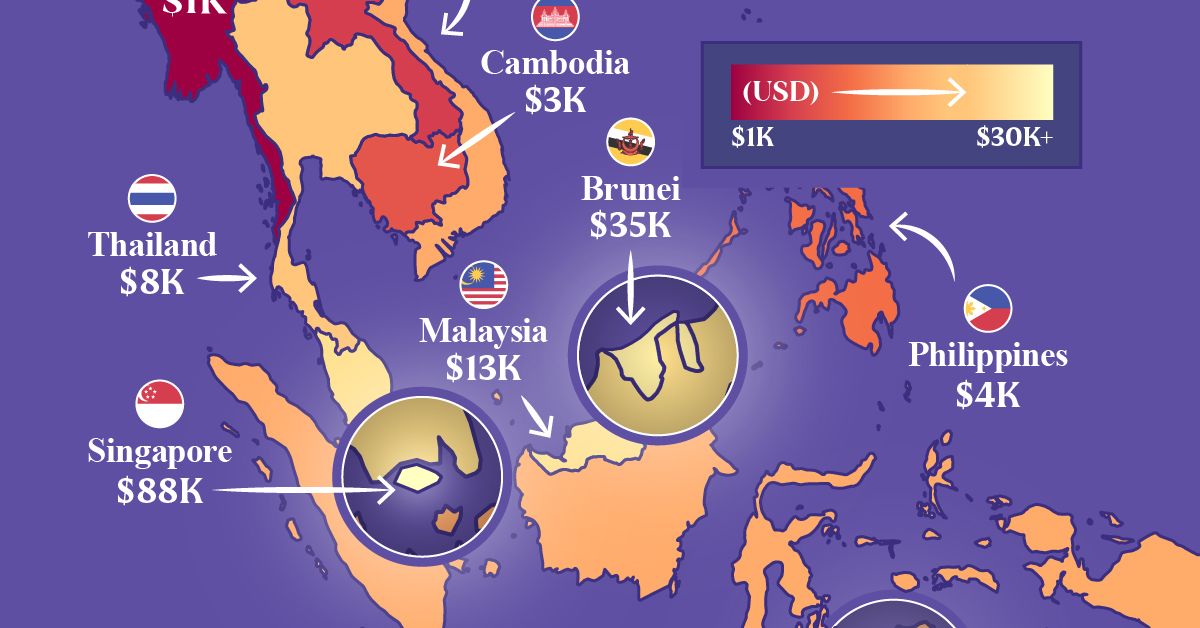
In this map, we compare Southeast Asia’s GDP per capita levels. Data is in current U.S. dollars, sourced from the International Monetary Fund’s DataMapper tool, last updated April 2024.
Ranked: Southeast Asian Countries by GDP Per Capita
Singapore stands head-and-shoulders above the rest of the region with a per capita GDP past $88,000. It is also, incidentally, one of the richest nations in the world by this metric.
The 734 km² country has only 5.6 million residents and very few natural resources. However the country’s strategic location makes it a center for trade and commerce.
| Country | GDP Per Capita |
|---|---|
| 🇸🇬 Singapore | $88,450 |
| 🇧🇳 Brunei | $35,110 |
| 🇲🇾 Malaysia | $13,310 |
| 🇹🇭 Thailand | $7,810 |
| 🇮🇩 Indonesia | $5,270 |
| 🇻🇳 Vietnam | $4,620 |
| 🇵🇭 Philippines | $4,130 |
| 🇰🇭 Cambodia | $2,630 |
| 🇱🇦 Laos | $1,980 |
| 🇹🇱 Timor-Leste | $1,450 |
| 🇲🇲 Myanmar | $1,250 |
Note: Figures are rounded.
This is in sharp contrast to Brunei, Southeast Asia’s next richest country, with a per capita GDP of $35,110.
Oil is a critical part of Brunei’s economy, making it both very wealthy, but landing it in a vulnerable, resource-dependent position. Oil and gas revenues contribute half the country’s entire revenue receipts.
Two countries known for their large tourism sectors, Malaysia and Thailand rank third and fourth, at $13,310 and $7,810 respectively.
Finally, Southeast Asia’s largest economy, and the world’s fourth-most populous country Indonesia, rounds out the top five with a GDP per capita of $5,270.

-

 Brands5 days ago
The Evolution of U.S. Beer Logos
-

 Culture2 weeks ago
The World’s Top Media Franchises by All-Time Revenue
-

 voronoi2 weeks ago
Best Visualizations of April on the Voronoi App
-

 Wealth2 weeks ago
Charted: Which Country Has the Most Billionaires in 2024?
-

 Business1 week ago
The Top Private Equity Firms by Country
-

 Markets1 week ago
The Best U.S. Companies to Work for According to LinkedIn
-

 Economy1 week ago
Ranked: The Top 20 Countries in Debt to China
-

 Politics1 week ago
Charted: Trust in Government Institutions by G7 Countries