Maps
Mapped: Population Growth by Region (1900-2050F)
![]() See this visualization first on the Voronoi app.
See this visualization first on the Voronoi app.
Mapping Population Growth by Region
This was originally posted on our Voronoi app. Download the app for free on iOS or Android and discover incredible data-driven charts from a variety of trusted sources.
In fewer than 50 years, the world population has doubled in size, jumping from 4 to 8 billion.
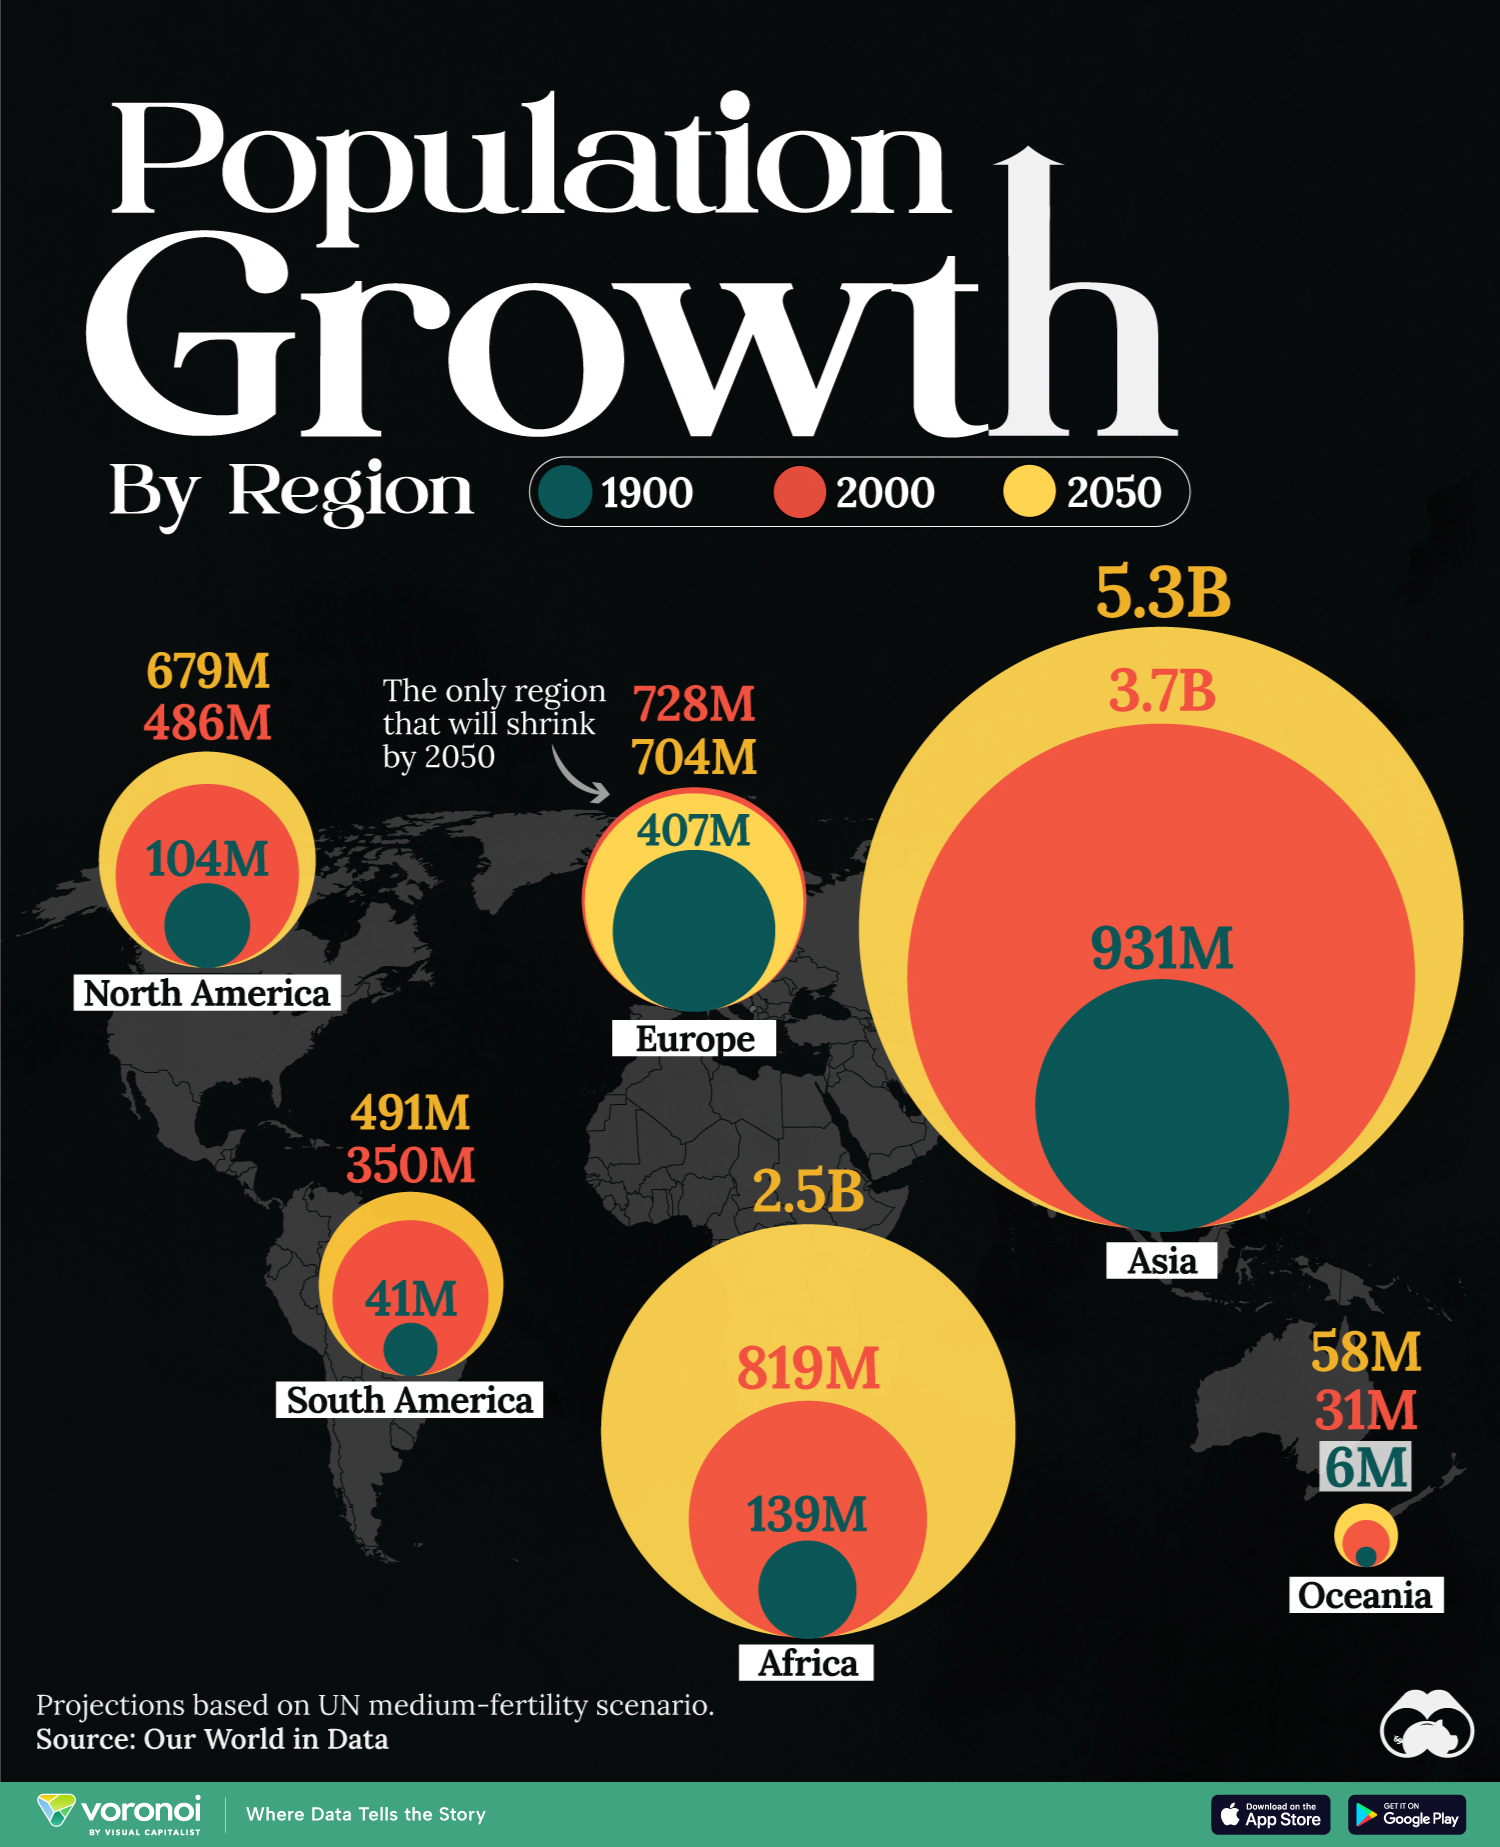
In this visualization, we map the populations of major regions at three different points in time: 1900, 2000, and 2050 (forecasted). Figures come from Our World in Data as of March 2023, using the United Nations medium-fertility scenario.
Population by Continent (1900-2050F)
Asia was the biggest driver of global population growth over the course of the 20th century. In fact, the continent’s population grew by 2.8 billion people from 1900 to 2000, compared to just 680 million from the second on our list, Africa.
| Region | 1900 | 2000 | 2050F |
|---|---|---|---|
| Asia | 931,021,418 | 3,735,089,775 | 5,291,555,919 |
| Africa | 138,752,199 | 818,952,374 | 2,485,135,689 |
| Europe | 406,610,221 | 727,917,165 | 704,398,730 |
| North America | 104,231,973 | 486,364,446 | 679,488,449 |
| South America | 41,330,704 | 349,634,344 | 491,078,697 |
| Oceania | 5,936,615 | 31,223,133 | 57,834,753 |
| World 🌐 | 1,627,883,130 | 6,149,181,237 | 9,709,492,237 |
China was the main source of Asia’s population expansion, though its population growth has slowed in recent years. That’s why in 2023, India surpassed China to become the world’s most populous country.
Southeast Asian countries like the Philippines and Indonesia have also been big drivers of Asia’s population boom to this point.
The Future: Africa to Hit 2.5 Billion by 2050
Under the UN’s medium-fertility scenario (all countries converge at a birthrate of 1.85 children per woman by 2050), Africa will solidify its place as the world’s second most populous region.
Three countries—Nigeria, Ethiopia, and Egypt—will account for roughly 30% of that 2.5 billion population figure.
Meanwhile, both North America and South America are expected to see a slowdown in population growth, while Europe is the only region that will shrink by 2050.
A century ago, Europe’s population was close to 30% of the world total. Today, that figure stands at less than 10%.


Economy
Mapped: Southeast Asia’s GDP Per Capita, by Country
Indonesia, the region’s largest economy, makes the top five in this map exploring Southeast Asia’s GDP per capita levels.
Mapped: Southeast Asia’s GDP Per Capita, by Country
This was originally posted on our Voronoi app. Download the app for free on iOS or Android and discover incredible data-driven charts from a variety of trusted sources.
In 1937, as America navigated the Great Depression, Russian-born economist Simon Kuznets presented a novel idea on measuring a country’s economy. And thus, gross domestic product (GDP) was born.
Nearly eight decades later, measuring GDP, and GDP per capita—which helps make data comparable between populations—has become a benchmark statistic to compare and contrast countries’ economies and productivity.
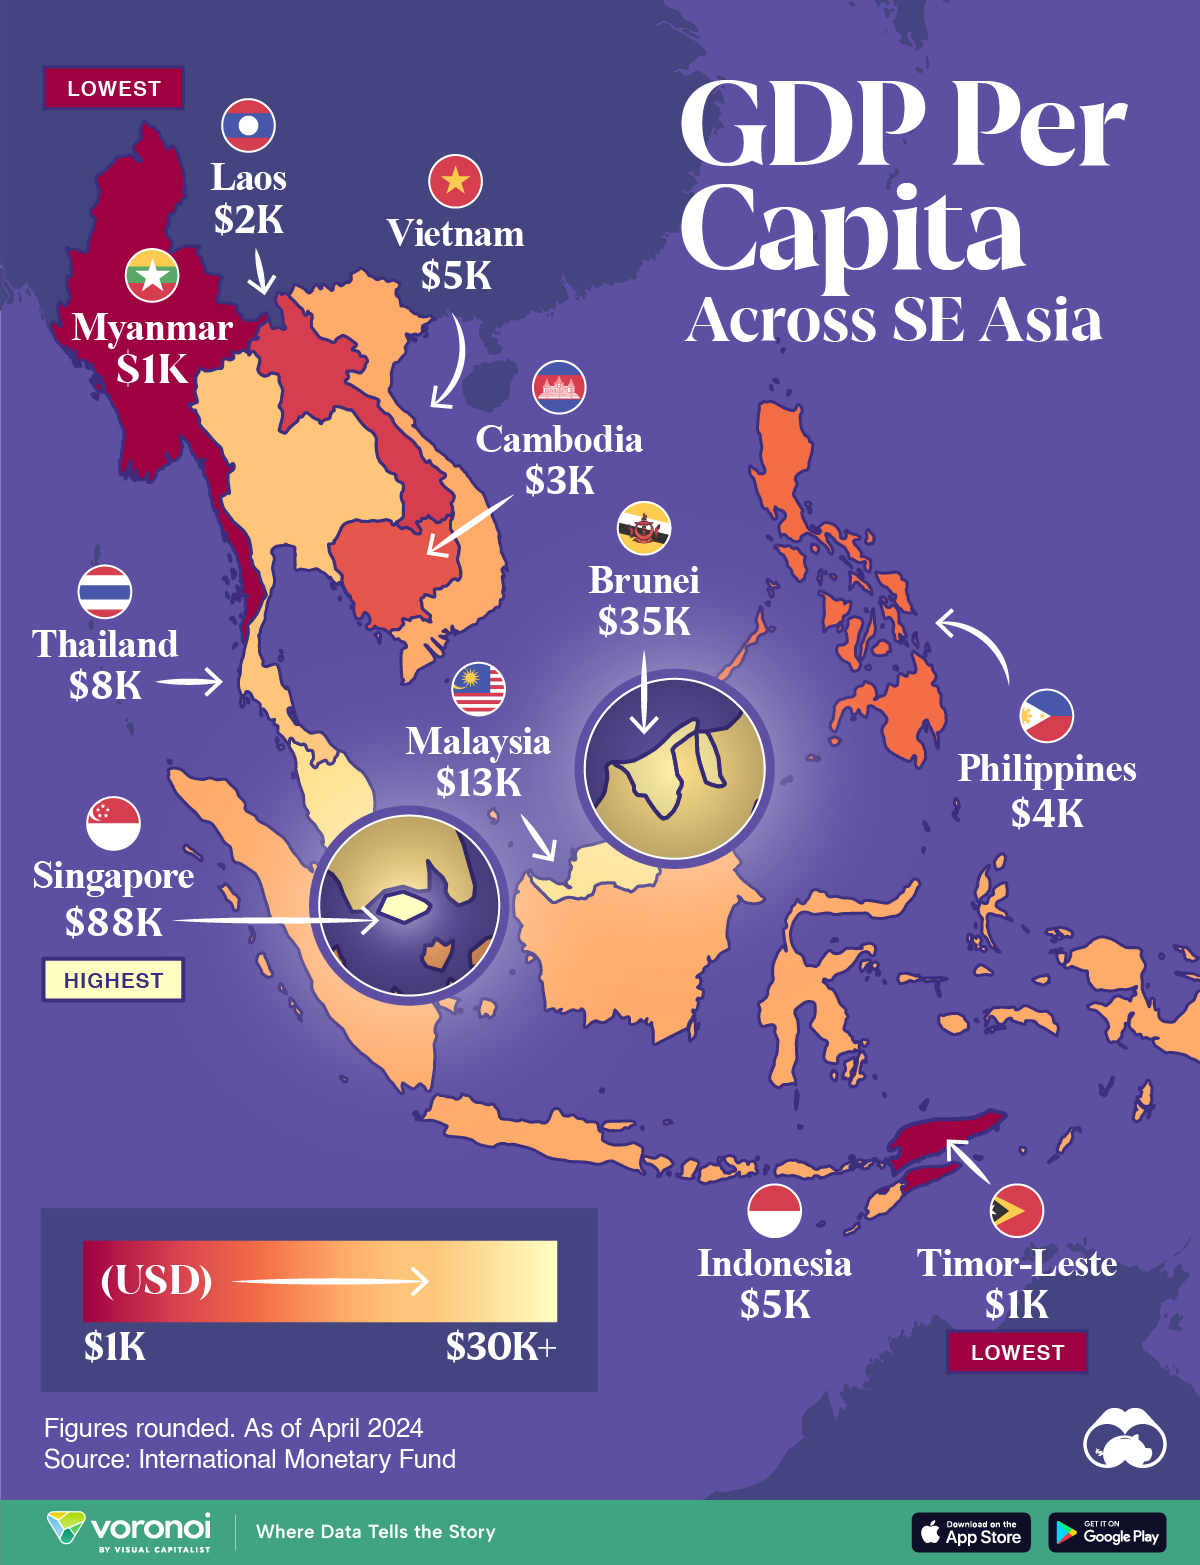
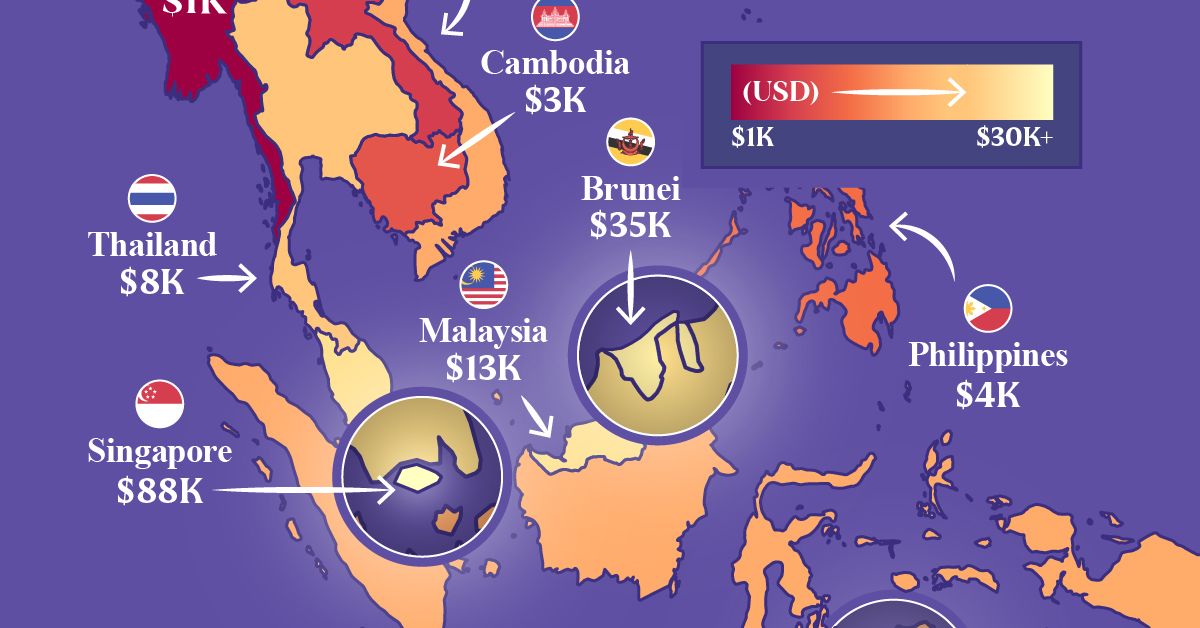
In this map, we compare Southeast Asia’s GDP per capita levels. Data is in current U.S. dollars, sourced from the International Monetary Fund’s DataMapper tool, last updated April 2024.
Ranked: Southeast Asian Countries by GDP Per Capita
Singapore stands head-and-shoulders above the rest of the region with a per capita GDP past $88,000. It is also, incidentally, one of the richest nations in the world by this metric.
The 734 km² country has only 5.6 million residents and very few natural resources. However the country’s strategic location makes it a center for trade and commerce.
| Country | GDP Per Capita |
|---|---|
| 🇸🇬 Singapore | $88,450 |
| 🇧🇳 Brunei | $35,110 |
| 🇲🇾 Malaysia | $13,310 |
| 🇹🇭 Thailand | $7,810 |
| 🇮🇩 Indonesia | $5,270 |
| 🇻🇳 Vietnam | $4,620 |
| 🇵🇭 Philippines | $4,130 |
| 🇰🇭 Cambodia | $2,630 |
| 🇱🇦 Laos | $1,980 |
| 🇹🇱 Timor-Leste | $1,450 |
| 🇲🇲 Myanmar | $1,250 |
Note: Figures are rounded.
This is in sharp contrast to Brunei, Southeast Asia’s next richest country, with a per capita GDP of $35,110.
Oil is a critical part of Brunei’s economy, making it both very wealthy, but landing it in a vulnerable, resource-dependent position. Oil and gas revenues contribute half the country’s entire revenue receipts.
Two countries known for their large tourism sectors, Malaysia and Thailand rank third and fourth, at $13,310 and $7,810 respectively.
Finally, Southeast Asia’s largest economy, and the world’s fourth-most populous country Indonesia, rounds out the top five with a GDP per capita of $5,270.

-

 Brands5 days ago
The Evolution of U.S. Beer Logos
-

 Culture2 weeks ago
The World’s Top Media Franchises by All-Time Revenue
-

 voronoi2 weeks ago
Best Visualizations of April on the Voronoi App
-

 Wealth2 weeks ago
Charted: Which Country Has the Most Billionaires in 2024?
-

 Business1 week ago
The Top Private Equity Firms by Country
-

 Markets1 week ago
The Best U.S. Companies to Work for According to LinkedIn
-

 Economy1 week ago
Ranked: The Top 20 Countries in Debt to China
-

 Politics1 week ago
Charted: Trust in Government Institutions by G7 Countries